In this article, you will get know how to set up your first prediction based on regression and/or classification model.
- **Regression** model is suited for creating predictions that return numerical results. It's best used in cases such as:
- Predicting the amount of money spent by particular group of customers in a defined time range.
- Predicting the amount of items purchased in the defined time range.
- **Classification** model is suited for performing the analyses that return the true/false (or 1/0) values. It's best used when you want to find answers to the questions such as:
- Will a customer belong to a particular group of customers?
- Will a customer leave in the next 30 days?
You can create a prediction from scratch or by using predefined scenarios:
- Find customers who are likely to leave
- Find customers who are likely to unsubscribe
- Find customers who are likely to generate the most value or take significant actions
- Find customers who belong to a class
- Find customers who will buy through a specific communication channel
Predefined scenarios are configured using a user-friendly wizard that allows you to adjust scenario settings according to your preferences. This is done through a step-by-step configuration form, which provides hints on the interface to guide you. The option of creating a prediction based on a predefined scenario is available in the initial part of creating the prediction ([Select the model type](#select-the-model-type)).
## Prerequisites
---
- [Enable the Custom predictions](/docs/ai-hub/predictions/enabling-predictions#enabling-regression-and-classification-predictions). It usually takes several hours to initialize Predictions and perform necessary calculations.
- You should know how to create segmentations or have a segment of customers ready for use as the prediction target.
- Create an expression based on which the prediction will be made. For example, if you use an expression that calculates Email Open Rate in last 30 days, you will get a prediction for Email Open Rate for the next 30 days.
## Configure a prediction
---
### Select the model type
1. Go to **AI Hub > (AI Predictions) Models**.
2. Click **New prediction**.
1. On the pop-up select one of the following options:
- **Use predefined prediction** - This option allows you to use the ready-made prediction scenarios and adjust its settings to your preferences in a user-friendly, step-by-step configuration form by following hints shown on the interface. If you select this option, you can skip reading the rest of the article.
- **Create from scratch** - This option allows you to create your own configuration of the prediction to achieve your custom business objective. If you use this option, select one of the following models:
- **Regression** - to create a prediction that returns a numerical value
- **Classification** - to create a prediction that returns a `true`/`false` value
### Select customers to be analyzed
---
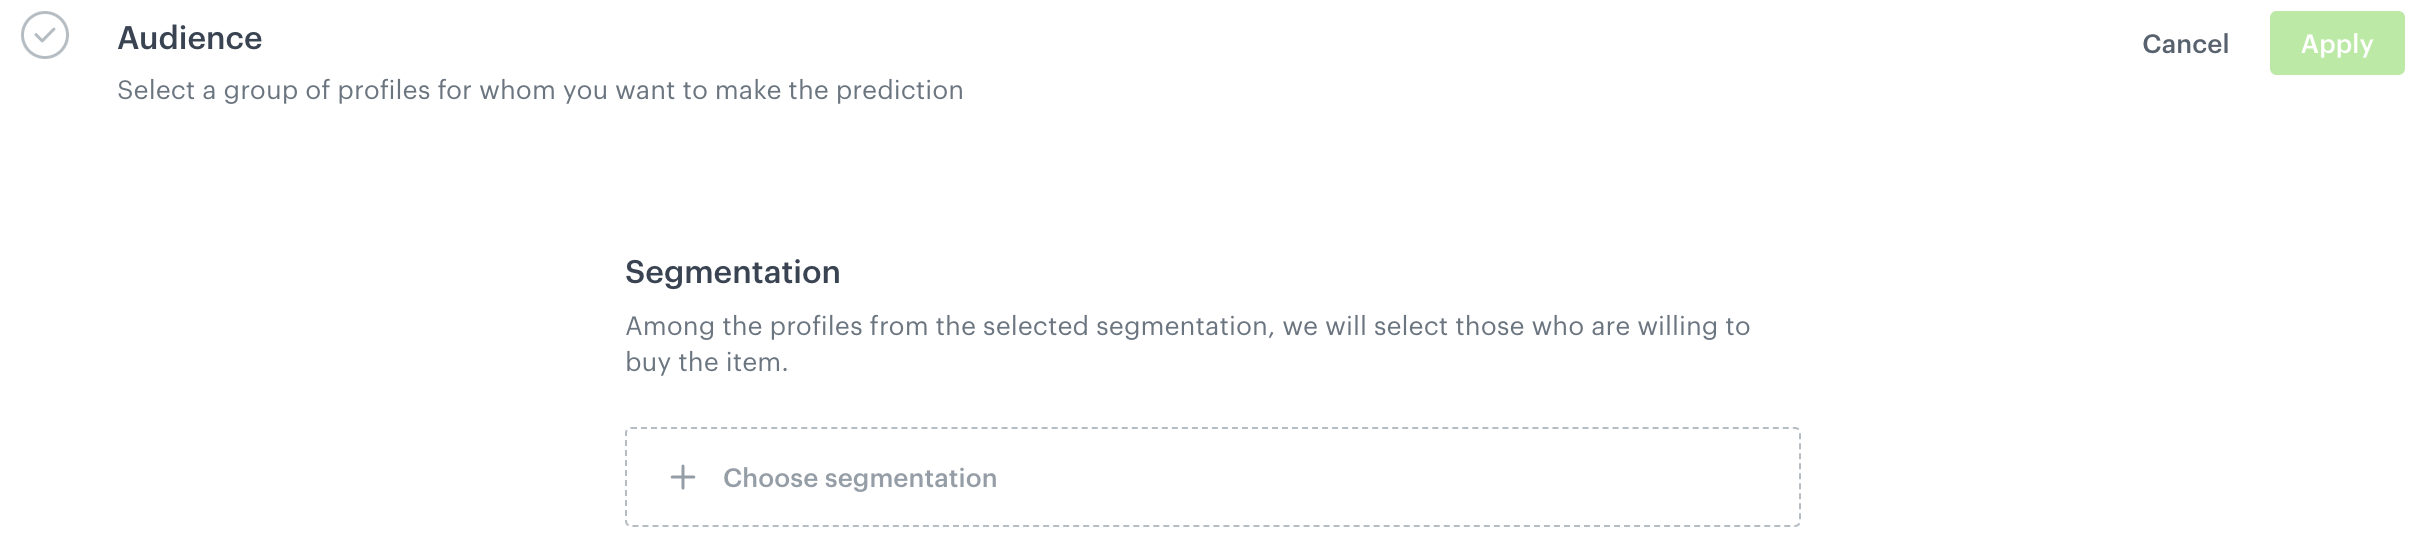
Select the audience for whom you want to prepare a prediction.
Selecting a group of customers
1. In the **Audience** section, click **Define**.
2. Click **Choose segmentation** and perform one of the following actions:
- From the list, select an existing segmentation.
You can use the search field.
- To define a new group segmentation, at the bottom of the dropdown list, click the **Create new** button.
1. In the **Segmentation name** field, enter the name of the group of customers and click **Next step**.
2. Build the segmentation.
See [this article](/docs/analytics/segmentations/creating-segmentations) for instructions.
3. Click **Create segmentation**.
3. Confirm by clicking **Apply**.
### Choose the prediction target
---
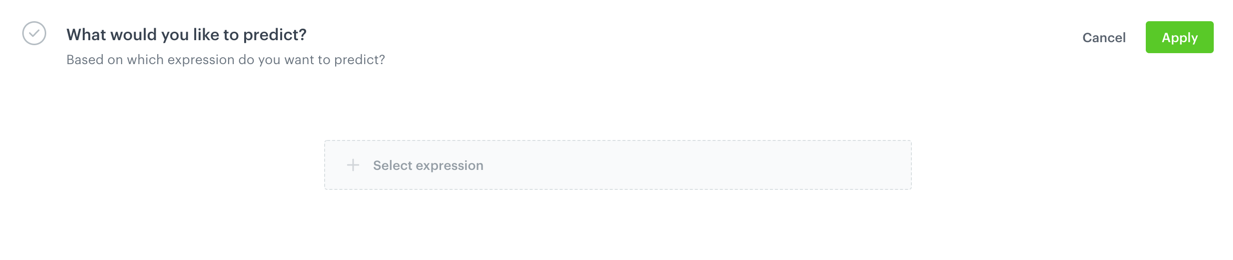
Select the expression based on which the prediction will be made. For example, if you select an expression that calculates Email Open Rate in last 30 days, you will get prediction for Email Open Rate for the next 30 days.
Selecting an expression to define the scope of prediction
1. From the dropdown list, select the expression you prepared previously.
2. Confirm by clicking **Apply**.
### Select events
---
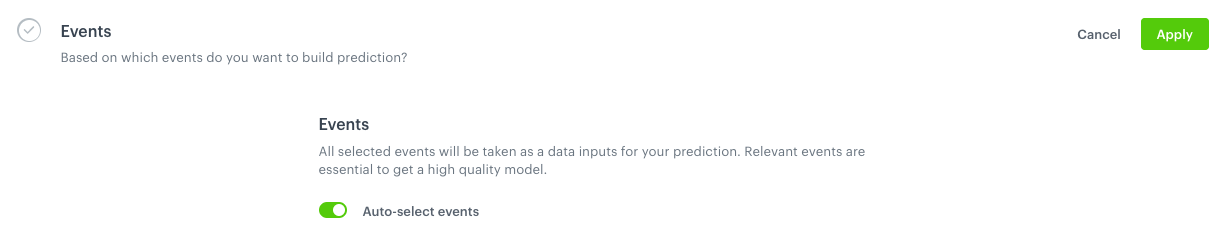
[Events](/docs/assets/events/introduction-to-events) are customer activities on the website (visits to a website, adding a product to a shopping cart, and so on) and also your activities towards customers (such as sending messages to them). Select the events that the system will use as input to make a prediction. By default, the list already contains the events recommended for the prediction you are creating. The contents of the list is defined while enabling [Custom predictions](/docs/ai-hub/predictions/enabling-predictions#enabling-regression-and-classification-predictions).
Selection of features to support predicting model
1. To select events, disable the **Auto-select events** option.
2. Click **Add events**.
3. On the pop-up, select the events.
4. Confirm your choice by clicking **Add**.
3. Confirm the settings in this section by clicking **Apply**.
### Schedule recalculation and result settings
---
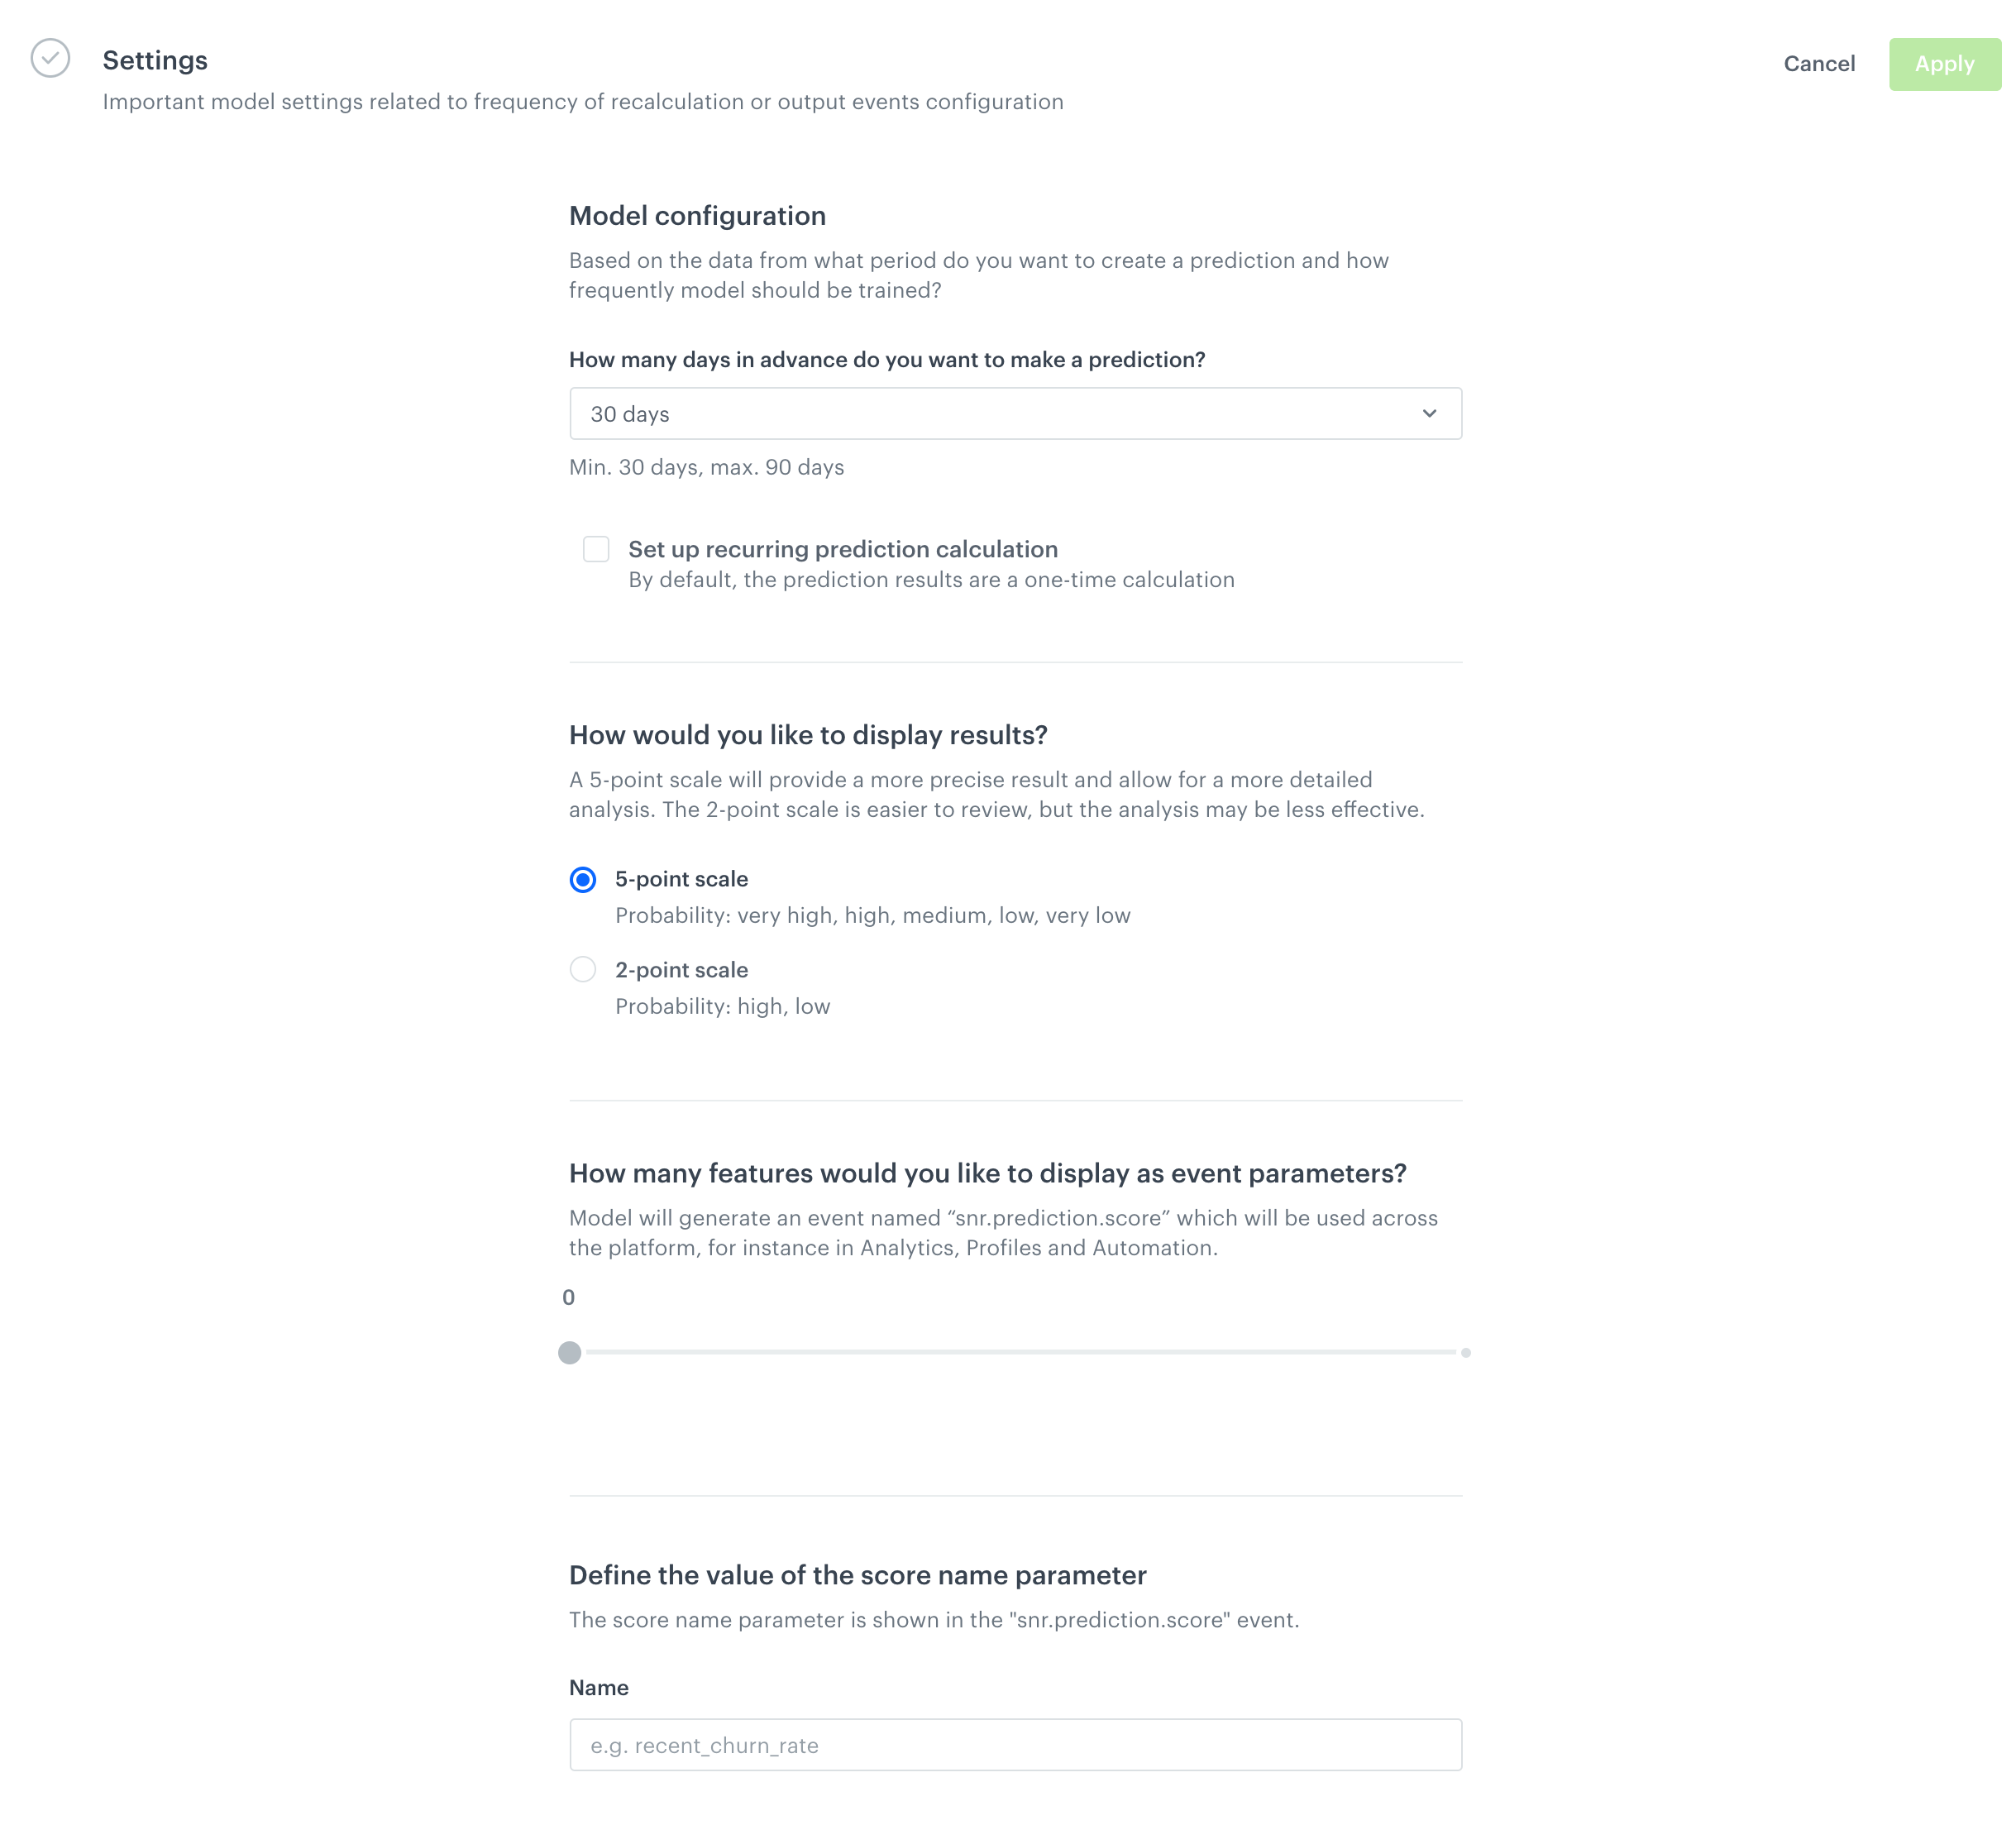
In this section, define the frequency of recalculating the prediction and settings of the event that is generated for customers for whom the prediction is made.
The Settings section
1. In the **Model configuration** section, select the number of days after which the prediction is recalculated.
2. From the **How far in advance do you want to make a prediction?** dropdown, select the number of days for which you want to make a prediction (calculated from the current date).
3. To switch on repeatable calculation of the prediction, select the **Set up recurring prediction calculation** checkbox.
By default, the calculation is performed once.
4. In the **How would you like to display results?** section, select the scale of prediction results - two- or five-point scale.
The scale is represented as a `score_label` parameter of the `snr.prediction.score` event.
5. Use the slider to define the number of features displayed in the parameters of the event generated for a customer for whom the prediction was made.
One of the features is a `prediction` parameter, it is included in the `snr.prediction.score` event and it can be used while selecting customers for your campaigns.
6. In the **Name** field, enter the value of the `scoreName` parameter of the event generated (`snr.prediction.score`) when a prediction is made.
You can use the following characters:
- a-z - only lower case
- 0-9
- special characters: `.` and `_`
1. Click **Apply**.
### Save the prediction
To save the prediction:
- as a draft, click **Save**.
- and calculate, click **Save & Calculate**.
You can check the logs of the activated prediction. [Learn more](/docs/ai-hub/predictions/predictions-functionalities#previewing-logs).
**Result**: The output of the prediction is an event generated on the profile card.
## Understanding prediction events
---
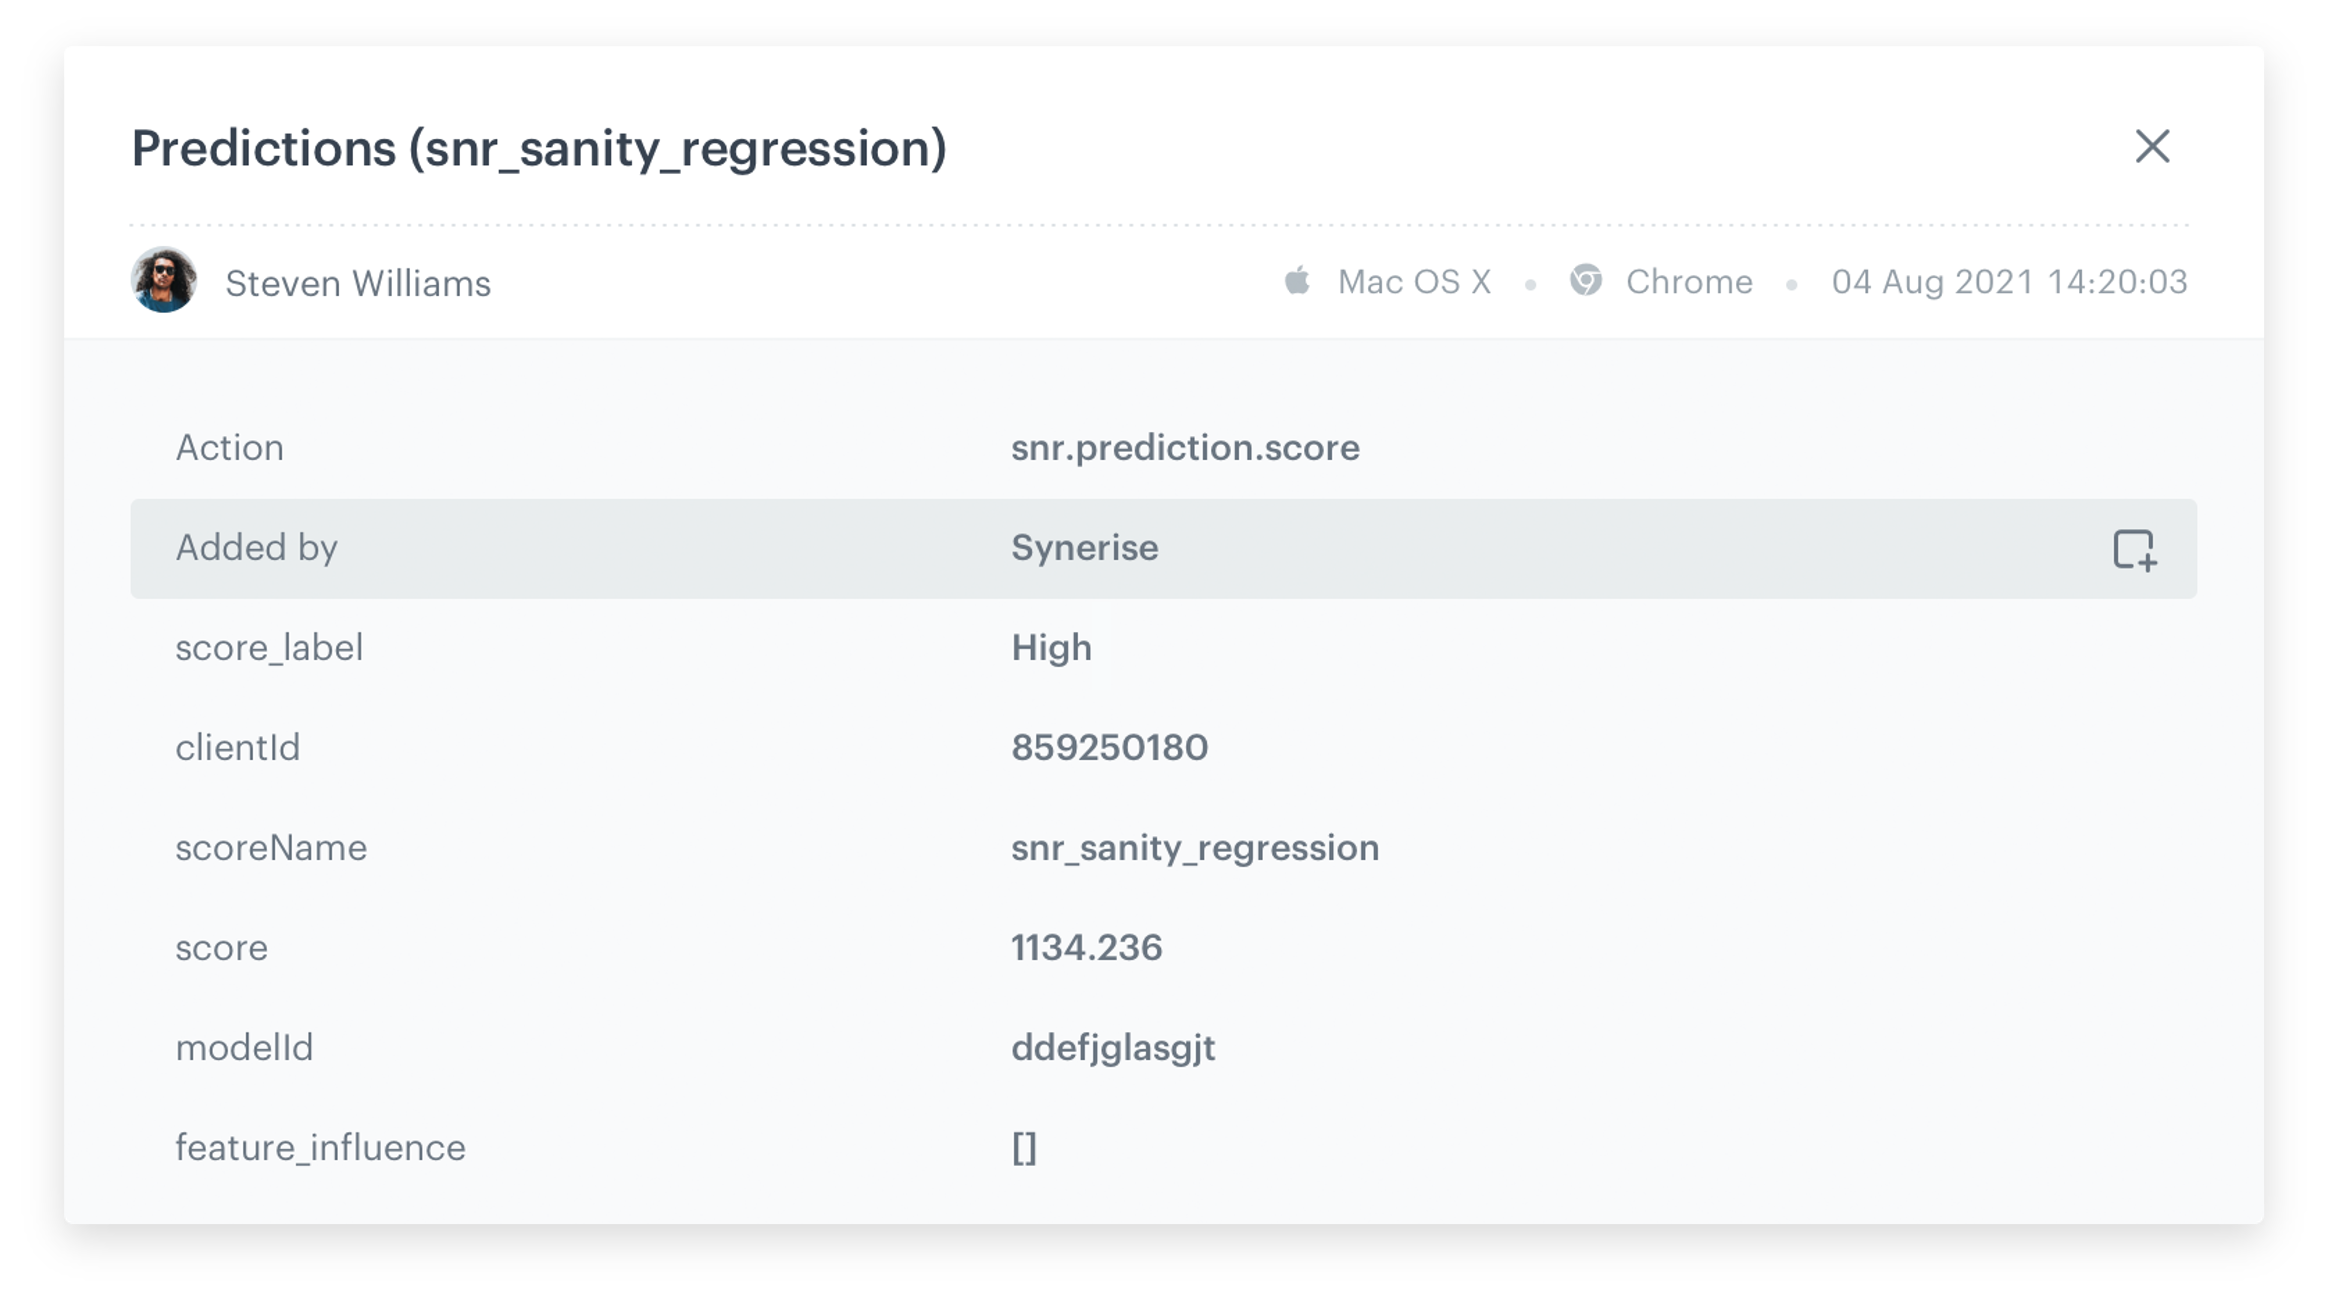
The outcomes of predictions based on the regression and classification models are saved as `snr.prediction.score` events in the Synerise platform. Thanks to that, the predictions events are available in Decision, Experience or Automation Hubs. The schema of a prediction event is standardized. The attributes are explained in the table below the figure.
snr.prediction.score event
| Attribute name | Description |
|-------------|-------------------------------------------------------------------------------------------------|
| action | An event type for the prediction - `snr.prediction.score` |
| added by | An entity that generated this event. In the case of prediction events, it is always Synerise. |
| modelId | A unique identifier of the prediction |
| modelName | The name of the prediction |
| score_label | Prediction output: two- or five-point scale label. You can select the scale in the [settings of the prediction](#schedule-recalculation-and-result-settings). |
| scoreName (deprecated) | The name of the prediction assigned while [creating a prediction](#schedule-recalculation-and-result-settings) |
| score | The result of the prediction (based on the expression which was selected as a target while preparing a prediction). |
| percentile | [Prediction percentile](/docs/glossary#percentiles) |
| classes | Available classes: `true`, `false` (only for the [Classification](#select-the-model-type) type of model)|
| prediction | Predicted class (only for [Classification](#select-the-model-type) type of model) |
| feature_influence | [Local feature importance](/docs/glossary#feature-importance) |
| clientId | Customer's identifier |
| time | Time when a prediction was generated, as a Unix timestamp |
| configurationVersion | Allows to verify whether two consecutive calculations ran with the settings (*only for debug*) |
| modelVersion | Model version allows to verify whether two consecutive calculations ran on the same model parameters (*only for debug*) |