In this article, you will get know how to set up your first Lookalikes prediction. Lookalikes let you compare two segments of customers and find those who display similar qualities of performance. This can be used, for example, to target a marketing campaign at customers alike to those who reacted well to a previous iteration of that campaign.
You can create a lookalike prediction from scratch or by using a predefined scenario: "Find best matching customers for an annual/seasonal campaign".
Predefined scenarios are configured using a user-friendly wizard that allows you to adjust scenario settings according to your preferences. This is done through a step-by-step configuration form, which provides hints on the interface to guide you. The option of creating a prediction based on a predefined scenario is available in the initial part of creating the prediction ([Select the model type](#select-the-model-type)).
## Prerequisites
---
- [Configure AI engine](/docs/settings/configuration/ai-engine-configuration/engine-configuration-for-propensity).
- [Enable the Lookalikes predictions](/docs/ai-hub/predictions/enabling-predictions#enabling-lookalikes). It usually takes several hours to initialize Predictions and perform necessary calculations.
- You should know how to create [segmentations](/docs/analytics/segmentations) or have a segment of customers ready for use as the source.
## Configure a prediction
### Select the model type
1. Go to **AI Hub > (AI Predictions) Models**.
2. Click **New prediction**.
1. On the pop-up select one of the following options:
- **Use predefined prediction** - This option allows you to use the ready-made prediction scenarios and adjust its settings to your preferences in a user-friendly, step-by-step configuration form by following hints shown on the interface. If you select this option, you can skip reading the rest of the article.
- **Create from scratch** - This option allows you to create your own configuration of a lookalikes prediction to achieve your custom business objective. If you use this option, select **Lookalikes**.
### Select source and target
The **Audience** section of the prediction configuration include the definitions of two segments.
- The **source** segment contains the "model" customers. This can be, for example, a segment of customers with the best reaction to a past marketing campaign.
- The **target** segment contains customers who you want to compare with the source segment and find the ones who are similar to the source group.
1. In the **Audience** section, click **Define**.
1. In the **Source segmentation** sub-section, click **Choose segmentation**.
2. Perform one of the following actions:
1. Select an existing segmentation (you can use the search field).
2. Click **Create new** and create a new segmentation.
Instructions for creating segmentations are available [here](/docs/analytics/segmentations).
The segmentation will also be available for later use in the list of segmentation.
4. In the **Source segmentation** sub-section, choose or create a segmentation in the same way as the target.
5. Click **Apply**.
### Additional configuration
By default, the calculation is performed once and the results are presented on a 5-point scale.
1. If you want to leave the settings as default, the predictions is ready to calculate. Continue to [saving the prediction](#save-the-prediction).
2. If you want to change the settings, in the **Settings** section, click **Change**.
3. To schedule a recurring calculation:
1. Select the **Set up recurring prediction calculation** checkbox.
2. In the input field, enter the number of days between calculations.
4. To change the scale from 5-point to 2-point, select the **2-point scale** radio button.
5. Click **Apply**.
### Save the prediction
To save the prediction:
- as a draft, click **Save**.
- and calculate, click **Save & Calculate**.
You can check the logs of the activated prediction. [Learn more](/docs/ai-hub/predictions/predictions-functionalities#previewing-logs).
## Results
The maximum calculation time is 24 hours. When it ends, the results are saved as events in the profiles of all customers of the target segmentation. The `score_label` parameter of the event shows the scale of similarity on a 2- or 5-point scale.
You can use these events, for example, to build a new segmentation for use as the target of a marketing campaign.
## Understanding Lookalikes prediction events
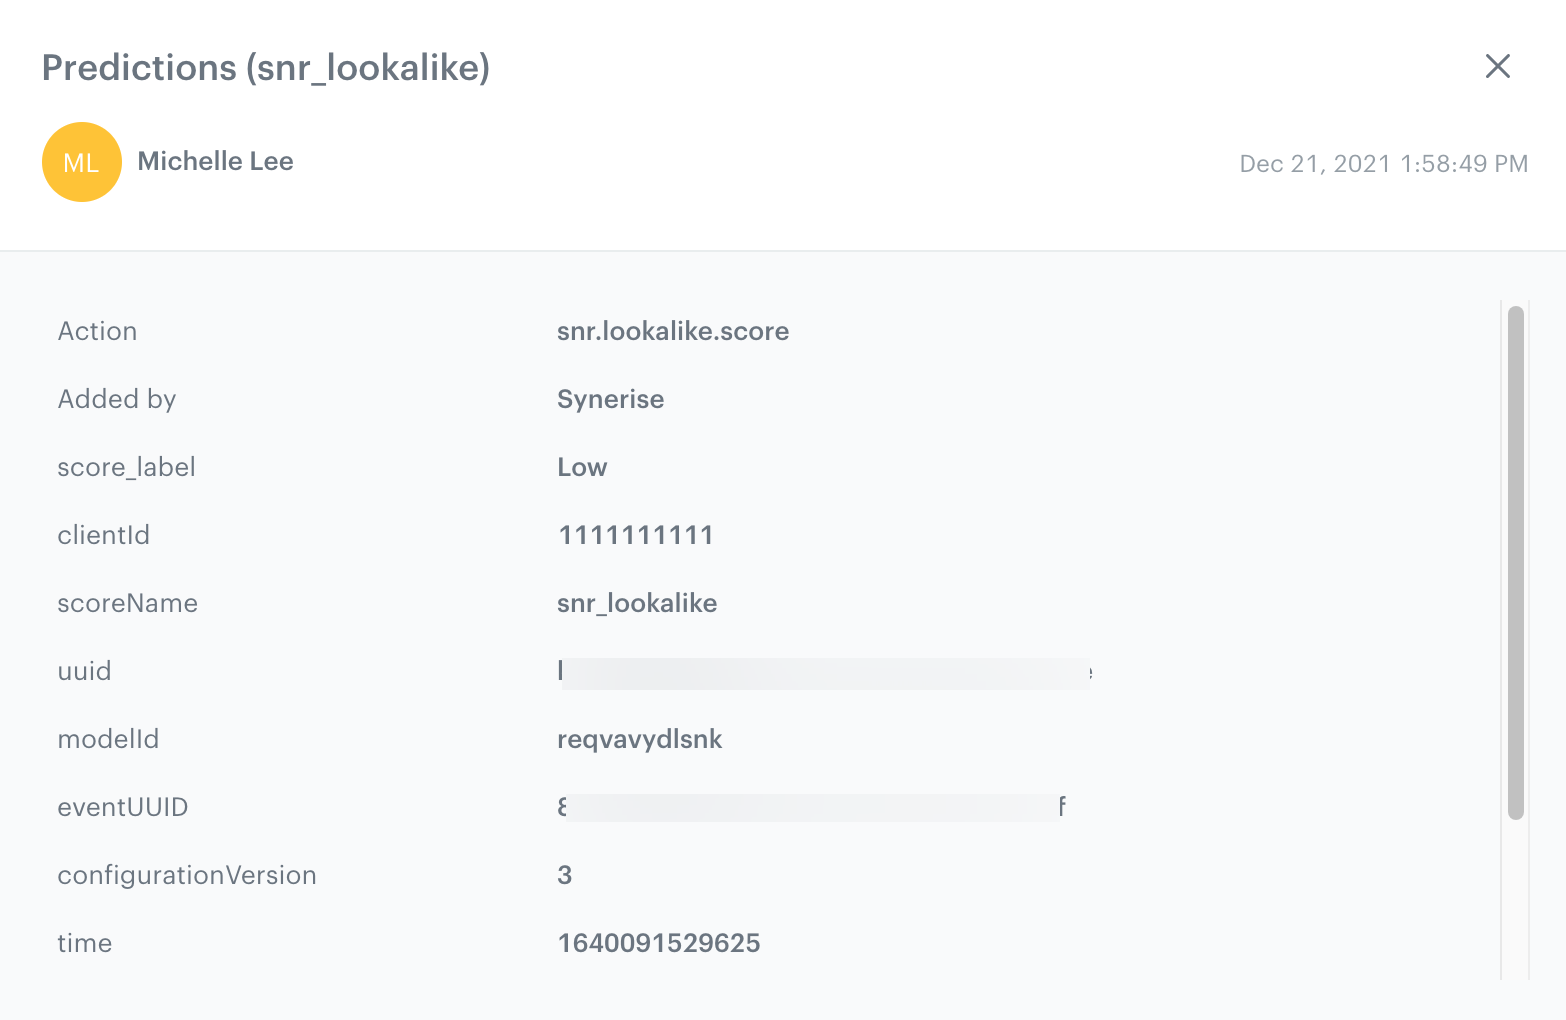
The outcomes of all custom predictions are saved as `snr.lookalike.score` events in the Synerise platform. Thanks to that, the predictions events are available in Decision, Experience or Automation Hubs. The schema of a prediction event is standardized. The attributes are explained in the table below the figure.
snr.lookalike.score event
| Attribute name | Description |
|-------------|-------------------------------------------------------------------------------------------------|
| action | An event type for the prediction - `snr.lookalike.score` |
| added by | An entity that generated this event. In the case of prediction events, it is always Synerise. |
| modelId | A unique identifier of the prediction |
| modelName | The name of the prediction |
| score_label | Prediction output: two- or five-point scale label. You can select the scale in the [settings of the prediction](#additional-configuration). |
| score | The result of the prediction (based on the expression which was selected as a target while preparing a prediction). |
| percentile | [Prediction percentile](/docs/glossary#percentiles) |
| clientId | Customer's identifier |
| time | Time when a prediction was generated, as a Unix timestamp |
| configurationVersion | Allows to verify whether two consecutive calculations ran with the settings (*only for debug*) |
| modelVersion | Model version allows to verify whether two consecutive calculations ran on the same model parameters (*only for debug*) |