
The Synerise platform offers you a full statistics panel in the recommendation details.

In the **AI Hub > (AI Recommendations) Models** view, you can view the statistics in two ways:
- On the [list of recommendations](#list-of-recommendations), you can view basic statistics for each campaign.
- After opening a recommendation's details, you can see more statistics on the [**Statistics** tab](#statistics-tab)

Before you read the description of the metrics in the statistics, there is a term that you may not be familiar with:

- **a unique recommendation frame** - it is a very first view of a recommendation frame (for example, if a customer sees a recommendation frame whose ID is `1234`, and this recommendation is displayed for the second, third and more times, these views are not considered unique)


  <div class="admonition admonition-note"><div class="admonition-icon"><svg xmlns="http://www.w3.org/2000/svg" fill="none" viewBox="0 0 24 24" stroke="currentColor" stroke-width="2.5"><path stroke-linecap="round" stroke-linejoin="round" d="M13 16h-1v-4h-1m1-4h.01M21 12a9 9 0 11-18 0 9 9 0 0118 0z" /></svg></div><div class="admonition-body"><div class="admonition-content">

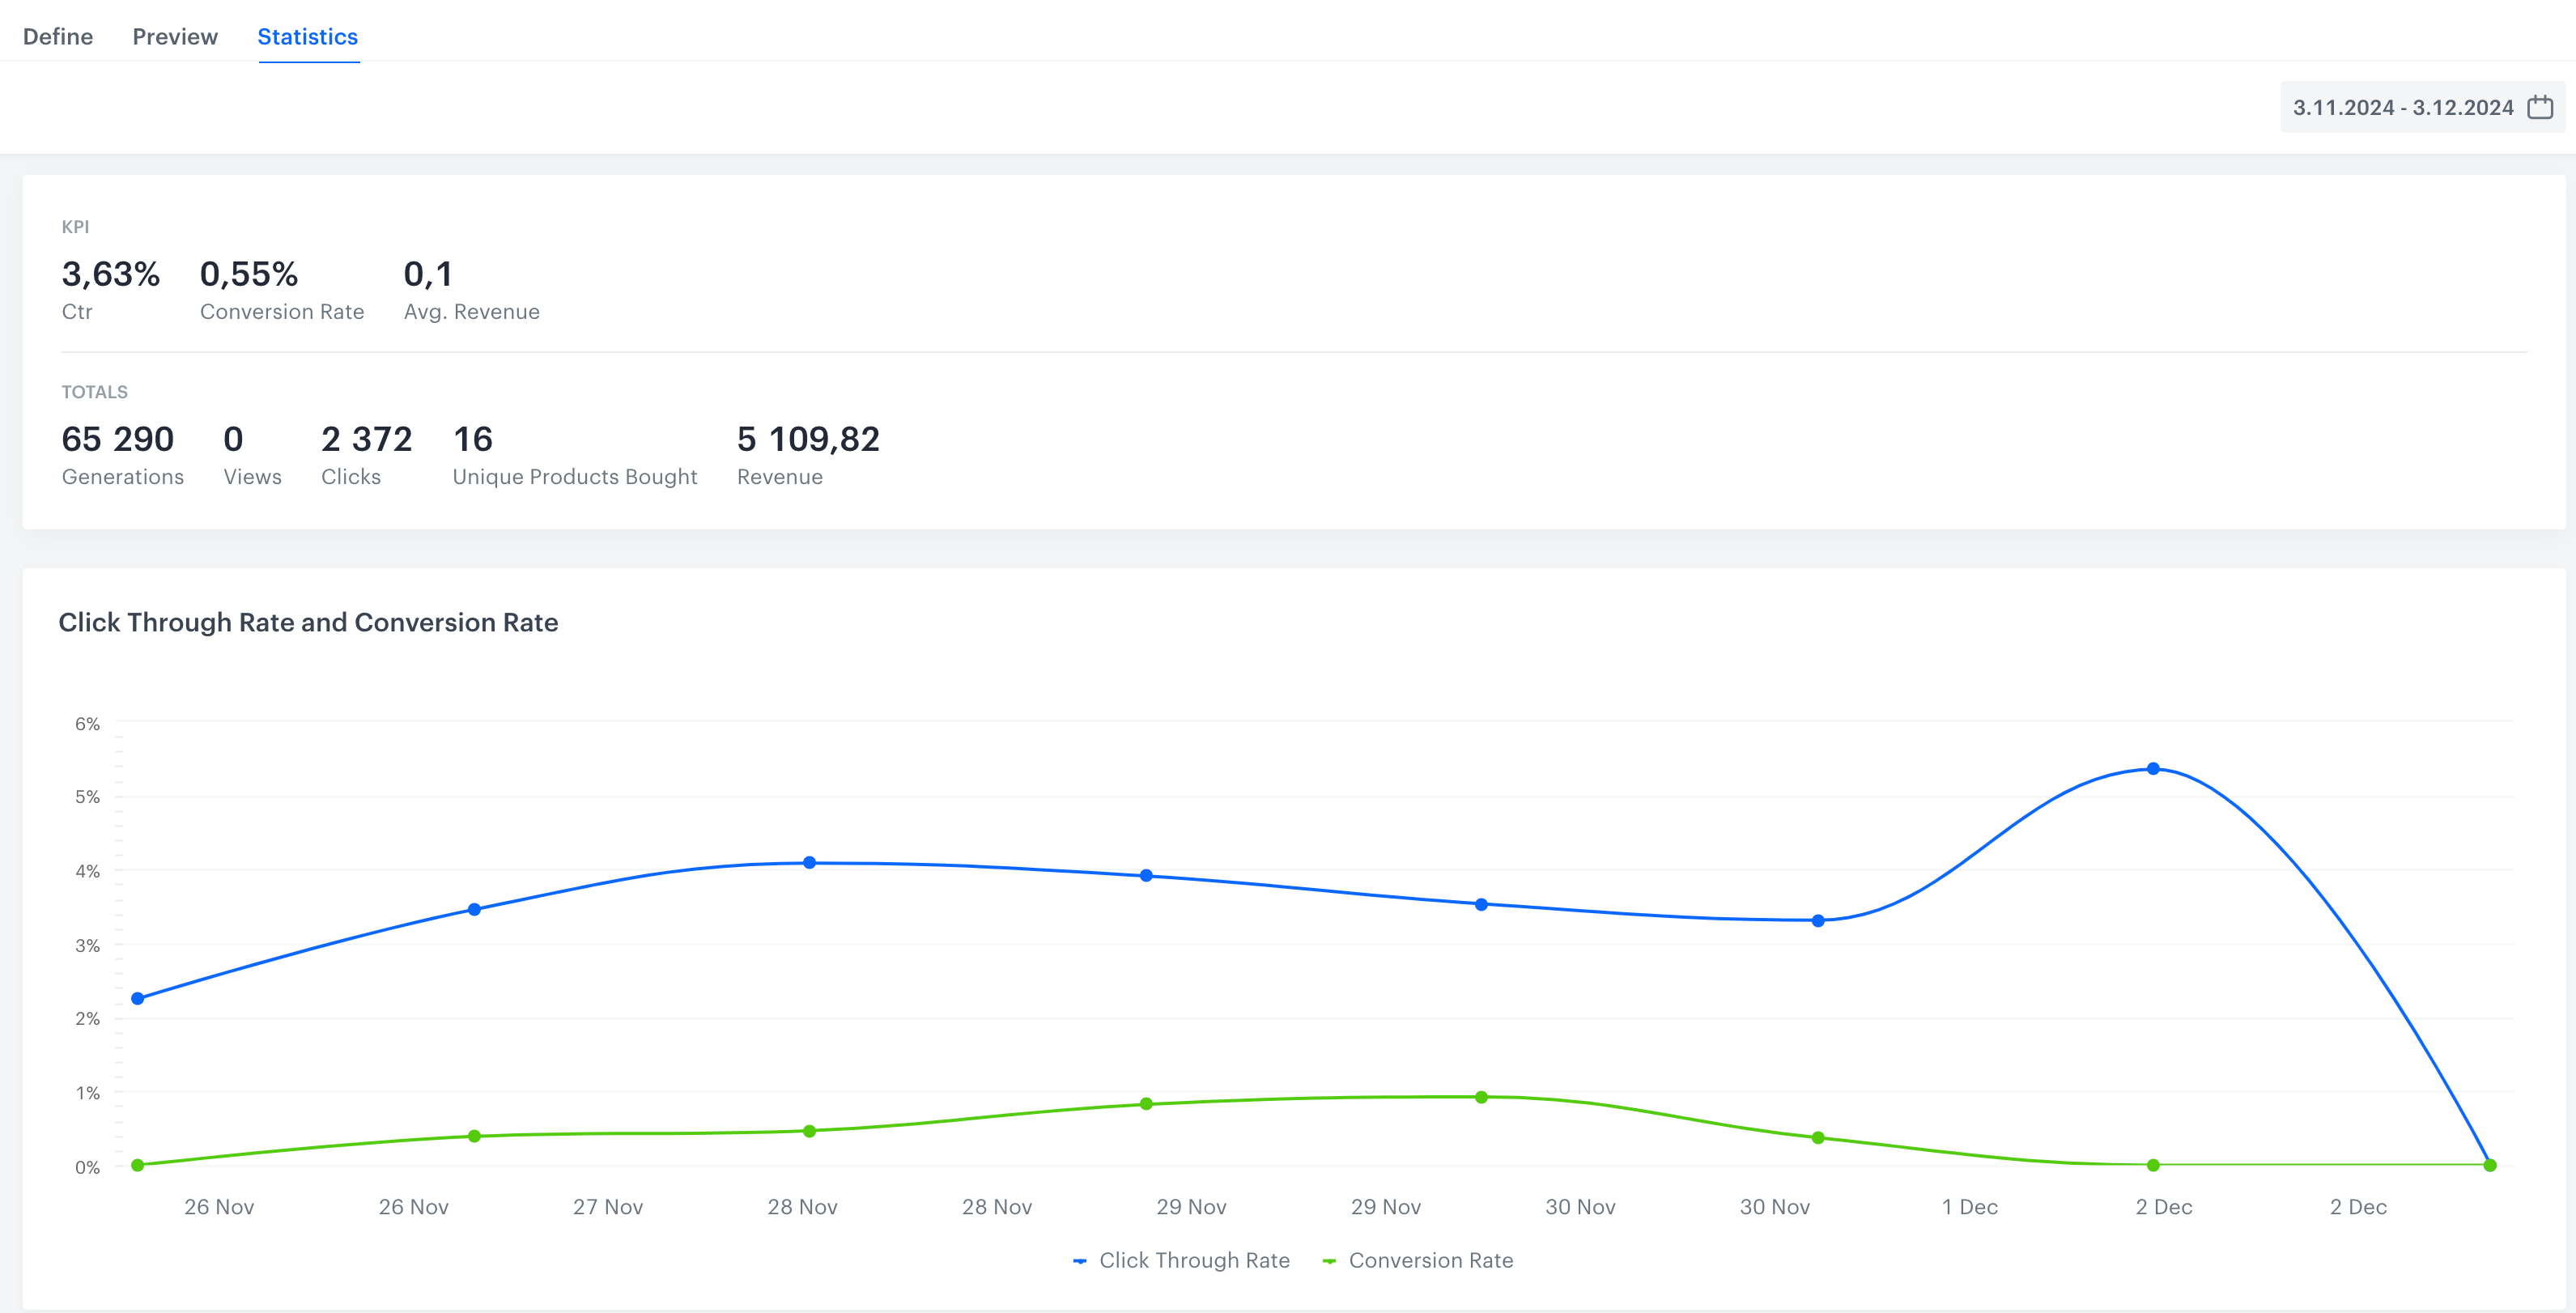
  The statistics are calculated from these events:
  - [recommendation.click](https://developers.synerise.com/DataManagement/DataManagement.html#operation/publishAiCompatRecommendationClickUsingPOST)
  - [recommendation.view](https://developers.synerise.com/DataManagement/DataManagement.html#operation/publishAiCompatRecommendationViewUsingPOST)
  - `recommendation.generated` - this event is generated automatically after a request is sent to any endpoint that starts with [`recommendations/v2/recommend`](https://developers.synerise.com/AIRecommendations/AIRecommendations.html#tag/Recommendations)
  - [transaction.charge](https://developers.synerise.com/DataManagement/DataManagement.html#operation/CreateATransaction)

  </div></div></div>


## List of recommendations
---

<figure><img src="/api/docs/image/54176ad07f146575310749eba44b7c2f42c1b327/docs/campaign/_gfx/reco-stats-list.png" class="full" alt="Metrics on the list of recommendations"><figcaption>Metrics on the list of recommendations</figcaption></figure>

|Metric name|Description|Required events|
|--- |--- |--- |
| CTR |(Click Through Rate) It is the number of clicks on <br> a recommendation frame divided by the number of <br> generated in the last 30 days.| - `recommendation.click`,<br> - `recommendation.generated`|
|Revenue|Revenue generated by the recommendations in the last 30 days. <br> It is counted when a customer buys an item within <br> 24 hours after clicking the item in the recommendation frame.|- `recommendation.click`,<br> - `transaction.charge`, <br> - `recommendation.generated`|

## Statistics tab
---

<figure><img src="/api/docs/image/54176ad07f146575310749eba44b7c2f42c1b327/docs/campaign/_gfx/reco-main-stats.png" class="full" alt="A part of recommendation statistics in the Statistics tab"><figcaption>A part of recommendation statistics in the Statistics tab</figcaption></figure>

In this tab, you can find detailed statistics:

### Campaign metrics

|Metric name|Description|Required events|
|--- |--- |--- |
| CTR |(Click Through Rate) It is the number of clicks on <br> a recommendation frame divided by the number of <br> recommendation generations in the last 30 days.| - `recommendation.click`,<br> - `recommendation.generated`|
| Conversion Rate | It is the number of unique products bought <br> divided by the number of all clicks. <br>  Clicks made within 24 hours of a transaction <br>count towards the conversion rate of the day <br> when the transaction was made.  |- `recommendation.click`,<br> - `transaction.charge`|
|Avg. revenue| (Average revenue) It is calculated by dividing revenue <br> by the number of unique customers (those for whom <br> recommendation was generated). <br> You can find the explanation of <br> how revenue is calculated further in this table. |- `recommendation.click`,<br> - `transaction.charge`, <br> - `recommendation.generated`|
|Generations |It is the number of generated recommendation frames. |`recommendation.generated`|
|Views|It is the total number of unique recommendation frames <br> a customer has seen.|- `recommendation.view`,<br> - `recommendation.generated`|
|Clicks|The number of unique clicks on a recommendation frame. |- `recommendation.click`,<br> -`recommendation.generated`|
|Unique Products Bought |The number of purchased unique items. <br> For example, if a customer purchased 2 pieces <br> of the same product, the number of unique items is 1.| `transaction.charge`|
|Revenue|Revenue generated by the recommendations. <br> It is counted when a customer buys an item within <br> 24 hours after clicking the item in the recommendation frame.|- `recommendation.click`,<br> - `transaction.charge`,<br> - `recommendation.generated`|
|Click Through <br> Rate and Conversion Rate (chart)|The chart compares CTR (number of clicks on <br> a recommendation frame divided by the number of <br> recommendation generations) and Conversion Rate <br> (number of unique products bought divided by <br> the number of all clicks) in a given period.|- `recommendation.click`,<br> - `recommendation.generated`, <br> - `transaction.charge`|
|Recommendations <br> viewed vs generated|It is a contrast between two situations: when a recommendation <br> was actually viewed (for example, when a customer <br> scrolled down to the recommendation frame and saw it) <br> and when the customer entered the website, <br> but didn't see the generated recommendation.|- `recommendation.view`,<br> - `recommendation.generated`|
|Clicks in Recommendation|It is the graphic representation of the total amount <br> of clicks on the product (within <br> a recommendation frame) during the selected period. |- `recommendation.click`,<br> - `recommendation.generated` |
|Unique Products Bought |It is the graphic representation of the number of <br> purchased unique items in the selected period. | - `transaction.charge`,<br> - `recommendation.generated`,<br> - `recommendation.click`|
|Number of Products Bought|It is the total number of the purchased items during <br> the selected period.|- `recommendation.click`,<br> - `transaction.charge`,<br> - `recommendation.generated`|

### Item metrics

For each campaign, you can check the best-performing items. They are available in the **Top products** section of the statistics.

<figure><img src="/api/docs/image/54176ad07f146575310749eba44b7c2f42c1b327/docs/campaign/_gfx/recommendations-stats-top-items.png" class="large" alt="Top items for a campaign"><figcaption>Top items for a campaign</figcaption></figure>

By using the **Metrics** dropdown list on the right, you can choose the condition by which the best items will be selected:

| Metric name | Description                                                                                                                                                                                                                                     | Required events                                                                        |
| ----------- | ----------------------------------------------------------------------------------------------------------------------------------------------------------------------------------------------------------------------------------------------- | -------------------------------------------------------------------------------------- |
| Generations | The number of recommendation frames which included this product                                                                                                                                                                                 | `recommendation.generated`                                                             |
| Clicks      | The number of times this product was clicked in a frame                                                                                                                                                                                         | - `recommendation.click`,<br> - `recommendation.generated`                             |
| Charges     | The number of transactions with this item which occurred within 24 hours of clicking the item.                                                                                                                                                  | - `recommendation.click`,<br> -`recommendation.generated`                              |
| Revenue     | The revenue generated by showing this item in a recommendation frame                                                                                                                                                                            | - `recommendation.click`,<br> - `transaction.charge`,<br> - `recommendation.generated` |
| Views       | The number of times this item was shown after a recommendation was generated.<br> This is separate from generating a frame, because the frame might be displayed partially and items are only shown after scrolling or otherwise changing the view. | - `recommendation.view`,<br> - `recommendation.generated`                              |


