# Connecting events within a profile

If two or more events have the same parameter, you can create relations between them by using aggregates. 


## Examples of use
---

- Check if the discount code in a [personalized promotion](/docs/ai-hub/personalized-promotions/creating-ai-promotions) assigned to a user was used in a transaction. 

- Check the value of a transaction with a discount code or with a certain product. 

- Check if the product on a page promoted by a UTM campaign was added to the cart and then bought. 

- Check how many products added to a cart were not bought. 

## Procedure
---
**Use case**: A paid campaign promotes a certain set of products.  
**Goal**: Check if the product on a page promoted by a UTM campaign was visited and then bought.   
**This procedure consists of the following steps**:
1. Create an aggregate that shows the image of the product from the page visited as a result of the campaign.
2. Create a funnel using the aggregate with the product image that shows a list of customers who went through the `saw a product from a UTM campaign and then bought it` path.  
**Additionally, to make this analysis more complex**:
3. Create a metric that measures the value of the purchased products from the campaign.
4. Create an aggregate that measures the value of another `transaction.charge` event.

### Basic scenario
---

1. Go to <img src="/api/docs/image/54176ad07f146575310749eba44b7c2f42c1b327/icons/behavioral-data-hub-icon.svg" alt="Behavioral Data Hub icon" class="icon"> **Behavioral Data Hub > Live Aggregates > Create aggregate**.
2. Enter the name of the aggregate.
3. By clicking the <img src="/api/docs/image/54176ad07f146575310749eba44b7c2f42c1b327/docs/analytics/_gfx/blue-arrow.png" alt="Expander arrow icon" class="icon"> button, set **First** as the type of the aggregate result (this configures the aggregate to show the first value of the event parameter in the time range selected in the analysis).
4. From the **Choose event** dropdown list, select the **page.visit** event.
5. From the **Choose parameter** dropdown list, select **og:image**.
6. Click the **+ where** button. 
7. From the **Choose parameter** dropdown list, select the **utm_campaign**.
8. Select the **Equal** logical operator. 
9. Next to the logical operator, in the text field, enter the name of the UTM campaign. 
10. By default, the date range for the analysis is set to the last 30 days. To change the date range, click the calendar icon. Confirm the changes with the **Apply** button. 
11. Save the aggregate by clicking **Save**.  
**Result**: The aggregate uses the image of the product and returns the first product viewed in the UTM campaign. 
    <figure>
    <img src="/api/docs/image/54176ad07f146575310749eba44b7c2f42c1b327/docs/analytics/_gfx/use-case-aggregate-crm.png" alt="Filled settings of the aggregate" class="large" >
    <figcaption>Filled settings of the aggregate</figcaption>
    </figure>

12. Go to <img src="/api/docs/image/54176ad07f146575310749eba44b7c2f42c1b327/icons/decision-hub-icon.svg" alt="Decision Hub icon" class="icon"> **Decision Hub > Segmentations > New segmentation**.
13. Enter the name of the segmentation. 
14. Click **Add condition** and from the dropdown list select the **page.visit** event.
15. Click **+ where** button.
16. From the **Choose parameter** dropdown list, select the **utm_campaign** parameter.
17. Select the **Equal** logical operator.
18. Next to the logical operator, in the text field, enter the UTM campaign name.
19. Click **and then...**. 
20. From the dropdown list, select the **Bought product** event.
21. Click the **+ where** button.
22. From the **Choose parameter** dropdown list, select **$image**.
23. Select the **Equal** logical operator.
24. As the value select **Parameter** by clicking the icon next to the input.
25. From the **Parameter** dropdown list, select the **Aggregates** catalog.
26. Select the aggregate created in previous steps.
27. By default, the date range for the analysis is set at the last 30 days. To change the date range, click the calendar icon. Confirm the changes with the **Apply** button.
    <figure>
    <img src="/api/docs/image/54176ad07f146575310749eba44b7c2f42c1b327/docs/analytics/_gfx/use-case-funnel-crm.png" alt="Filled settings of the funnel" class="large" >
    <figcaption>Filled settings of the funnel</figcaption>
    </figure>
27. Save the segmentation.  
**Result**: The results of the segmentation list customers who went through the **saw a product from a UTM campaign and then bought it** path. 

### Advanced scenario

#### Option 1
---

To measure the value of the purchased products from the campaign, you can create a metric that reuses the aggregates created in the Basic scenario. Before that, you must create an expression that calculates the price of purchased items. 


1. Go to  <img src="/api/docs/image/54176ad07f146575310749eba44b7c2f42c1b327/icons/behavioral-data-hub-icon.svg" alt="Behavioral Data Hub icon" class="icon"> **Behavioral Data Hub > Expressions > New expression**.
2. Enter the name of the expression.
3. Select the **Event** type of expression by clicking the <img src="/api/docs/image/54176ad07f146575310749eba44b7c2f42c1b327/docs/analytics/_gfx/blue-arrow.png" alt="Blue arrow icon" class="icon"> icon.
4. From the **Choose event** dropdown list, select the **Bought product** event.
5. Start creating the formula of the expression by clicking the **Select** button.  
**Result**: A dropdown list appears.
6. From the dropdown list, select **Event attribute**.  
**Result**: The **Unnamed** event attribute appears.
7. Click the attribute.
8. From the **Choose parameter** dropdown list, select **$quantity**.
9. Click the plus button.  
**Result**: Another **event attribute** appears.
10. Click the attribute.
11. From the **Choose parameter** dropdown list, select **$finalUnitPrice**.
12. Multiply those two attributes, by selecting the multiplication sign between two event attributes.  
**Result**:
    <figure>
    <img src="/api/docs/image/54176ad07f146575310749eba44b7c2f42c1b327/docs/analytics/_gfx/expression-final-crm.png" alt="Filled settings of the aggregate" class="medium" >
    <figcaption>Expression that calculates the price of items</figcaption>
    </figure>
13. To save the expression, click **Save**.
14. Go to  <img src="/api/docs/image/54176ad07f146575310749eba44b7c2f42c1b327/icons/decision-hub-icon.svg" alt="Decision Hub icon" class="icon"> **Decision Hub > Metrics > New metric**.
15. Enter the name of the metric. 
16. From the **Type** dropdown list, select **Event**.
17. From the **Aggregator** list, select **Sum**.
18. From the **Occurrence type**, select **All**. 
19. From the **Choose event** dropdown, select **Bought product**
20. From the **Choose parameter** dropdown list, click the <img src="/api/docs/image/54176ad07f146575310749eba44b7c2f42c1b327/icons/threedoticon.png" alt="Three-dot icon" class="icon"> icon, and then select **Expression**.
21. Select the expression created in the previous steps.
22. From the **Choose parameter** dropdown list, select **$sku**.
23. As the logic operator, select **In**.
24. Click the icon next to the logic operator and keep clicking until you get <img src="/api/docs/image/54176ad07f146575310749eba44b7c2f42c1b327/icons/choose-value.png" alt="Choose value icon" class="icon">.
25. From the **Choose value** dropdown list, click the <img src="/api/docs/image/54176ad07f146575310749eba44b7c2f42c1b327/icons/threedoticon.png" alt="Three-dot icon" class="icon"> icon, and then select **Aggregates**. 
26. Select the aggregate created in the previous steps.  
**Result**:
    <figure>
    <img src="/api/docs/image/54176ad07f146575310749eba44b7c2f42c1b327/docs/analytics/_gfx/use-case-metric-more-products.png" alt="Filled settings of the metric" class="large" >
    <figcaption>Filled settings of the metric</figcaption>
    </figure>

**Result**: The metric returns the total sum of purchased products from a specific UTM campaign within the defined time range. So far, the analyses in the **Basic** and **Advanced** procedures used two events and they have one parameter in common that connected them (**$image**).  

#### Option 2
---

You can also measure the value of the transaction.charge event. You can do it by preparing a metric that contains three aggregates. The first one returns the first visited product from a particular UTM campaign. The second one returns a date when this product was visited. The third one returns a list of purchased items a specified UTM campaign by using the two previous aggregates.  


<div class="admonition admonition-note"><div class="admonition-icon"><svg xmlns="http://www.w3.org/2000/svg" fill="none" viewBox="0 0 24 24" stroke="currentColor" stroke-width="2.5"><path stroke-linecap="round" stroke-linejoin="round" d="M13 16h-1v-4h-1m1-4h.01M21 12a9 9 0 11-18 0 9 9 0 0118 0z" /></svg></div><div class="admonition-body"><div class="admonition-content">

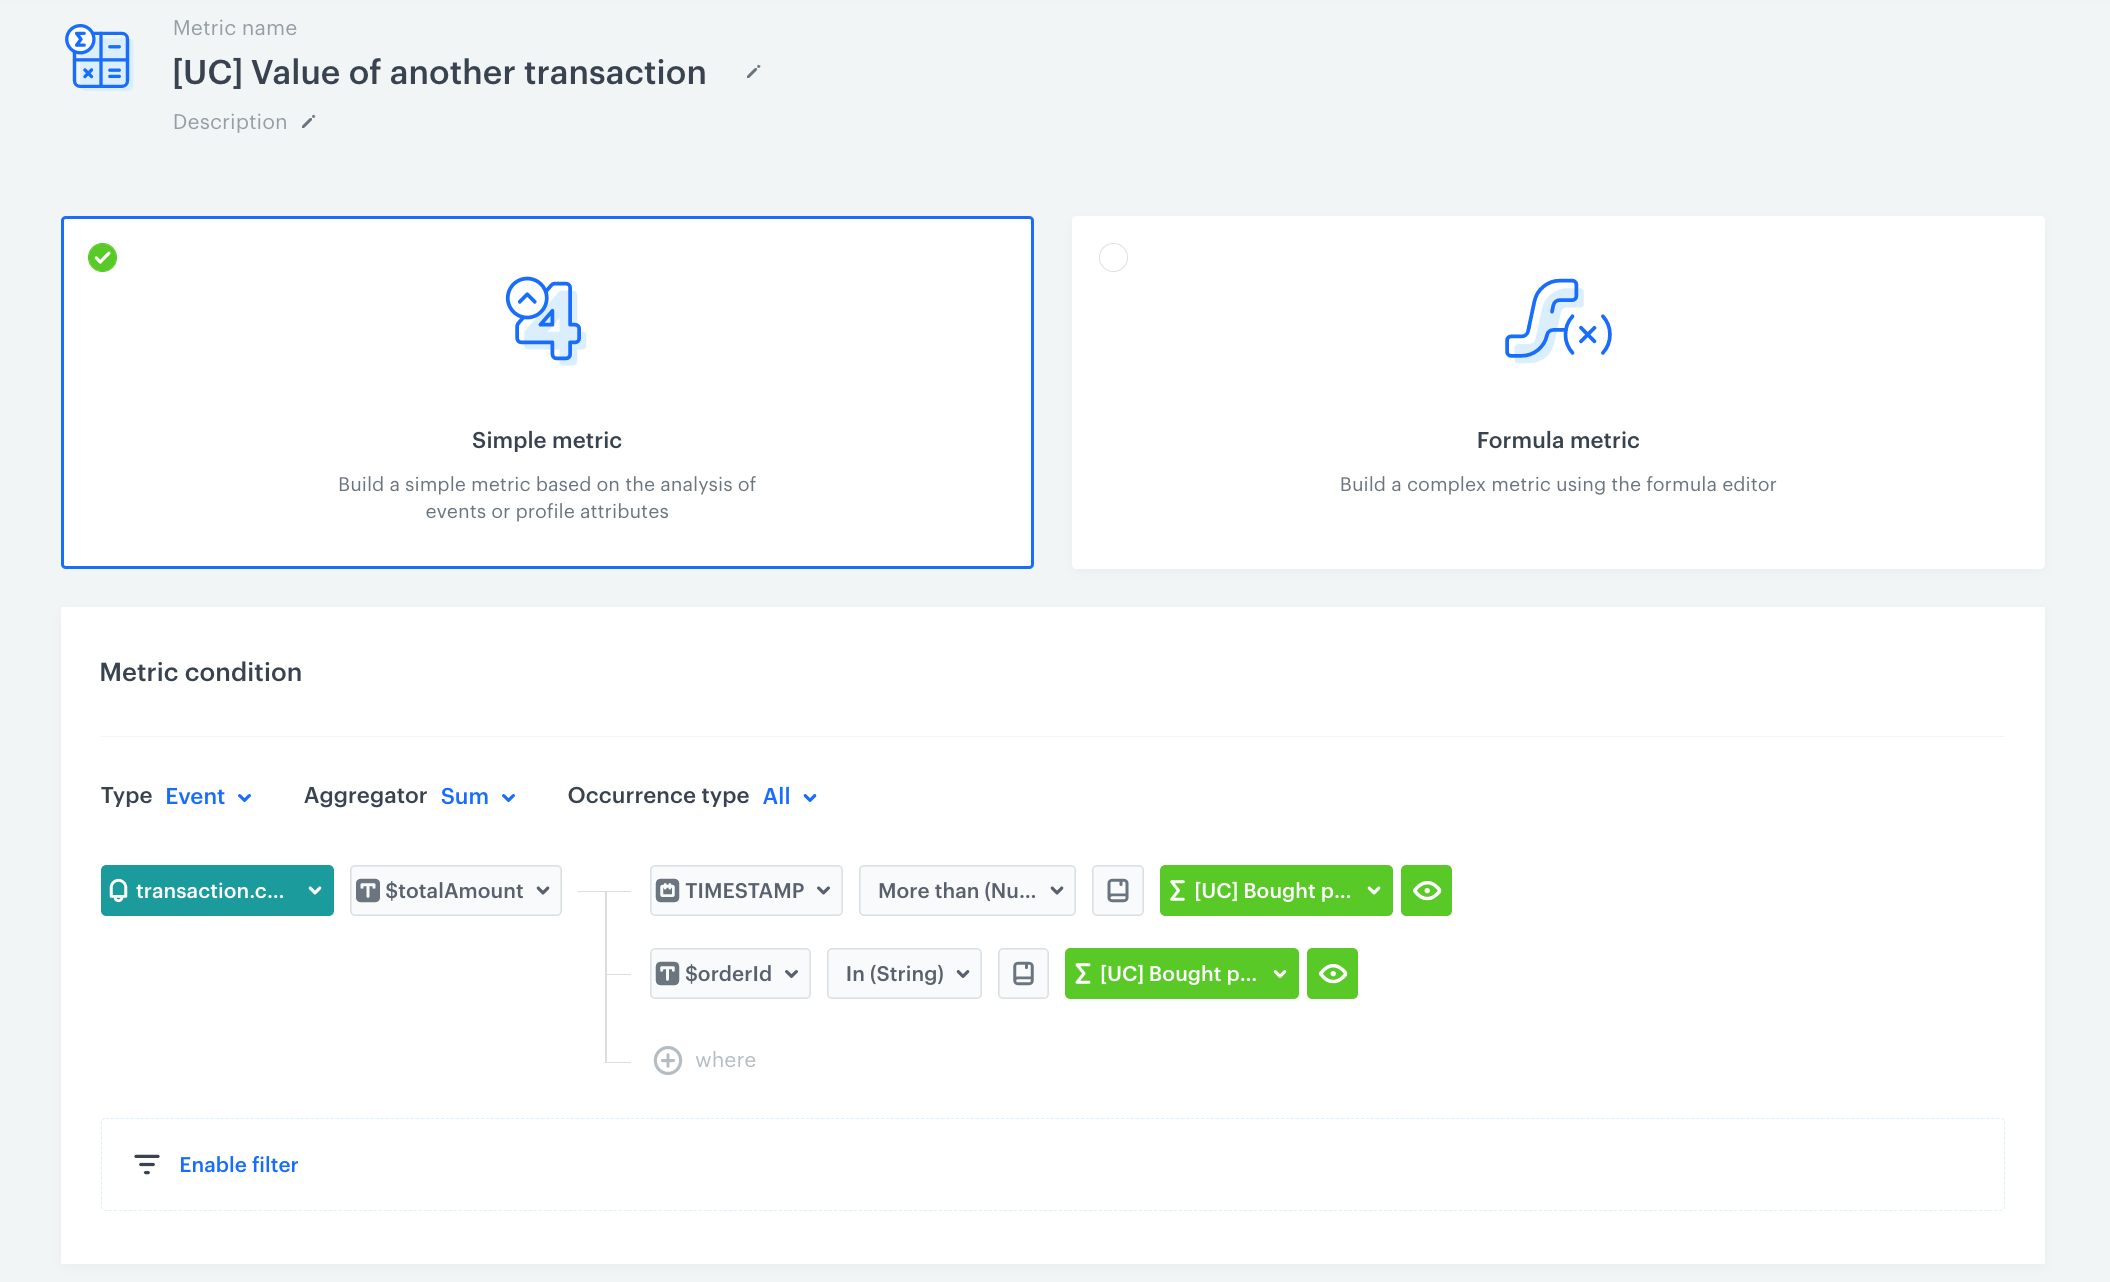
The product.buy is a purchase of a single item, whereas the transaction.charge is the summary of the all purchased items. When a customer makes a purchase, the Synerise application receives the transaction.charge event, and the app divides it into the product.buy events. Their number is dependent on the number of purchased items.

</div></div></div>


##### First aggregate
---

1. Go to <img src="/api/docs/image/54176ad07f146575310749eba44b7c2f42c1b327/icons/behavioral-data-hub-icon.svg" alt="Behavioral Data Hub icon" class="icon"> **Behavioral Data Hub > Live Aggregates > Create aggregate**.
2. Enter the name of the aggregate.
3. By clicking the <img src="/api/docs/image/54176ad07f146575310749eba44b7c2f42c1b327/docs/analytics/_gfx/blue-arrow.png" alt="Expander arrow icon" class="icon"> button, set **First** as the type of the aggregate result (then the aggregate result shows the first value of the event parameter in the time range selected in the analysis).
4. From the **Choose event** dropdown list, select the **page.visit** event.
5. From the **Choose parameter** dropdown list, select the **og:image**.
6. Click the **+ where** button. 
7. From the **Choose parameter** dropdown list, select **utm_campaign**.
8. Select the **Equal** logical operator. 
9. Click the icon next to the logic operator and keep clicking until you get <img src="/api/docs/image/54176ad07f146575310749eba44b7c2f42c1b327/icons/dynamic-key-analytics.png" alt="Dynamic key icon" class="icon">.
10. In the left text field, enter the name of the dynamic key (in this case, it's `utm_campaign`).
11. In the right text field, enter the value of the dynamic key (name of the UTM campaign).  
    
    <div class="admonition admonition-tip"><div class="admonition-icon"><svg xmlns="http://www.w3.org/2000/svg" fill="none" viewBox="0 0 24 24" stroke="currentColor" stroke-width="2.5"><path stroke-linecap="round" stroke-linejoin="round" d="M9.663 17h4.673M12 3v1m6.364 1.636l-.707.707M21 12h-1M4 12H3m3.343-5.657l-.707-.707m2.828 9.9a5 5 0 117.072 0l-.548.547A3.374 3.374 0 0014 18.469V19a2 2 0 11-4 0v-.531c0-.895-.356-1.754-.988-2.386l-.548-.547z" /></svg></div><div class="admonition-body"><div class="admonition-content">

    You can find the name of the UTM campaign in the following places:
   - In the summary of the message (**Experience Hub** > **Email**. Click the message to get to the details, find the **UTM&URL parameters** section)
   - In the template code (for the automated emails)
   - In the details of an event (for example, newsletter.click) in the activity list on a profile
   - In the link used in the email (click the link in the email, the URL contains the name of the UTM campaign)

    </div></div></div>

12. By default, the date range for the analysis is set at the last 30 days. To change the date range, click the calendar icon. Confirm the changes with the **Apply** button. 
13. Save the aggregate by clicking **Save**.  
**Result**: The aggregate returns the first visited product from a specific UTM campaign.
    <figure>
    <img src="/api/docs/image/54176ad07f146575310749eba44b7c2f42c1b327/docs/analytics/_gfx/use-case-aggregate-product-crm.png" alt="Filled settings of the aggregate" class="large" >
    <figcaption>Filled settings of the aggregate</figcaption>
    </figure>

##### Second aggregate
---
1. Go to <img src="/api/docs/image/54176ad07f146575310749eba44b7c2f42c1b327/icons/behavioral-data-hub-icon.svg" alt="Behavioral Data Hub icon" class="icon"> **Behavioral Data Hub > Live Aggregates > Create aggregate**.
2. Enter the name of the aggregate.
3. By clicking the <img src="/api/docs/image/54176ad07f146575310749eba44b7c2f42c1b327/docs/analytics/_gfx/blue-arrow.png" alt="Expander arrow icon" class="icon"> button, set **First** as the type of the aggregate result (this configures the aggregate to show the first value of the event parameter in the time range selected in the analysis).
4. From the **Choose event** dropdown list, select the **page.visit** event.
5. From the **Choose parameter** dropdown list, click the <img src="/api/docs/image/54176ad07f146575310749eba44b7c2f42c1b327/icons/threedoticon.png" alt="Three-dot icon" class="icon"> icon, and then select **Specials**.
6. From the list, select **TIMESTAMP**.
6. Click the **+ where** button. 
7. From the **Choose parameter** dropdown list, select **utm_campaign**.
8. Select the **Equal** logical operator. 
9. Click the icon next to the logic operator and keep clicking until you get <img src="/api/docs/image/54176ad07f146575310749eba44b7c2f42c1b327/icons/dynamic-key-analytics.png" alt="Dynamic key icon" class="icon">.
10. In the left text field, enter the name of the dynamic key (in this case, it's `utm_campaign`).
11. In the right text field, enter the value of the dynamic key.
    
    <div class="admonition admonition-tip"><div class="admonition-icon"><svg xmlns="http://www.w3.org/2000/svg" fill="none" viewBox="0 0 24 24" stroke="currentColor" stroke-width="2.5"><path stroke-linecap="round" stroke-linejoin="round" d="M9.663 17h4.673M12 3v1m6.364 1.636l-.707.707M21 12h-1M4 12H3m3.343-5.657l-.707-.707m2.828 9.9a5 5 0 117.072 0l-.548.547A3.374 3.374 0 0014 18.469V19a2 2 0 11-4 0v-.531c0-.895-.356-1.754-.988-2.386l-.548-.547z" /></svg></div><div class="admonition-body"><div class="admonition-content">

    You can find the name of the UTM campaign in the following places:
   - In the summary of the message (**Experience Hub** > **Email**. Click the message to get to the details, find the **UTM&URL parameters** section)
   - In the template code (for the automated emails)
   - In the details of an event (for example, newsletter.click) in the activity list on a profile
   - In the link used in the email (click the link in the email, the URL contains the name of the UTM campaign)

    </div></div></div>

12. By default, the date range for the analysis is set at the last 30 days. To change the date range, click the calendar icon. Confirm the changes with the **Apply** button. 
13. Save the aggregate by clicking **Save**.  
**Result**: The aggregate returns the date of the first visit to the product from the selected UTM campaign. 
    <figure>
    <img src="/api/docs/image/54176ad07f146575310749eba44b7c2f42c1b327/docs/analytics/_gfx/use-cases-aggregate-timestamp-crm.png" alt="Filled settings of the aggregate" class="large" >
    <figcaption>Filled settings of the aggregate</figcaption>
    </figure>

##### Third aggregate
---
1. Go to <img src="/api/docs/image/54176ad07f146575310749eba44b7c2f42c1b327/icons/behavioral-data-hub-icon.svg" alt="Behavioral Data Hub icon" class="icon"> **Behavioral Data Hub > Live Aggregates > Create aggregate**.
2. Enter the name of the aggregate.
3. By clicking the <img src="/api/docs/image/54176ad07f146575310749eba44b7c2f42c1b327/docs/analytics/_gfx/blue-arrow.png" alt="Expander arrow icon" class="icon"> button, set **Last Multi** as the type of the aggregate result (this configures the aggregate to show the defined number of results of the event parameter in the time range selected in the analysis).
4. In the **Size** field, select the number of results of the aggregate. 
4. From the **Choose event** dropdown list, select the **product.buy** event.
5. From the **Choose parameter** dropdown list, select **$orderId**.
6. Click the **+ where** button. 
7. From the **Choose parameter** dropdown list, select **$image**.
8. Select the **Equal** logical operator. 
9. Click the icon next to the logic operator and keep clicking until you get <img src="/api/docs/image/54176ad07f146575310749eba44b7c2f42c1b327/icons/choose-value.png" alt="Choose value icon" class="icon">.
19. From the **Choose value** dropdown list, click the <img src="/api/docs/image/54176ad07f146575310749eba44b7c2f42c1b327/icons/threedoticon.png" alt="Three-dot icon" class="icon"> icon, and then select **Aggregates**. 
20. Select the first aggregate created in the previous steps. 
6. Click the **+ where** button. 
7. From the **Choose parameter** dropdown list, select **$image**.
8. Select the **Equal** logical operator. 
9. Click the icon next to the logic operator and keep clicking until you get <img src="/api/docs/image/54176ad07f146575310749eba44b7c2f42c1b327/icons/choose-value.png" alt="Choose value icon" class="icon">.
19. From the **Choose value** dropdown list, click the <img src="/api/docs/image/54176ad07f146575310749eba44b7c2f42c1b327/icons/threedoticon.png" alt="Three-dot icon" class="icon"> icon, and then select **Aggregates**.
21. Select the second aggregate created in previous steps.
22. Save the aggregate by clicking **Save**.    
**Result**: The aggregate returns a list of products (the number of products depend on the value entered in the **Size** field, in the step 4) from the selected UTM campaign.
    <figure>
    <img src="/api/docs/image/54176ad07f146575310749eba44b7c2f42c1b327/docs/analytics/_gfx/use-case-final-aggregate-crm.png" alt="Filled settings of the aggregate" class="large" >
    <figcaption>Filled settings of the aggregate</figcaption>
    </figure>
 

##### Metric
---
1. Go to <img src="/api/docs/image/54176ad07f146575310749eba44b7c2f42c1b327/icons/decision-hub-icon.svg" alt="Decision Hub icon" class="icon"> **Decision Hub > Metrics > New metric**.
2. Enter the name of the metric.
3. Select a simple metric (set by default).
4. As the **Type**, select **Event** (set by default).
5. As the **Aggregator**, select **Sum**.
6. As the **Occurrence**, select **All**. 
7. From the **Choose event** dropdown list, select **transaction.charge**.
8. Click the **+ where** button. 
9. From the **Choose parameter** dropdown list, select **$totalAmount**. 
10. Click the **+ where** button. 
11. From the **Choose parameter** dropdown list, click the <img src="/api/docs/image/54176ad07f146575310749eba44b7c2f42c1b327/icons/threedoticon.png" alt="Three-dot icon" class="icon"> icon, and then select **Specials**.
12. From the list, select **TIMESTAMP**.
13. As the logical operator, select **More than**. 
14. Click the icon next to the logic operator and keep clicking until you get <img src="/api/docs/image/54176ad07f146575310749eba44b7c2f42c1b327/icons/choose-value.png" alt="Choose value icon" class="icon">.
15. From the **Choose value** dropdown list, click the <img src="/api/docs/image/54176ad07f146575310749eba44b7c2f42c1b327/icons/threedoticon.png" alt="Three-dot icon" class="icon"> icon, and then select **Aggregates**.
16. Select the third aggregate.
17. Click the **+ where** button. 
18. From the **Choose parameter** dropdown list, select **$orderId**.
19. As the logical operator, select **In**.
20. Click the icon next to the logic operator and keep clicking until you get <img src="/api/docs/image/54176ad07f146575310749eba44b7c2f42c1b327/icons/choose-value.png" alt="Choose value icon" class="icon">.
21. From the **Choose value** dropdown list, click the <img src="/api/docs/image/54176ad07f146575310749eba44b7c2f42c1b327/icons/threedoticon.png" alt="Three-dot icon" class="icon"> icon, and then select **Aggregates**.
22. Select the third aggregate.  
23. Save the metric.  
**Result**: 
    <figure>
    <img src="/api/docs/image/54176ad07f146575310749eba44b7c2f42c1b327/docs/analytics/_gfx/use-case-metric-final.png" alt="Filled settings of the metric" class="large" >
    <figcaption>Filled settings of the metric</figcaption>
    </figure>

