When you create a segmentation, you can check the results it produces.
1. Go to  **Decision Hub > Segmentations**.
2. Click the
**Decision Hub > Segmentations**.
2. Click the  icon on the segmentation you want to preview.
3. From the dropdown list, choose the **Open** option.
icon on the segmentation you want to preview.
3. From the dropdown list, choose the **Open** option.
 - To go back to editing the segment, scroll up the screen and click **Show conditions**
- To include a customer in more than one segment, if the customer met conditions, in the preview of the segmentation, switch the [**Multi-match**](/docs/analytics/segmentations/creating-segmentations#multi-match) toggle on.
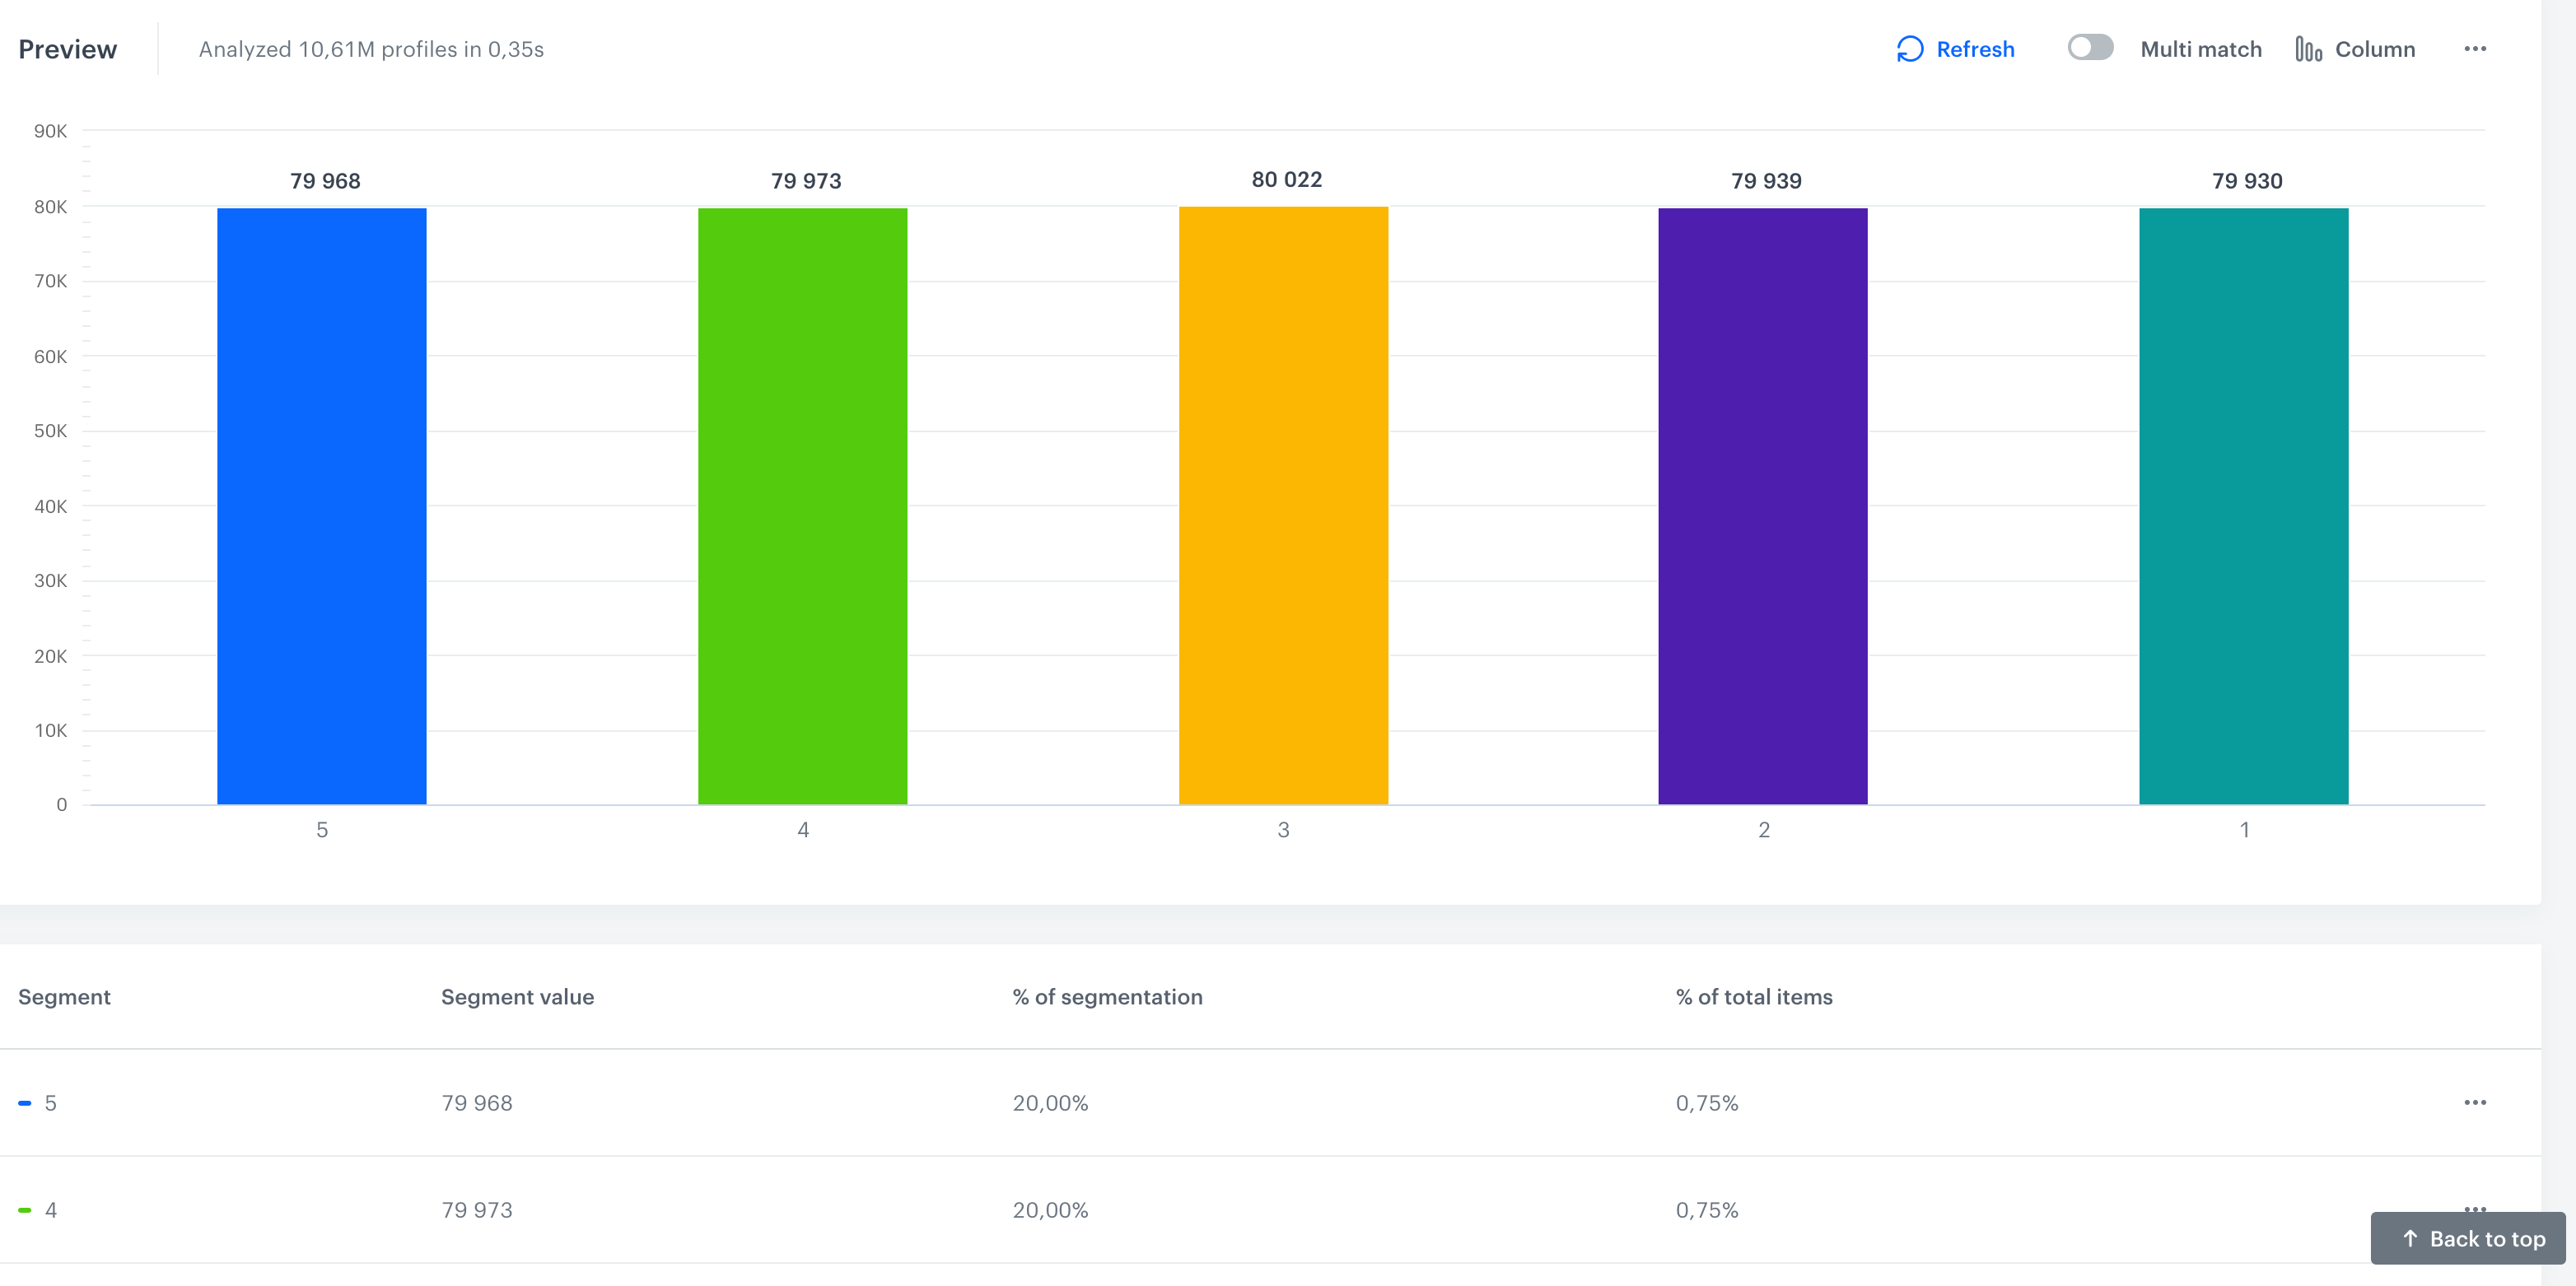
- To see the percentage distribution, scroll down the page.
- To preview the list of customers that meet the requirements of the segmentation, click the column/slice of a pie chart that represents a segment and select **Show records**.
- To print out the preview of the segmentation, in the **Preview** section, click and select **Print chart**.
- To download the preview of the segmentation as a `.jpg`, `.png`, `.pdf`, `.csv`, or `xlsx`, click and select the option of downloading a corresponding file format.
- To go back to editing the segment, scroll up the screen and click **Show conditions**
- To include a customer in more than one segment, if the customer met conditions, in the preview of the segmentation, switch the [**Multi-match**](/docs/analytics/segmentations/creating-segmentations#multi-match) toggle on.
- To see the percentage distribution, scroll down the page.
- To preview the list of customers that meet the requirements of the segmentation, click the column/slice of a pie chart that represents a segment and select **Show records**.
- To print out the preview of the segmentation, in the **Preview** section, click and select **Print chart**.
- To download the preview of the segmentation as a `.jpg`, `.png`, `.pdf`, `.csv`, or `xlsx`, click and select the option of downloading a corresponding file format.