
An analysis is called **dynamic** when it contains at least one dynamic key. 

## What is a dynamic key?  

A dynamic key is a context parameter you can create by selecting an event property in the analysis and switching the value type to **Dynamic key**. This exposes two fields: **Dynamic key** (name of the key) and **Value** (default value, used when no other value is specified). When the analysis is added to a dashboard, you can identify the key by its name and set or change the key value directly from the **Dynamic keys** panel, without opening the analysis. An analysis can have multiple dynamic keys, each specifiable separately in the **Dynamic keys** panel. If multiple analyses in the dashboard use keys with the same name, you enter the value once and it applies to all of them. 

<figure>
<img src="/api/docs/image/8e62e386f19e76b18f8d5beceff5df82b2aed3ad/docs/analytics/_gfx/dynamic-key-example-dash.png" alt="The dashboard that contains metrics" class="full" >
<figcaption> The dashboard that contains the metrics that use a dynamic key  </figcaption>
</figure> 


<div class="admonition admonition-note"><div class="admonition-icon"><svg xmlns="http://www.w3.org/2000/svg" fill="none" viewBox="0 0 24 24" stroke="currentColor" stroke-width="2.5"><path stroke-linecap="round" stroke-linejoin="round" d="M13 16h-1v-4h-1m1-4h.01M21 12a9 9 0 11-18 0 9 9 0 0118 0z" /></svg></div><div class="admonition-body"><div class="admonition-content">

You can read more about creating dynamic keys and examples of use in [Value types in analyses and filters](/docs/analytics/i_events-parameter-value).

</div></div></div>


## Static analyses

A static analysis contains no dynamic keys. In the list of analyses, it is labeled **Static** below the analysis title.

<figure><img src="/api/docs/image/8e62e386f19e76b18f8d5beceff5df82b2aed3ad/docs/analytics/_gfx/static-analysis.png" class="medium" alt="A 'Static' label under a metric title available on the list of metrics"><figcaption>A 'Static' label under a metric title available on the list of metrics</figcaption></figure>

**Example**: A metric counting the total number of `newsletter.click` events in the last 30 days returns all occurrences of the event across the workspace. To see results for a specific campaign, you would need to open the metric and add a campaign ID filter manually - in such case, the metric also will be static.


<div class="content-tabs" data-tab-group="tabgrp-5218">
<div class="tab-buttons"><button class="tab-button" data-tab-id="tabgrp-5218-0" data-tab-group="tabgrp-5218" data-tab-active="true">Number of clicks in emails</button><button class="tab-button" data-tab-id="tabgrp-5218-1" data-tab-group="tabgrp-5218">Number of clicks in an email campaign</button></div>

<div class="tab-panel" data-tab-id="tabgrp-5218-0" data-tab-group="tabgrp-5218" data-tab-active="true">

<figure><img src="/api/docs/image/8e62e386f19e76b18f8d5beceff5df82b2aed3ad/docs/analytics/_gfx/metric-static.png" class="large" alt="Metric conditions that calculate the number of all newsletter.click events"><figcaption>Calculating the number of all newsletter.click events</figcaption></figure>

</div>

<div class="tab-panel" data-tab-id="tabgrp-5218-1" data-tab-group="tabgrp-5218">

<figure><img src="/api/docs/image/8e62e386f19e76b18f8d5beceff5df82b2aed3ad/docs/analytics/_gfx/metric-static-with-id.png" class="large" alt="Metric conditions that calculate the number of newsletter.click events from specific email campaign"><figcaption>Calculating the number of newsletter.click events from specific email campaign</figcaption></figure>

</div>
</div>


## Dynamic analyses

A dynamic analysis contains a dynamic key. In the list of analyses, it is labeled **Dynamic** below the analysis title.  
The dynamic key makes it possible to change the analysis context directly from the **Dynamic keys** panel on a dashboard which contains the analysis, without editing the analysis itself.  

<figure><img src="/api/docs/image/8e62e386f19e76b18f8d5beceff5df82b2aed3ad/docs/analytics/_gfx/dynamic-analysis.png" class="medium" alt="A Dynamic label under a metric title available on the list of metrics"><figcaption>A Dynamic label under a metric title available on the list of metrics</figcaption></figure>

**Example**: A metric counting `newsletter.click` events filtered by a campaign ID uses a dynamic key for the ID. To see the results for a specific email campaign, instead of `0`, type the ID of the email campaign. When this metric is added to the dashboard and other analyses on the dashboard contain the same dynamic key, you can replace the dynamic key value on the dashboard and easily preview results for various campaigns.

<figure><img src="/api/docs/image/8e62e386f19e76b18f8d5beceff5df82b2aed3ad/docs/analytics/_gfx/metric-dynamic.png" class="large" alt="Metric conditions that calculate the number of newsletter.click events from specific email campaign"><figcaption>Calculating the number of newsletter.click events from specific email campaign</figcaption></figure>


<div class="admonition admonition-tip"><div class="admonition-icon"><svg xmlns="http://www.w3.org/2000/svg" fill="none" viewBox="0 0 24 24" stroke="currentColor" stroke-width="2.5"><path stroke-linecap="round" stroke-linejoin="round" d="M9.663 17h4.673M12 3v1m6.364 1.636l-.707.707M21 12h-1M4 12H3m3.343-5.657l-.707-.707m2.828 9.9a5 5 0 117.072 0l-.548.547A3.374 3.374 0 0014 18.469V19a2 2 0 11-4 0v-.531c0-.895-.356-1.754-.988-2.386l-.548-.547z" /></svg></div><div class="admonition-body"><div class="admonition-content">

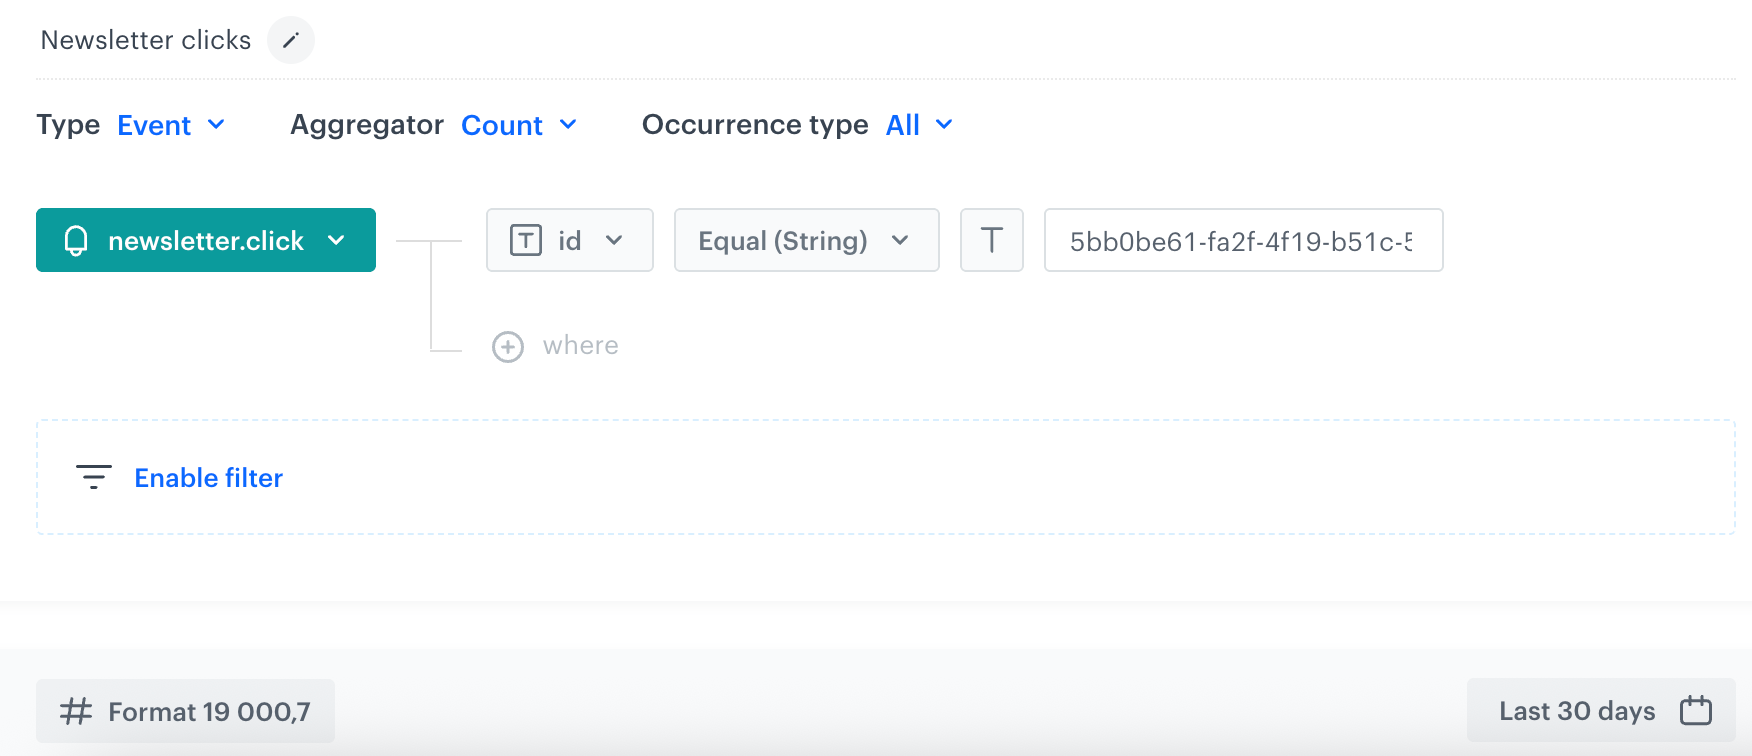
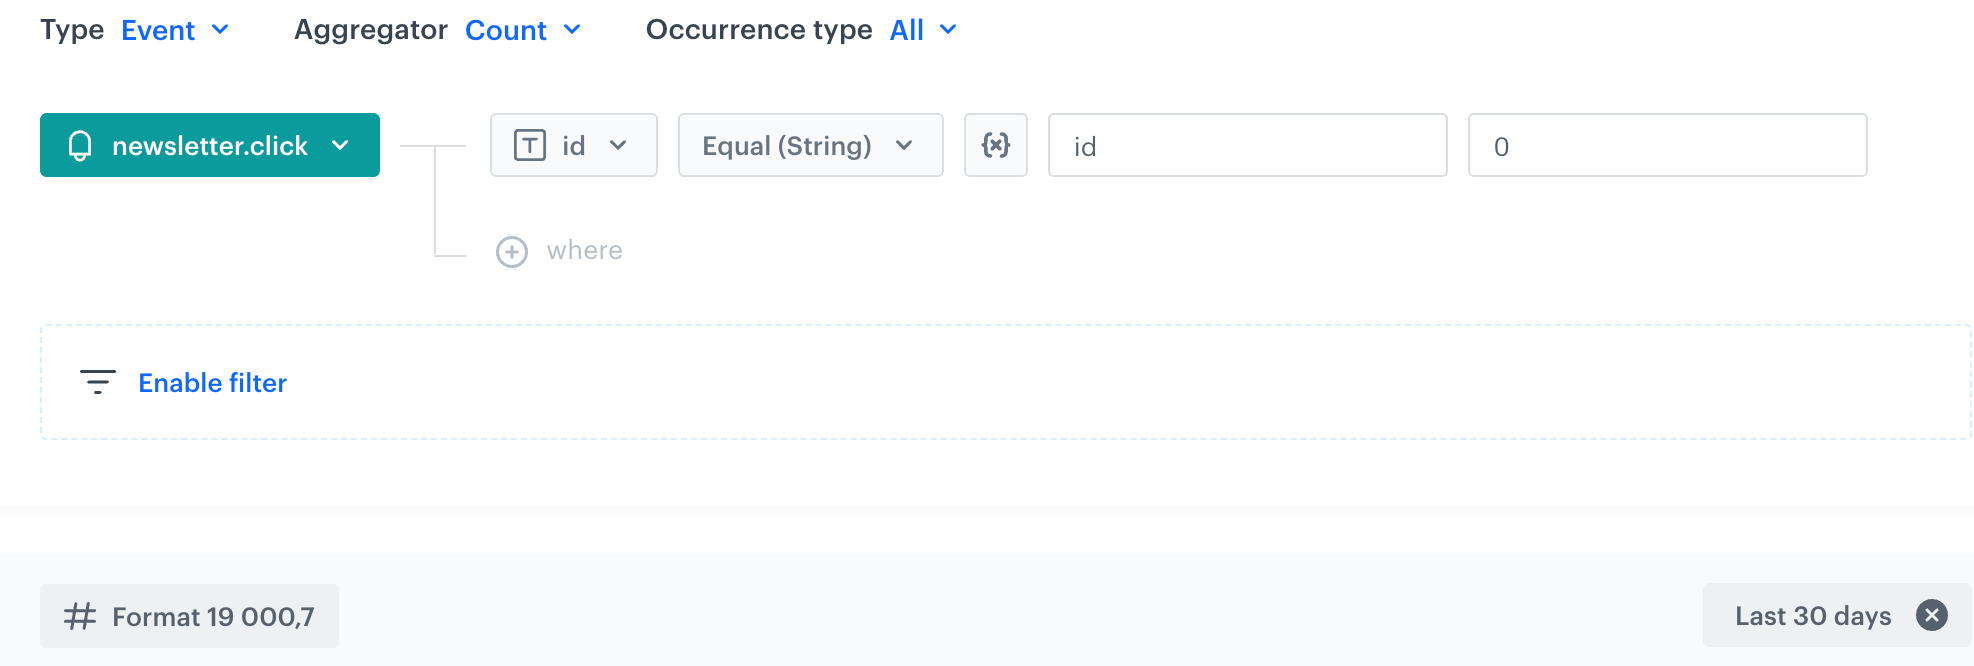
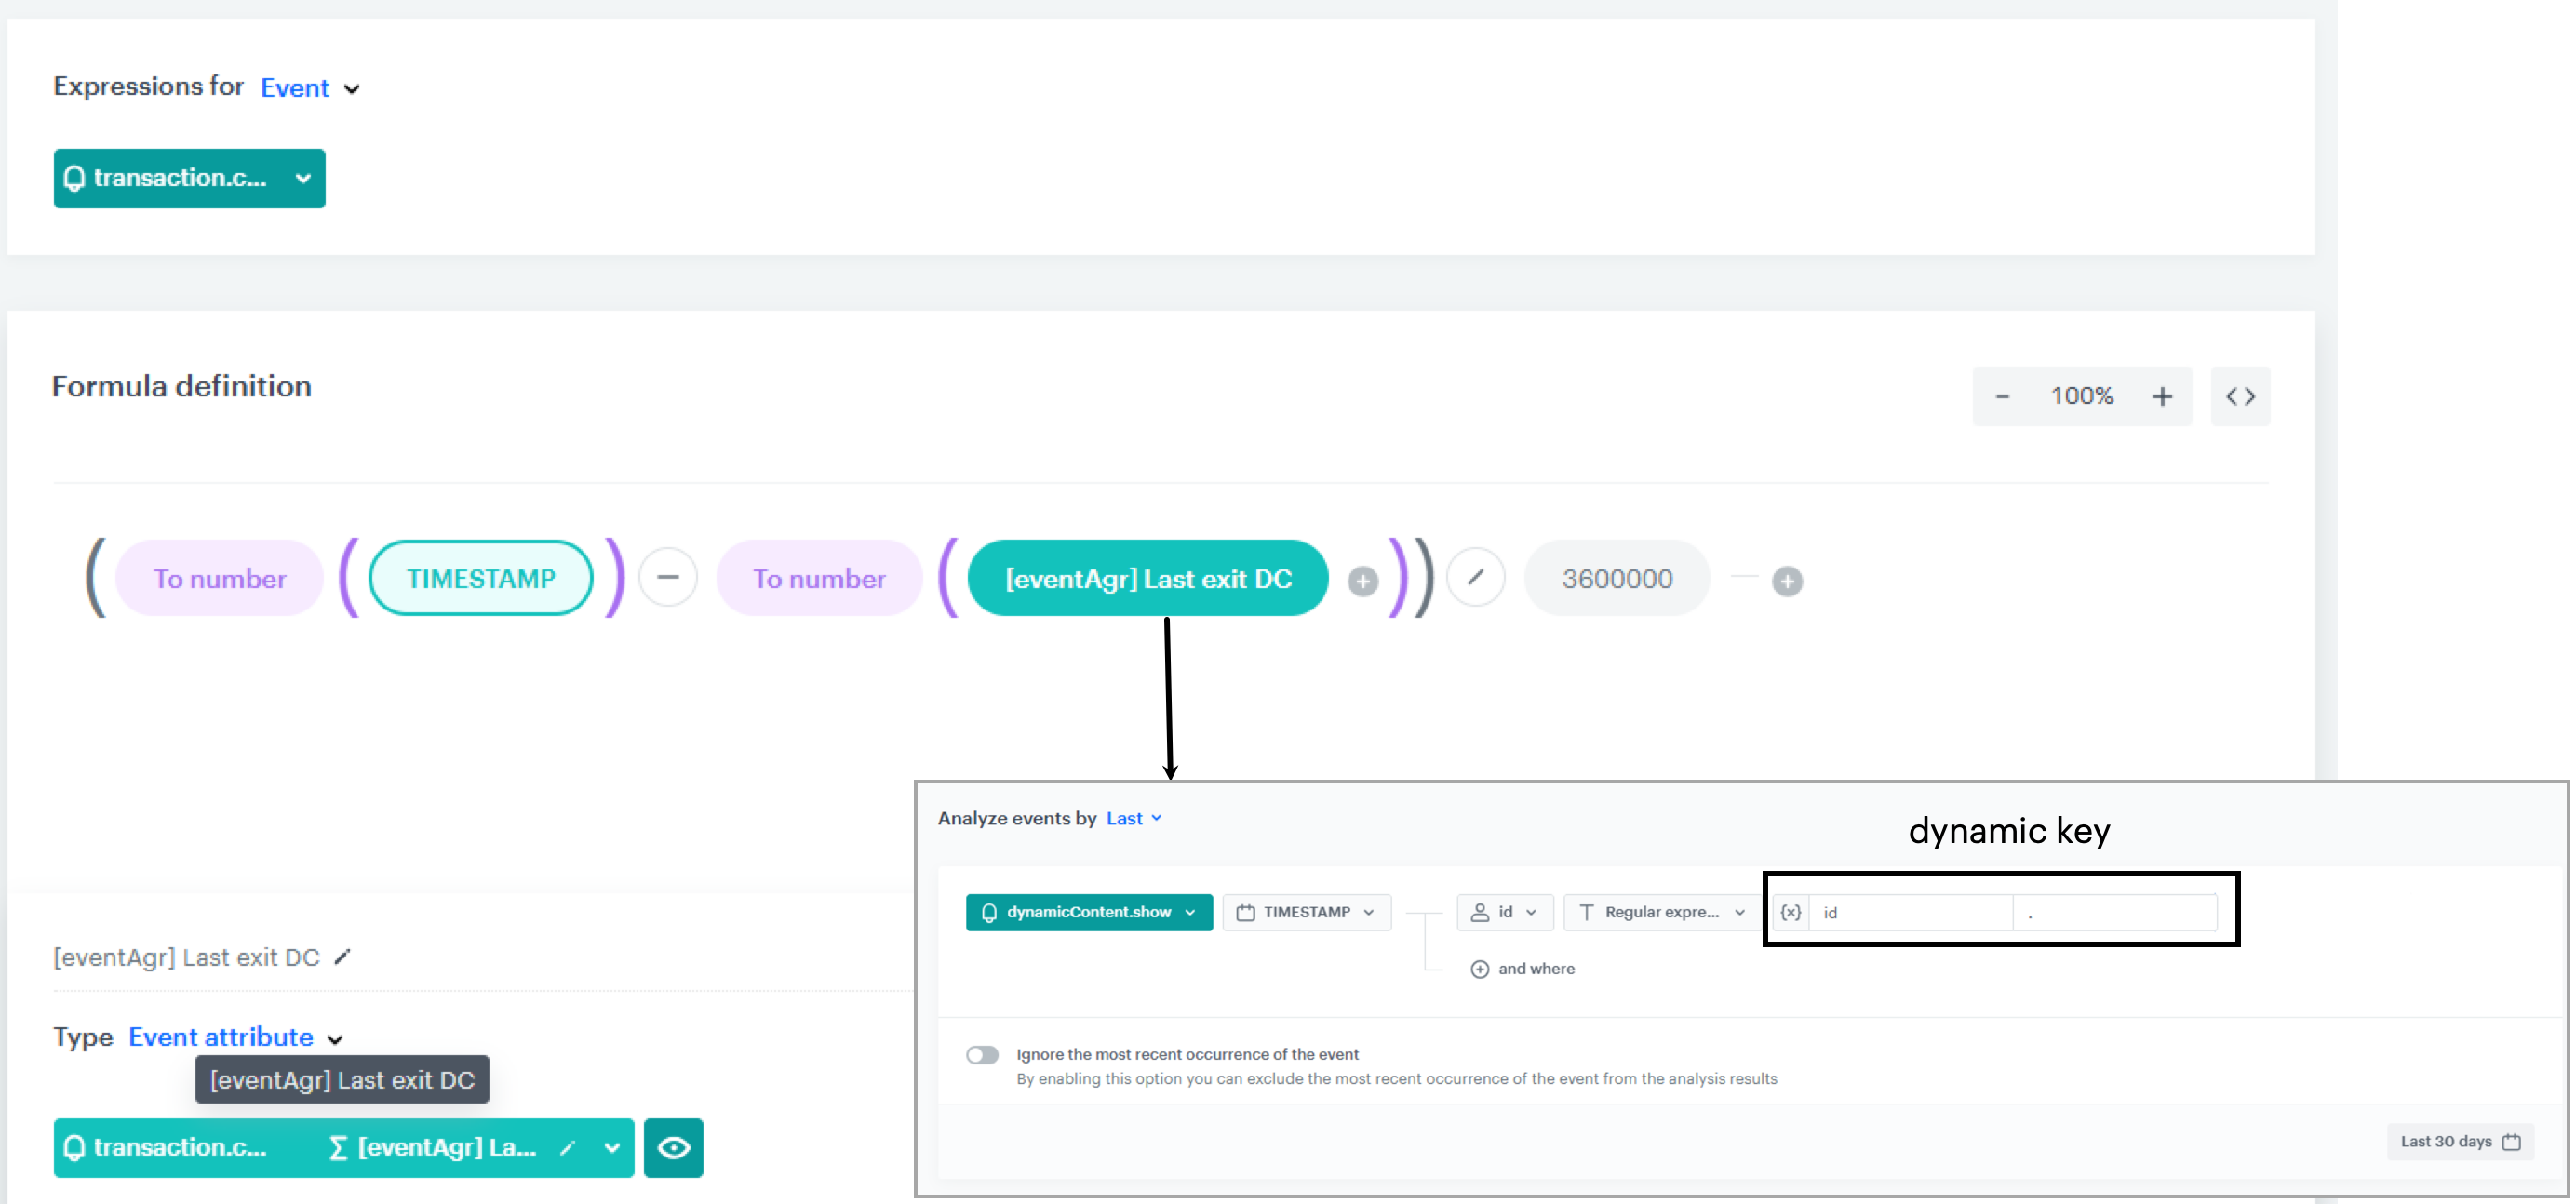
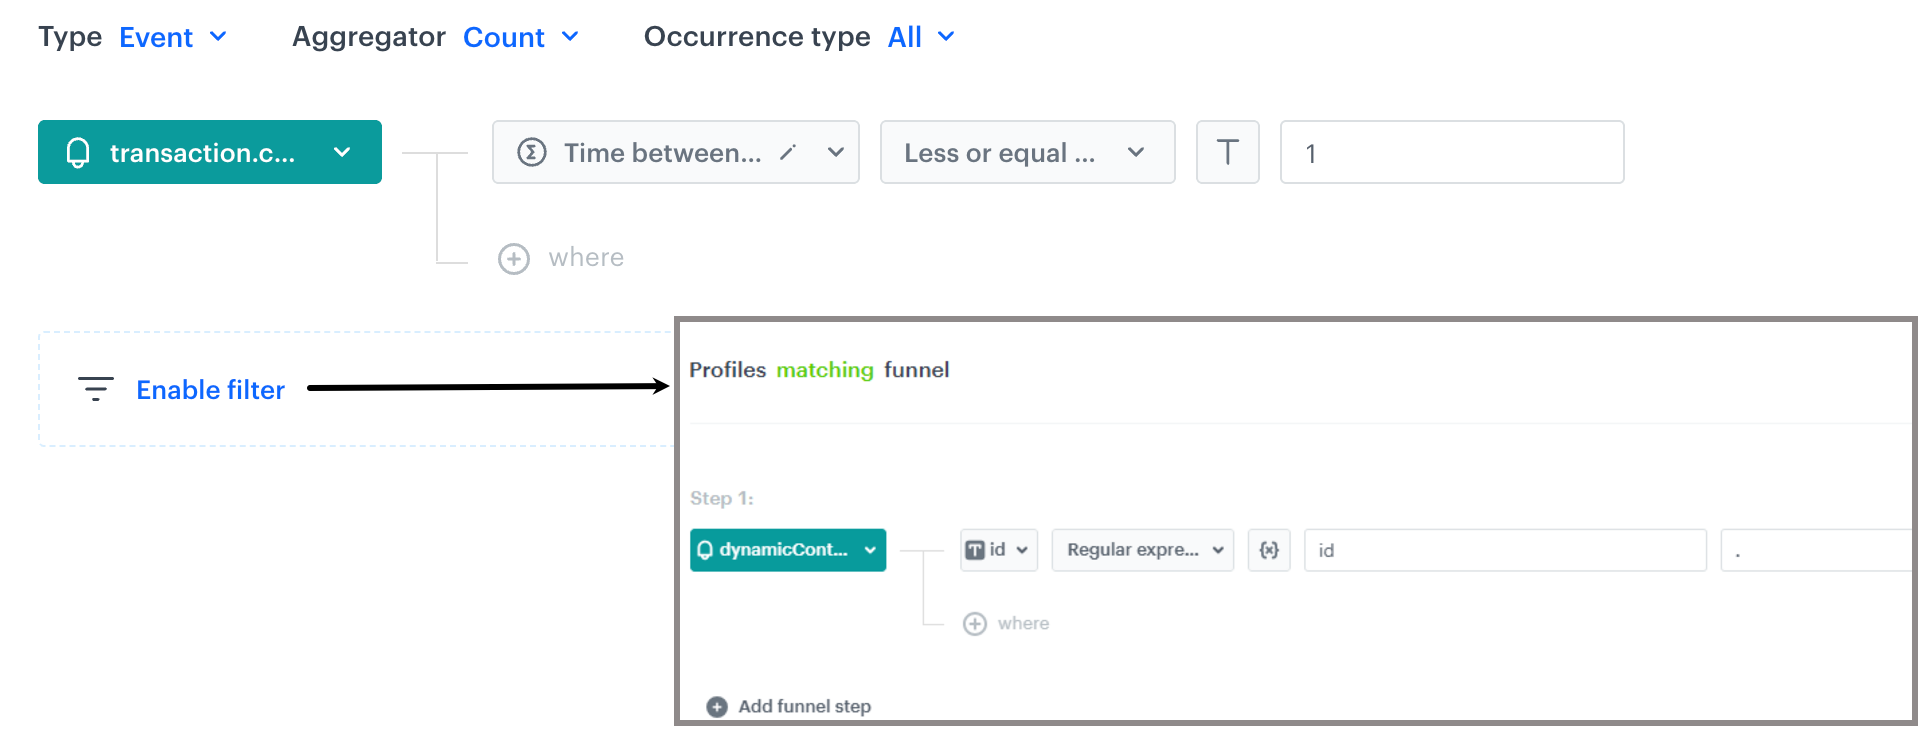
For predefined dynamic keys (such as `id` for campaigns or `clientId` for profiles) and step-by-step instructions for creating dynamic keys, see [Dynamic data in dashboards](/docs/analytics/analytics-dashboard/creating-dashboards#dynamic-data-in-dashboards).

</div></div></div>


## Expressions and aggregates

Expressions and aggregates are a special case. They are their own analysis types: expressions work as custom event or profile attributes based on mathematical formulas. Aggregates come in two types: profile aggregates summarize event data per individual customer over a time range, while event aggregates analyze an event occurrence and the occurrences before it, acting as custom event parameters that can be used in filters. Both expressions and aggregates can also be used as building blocks inside other analyses — for example, inside a metric condition or a segmentation filter.

Profile aggregates and expressions calculate results per individual customer rather than returning a single aggregate value, so they behave dynamically by nature: each customer gets their own computed value. For this reason, the `clientId` dynamic key is added to profile aggregates and expressions automatically — you do not need to add it manually. When a profile aggregate or expression is added to a dashboard, the `clientId` key either activates the dynamic key option or appears as an additional field in the **Dynamic keys** panel alongside any other keys detected from other analyses on the dashboard. You can also define additional dynamic keys in expressions and profile aggregates.

## Inheriting dynamic keys

An analysis does not automatically inherit dynamic keys from analyses nested inside it, such as event aggregates used in expressions or conditions. Even if a nested analysis uses a dynamic key, the parent analysis remains static — meaning the key cannot be adjusted on the dashboard.

**Example**: A metric counts `transaction.charge` events that occur within 1 hour of a Dynamic Content display. The time difference is calculated using an expression that references an event aggregate (`[eventAgr] Last exit DC`). The event aggregate uses a dynamic key to store the DC campaign ID. However, because the dynamic key is defined only inside the nested aggregate — not at the top level of the metric — the metric itself is static. On the dashboard, the ID cannot be changed and must be manually edited in the metric each time a new campaign is analyzed.  


<div class="content-tabs" data-tab-group="tabgrp-5219">
<div class="tab-buttons"><button class="tab-button" data-tab-id="tabgrp-5219-0" data-tab-group="tabgrp-5219" data-tab-active="true">Metric settings</button><button class="tab-button" data-tab-id="tabgrp-5219-1" data-tab-group="tabgrp-5219">Expression with nested event aggregate</button></div>

<div class="tab-panel" data-tab-id="tabgrp-5219-0" data-tab-group="tabgrp-5219" data-tab-active="true">

<figure><img src="/api/docs/image/8e62e386f19e76b18f8d5beceff5df82b2aed3ad/docs/analytics/_gfx/metrics-transaction-charge.png" class="large" alt="A metric with a nested expression which contains an event aggregate with a dynamic key"><figcaption>A metric with a nested expression which contains an event aggregate with a dynamic key</figcaption></figure>

</div>

<div class="tab-panel" data-tab-id="tabgrp-5219-1" data-tab-group="tabgrp-5219">

<figure><img src="/api/docs/image/8e62e386f19e76b18f8d5beceff5df82b2aed3ad/docs/analytics/_gfx/event-expression-metrics.png" class="large" alt="An expression that contains an event aggregate with a dynamic key"><figcaption>An expression that contains an event aggregate with a dynamic key</figcaption></figure>

</div>
</div>


**Solution**: To make the metric inherit the dynamic key, define the same dynamic key in the metric settings by adding a profile filter that uses exactly the same dynamic key conditions as in the nested analysis (the same event, dynamic key name, logical operator and dynamic key value). Once the key is present at this level, the metric becomes dynamic and the key can be adjusted directly on the dashboard without editing the metric.

<figure><img src="/api/docs/image/8e62e386f19e76b18f8d5beceff5df82b2aed3ad/docs/analytics/_gfx/metric-with-profile-filter.png" class="large" alt="A metric with applied profile filter that contains dynamic key"><figcaption>A metric with applied profile filter that contains dynamic key</figcaption></figure>
