
You can summarize a data set created on the basis of a selected event within a specified time range. This analysis includes profile context, allowing for displaying the result for an individual profile. Within the aggregate preview, you can select a profile identifier to view the results for that specific profile.


Examples of what you can calculate with profile aggregates:
- You can [calculate the number of visits of a profile on desktop](/use-cases/channel-preference#aggregate-returning-number-of-visits-on-the-desktop) and [in the mobile application](/use-cases/channel-preference#aggregate-returning-number-of-visits-in-the-mobile-application) to help you understand profile preferences of a communication channel.
- You can [calculate the duration of the latest visit on the website](/use-cases/calculate-time-spent-on-website#create-aggregates).
- You can create an aggregate which returns the SKU of an item recently purchased by a profile.


<div class="admonition admonition-important"><div class="admonition-icon"><svg xmlns="http://www.w3.org/2000/svg" fill="none" viewBox="0 0 24 24" stroke="currentColor" stroke-width="2.5"><path stroke-linecap="round" stroke-linejoin="round" d="M12 8v4m0 4h.01M21 12a9 9 0 11-18 0 9 9 0 0118 0z" /></svg></div><div class="admonition-body"><div class="admonition-content">

Segmentation, expression, and aggregate definitions are cached for 20 minutes after a node with the analysis is activated in a journey.<br>
When another journey in the Automation Hub requests a result of the same analysis in that period, the cached definition is used to calculate the results. This means that if you edit a segmentation, aggregate, or expression used in a workflow, it takes 20 minutes for the new version to start being used in journeys.<br>
This includes definitions of segmentations, expressions, and aggregates nested in other analyses and used in Inserts.
</div></div></div>


## Creating a profile aggregate
---

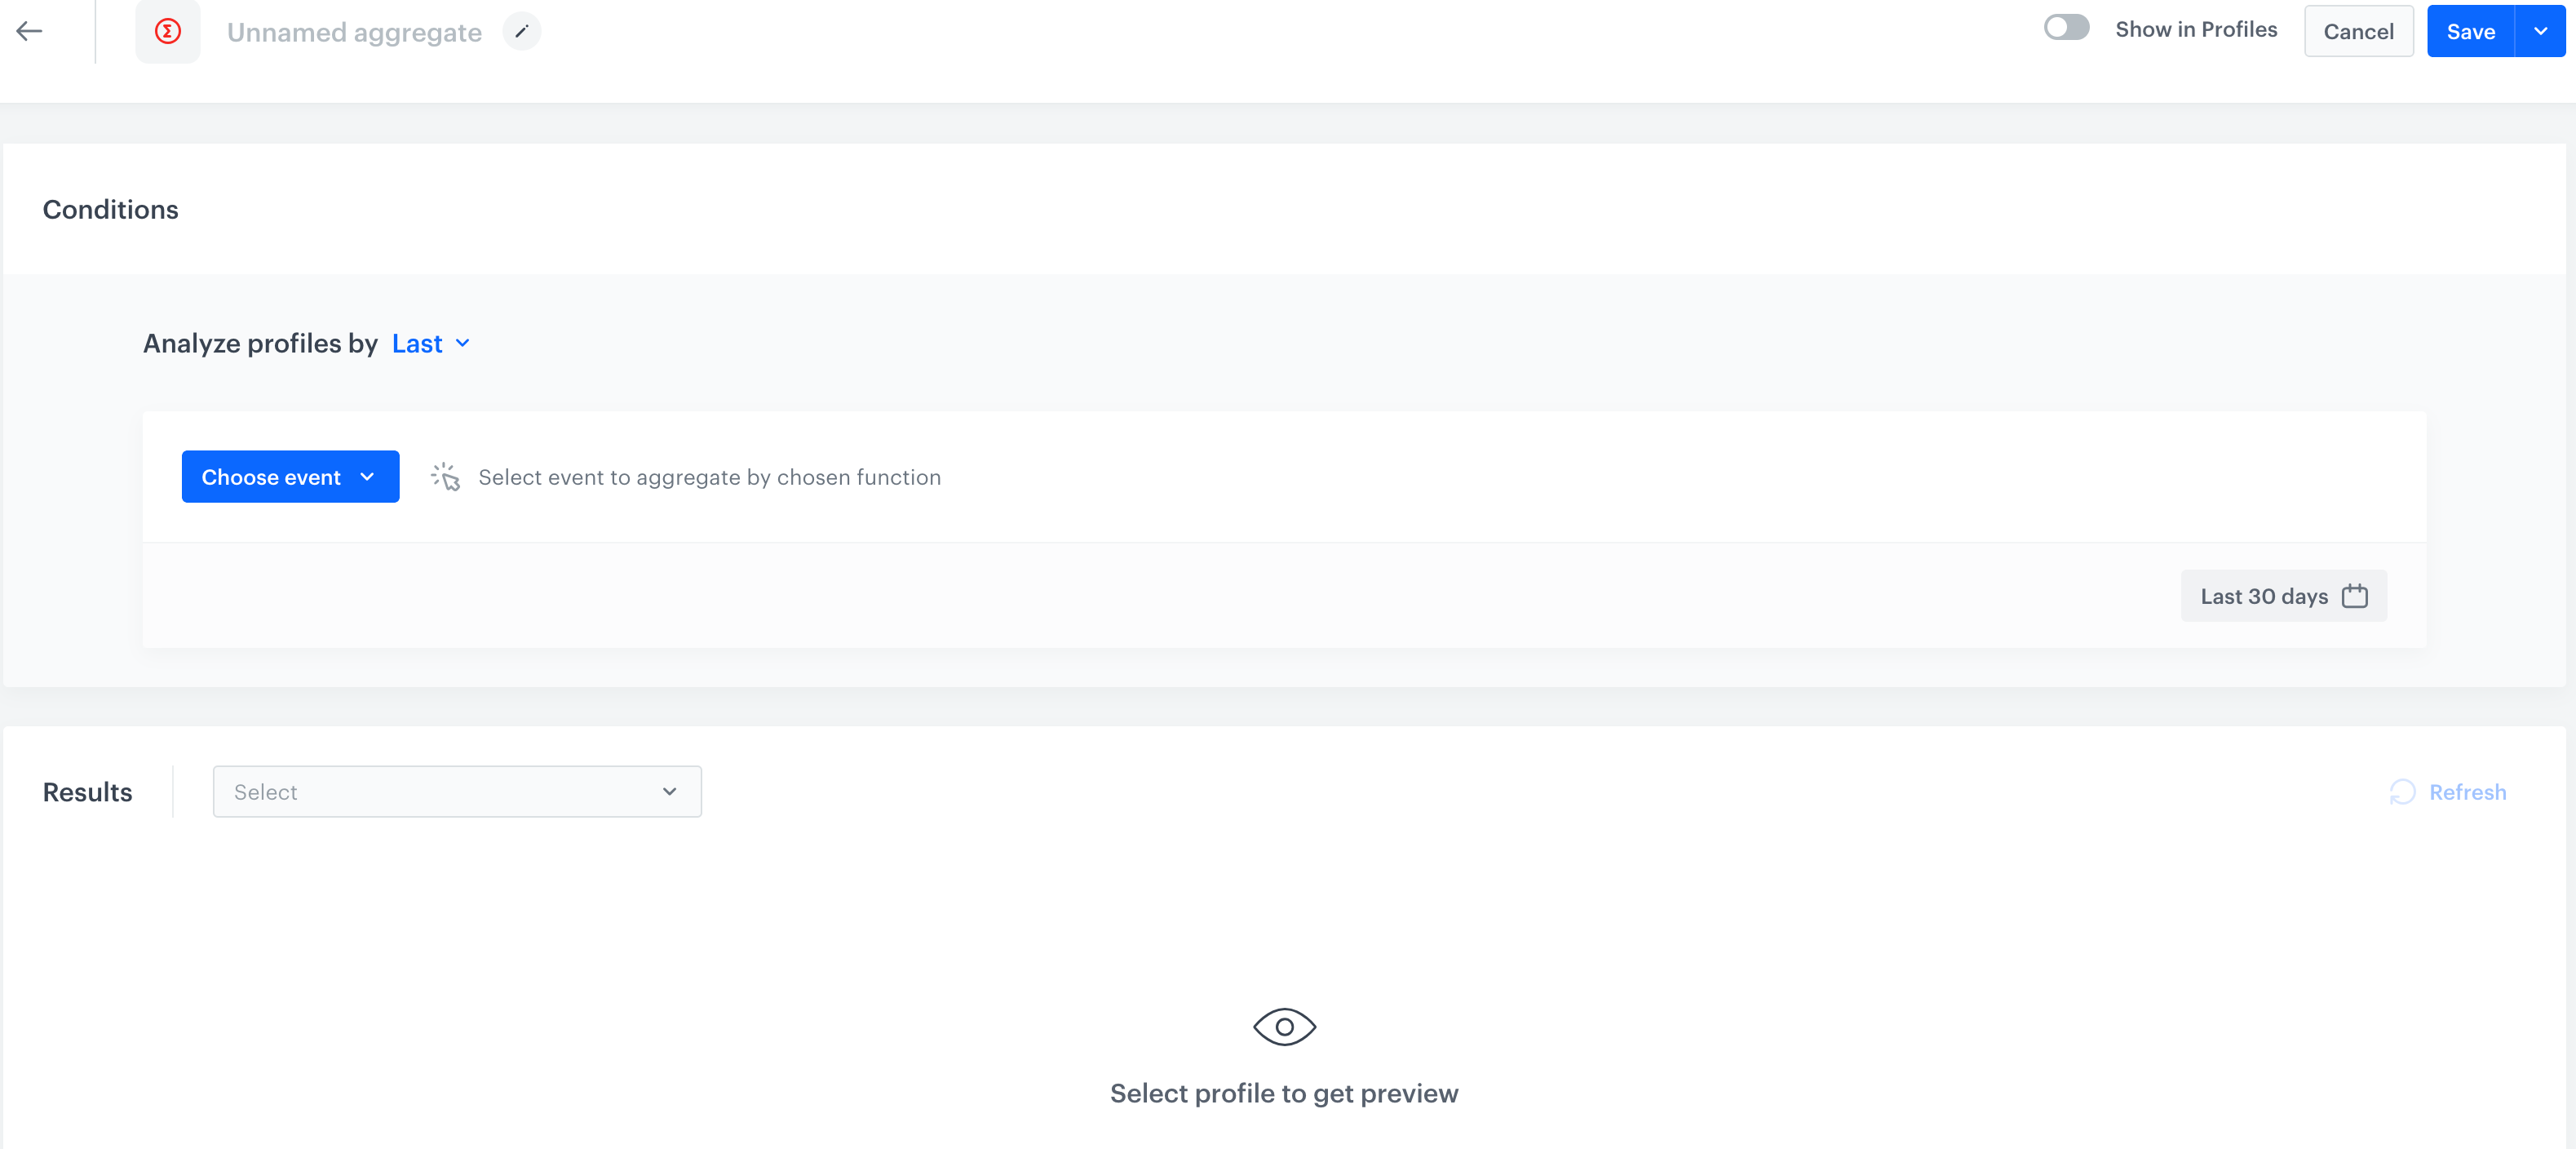
<figure><img src="/api/docs/image/f8a57079df9dd82ae8b22dc747691385d7d51d29/docs/analytics/_gfx/creating-profile-aggregates.png" class="full" alt="A blank configuration form of an aggregate"><figcaption>A blank configuration form of a profile aggregate</figcaption></figure>

1. Go to <img src="/api/docs/image/f8a57079df9dd82ae8b22dc747691385d7d51d29/icons/behavioral-data-hub-icon.svg" alt="Behavioral Data Hub icon" class="icon"> **Behavioral Data Hub > Live Aggregates > Create aggregate**.
2. As the aggregate type, select **Profile**.  
2. Enter the name of the aggregate.
4. By clicking the <img src="/api/docs/image/f8a57079df9dd82ae8b22dc747691385d7d51d29/docs/analytics/_gfx/blue-arrow.png" alt="Expander arrow icon" class="icon"> button next to **Analyze profiles by**, define the type of aggregate result. You can choose from:
    | Function | Description | Profile aggregate | Event aggregate |
    |---|---|:---:|:---:|
    | **Exists** | Returns a boolean value informing you whether a chosen event occurred in the selected time range. | <img src="/api/docs/image/f8a57079df9dd82ae8b22dc747691385d7d51d29/icons/check-s.svg" class="icon" alt="Green checkmark"> | <img src="/api/docs/image/f8a57079df9dd82ae8b22dc747691385d7d51d29/icons/check-s.svg" class="icon" alt="Green checkmark"> |
    | **Sum** | Returns the total value of an event parameter from all matching event occurrences. | <img src="/api/docs/image/f8a57079df9dd82ae8b22dc747691385d7d51d29/icons/check-s.svg" class="icon" alt="Green checkmark"> | <img src="/api/docs/image/f8a57079df9dd82ae8b22dc747691385d7d51d29/icons/check-s.svg" class="icon" alt="Green checkmark"> |
    | **Min** | Returns the minimal value of an event parameter. | <img src="/api/docs/image/f8a57079df9dd82ae8b22dc747691385d7d51d29/icons/check-s.svg" class="icon" alt="Green checkmark"> | <img src="/api/docs/image/f8a57079df9dd82ae8b22dc747691385d7d51d29/icons/check-s.svg" class="icon" alt="Green checkmark"> |
    | **Median** | Returns the value separating the higher half from the lower half. For example, if you examine the total value of purchases for a single profile, the aggregate returns the middle value of amounts spent. | <img src="/api/docs/image/f8a57079df9dd82ae8b22dc747691385d7d51d29/icons/check-s.svg" class="icon" alt="Green checkmark"> | <img src="/api/docs/image/f8a57079df9dd82ae8b22dc747691385d7d51d29/icons/check-s.svg" class="icon" alt="Green checkmark"> |
    | **Quantile** | Returns the value dividing the ordered statistical population into equal parts. For example, selecting the `80` quantile shows the value above which 20% of results are higher and the rest are lower. | <img src="/api/docs/image/f8a57079df9dd82ae8b22dc747691385d7d51d29/icons/check-s.svg" class="icon" alt="Green checkmark"> | <img src="/api/docs/image/f8a57079df9dd82ae8b22dc747691385d7d51d29/icons/check-s.svg" class="icon" alt="Green checkmark"> |
    | **Max** | Returns the maximal value of an event parameter. | <img src="/api/docs/image/f8a57079df9dd82ae8b22dc747691385d7d51d29/icons/check-s.svg" class="icon" alt="Green checkmark"> | <img src="/api/docs/image/f8a57079df9dd82ae8b22dc747691385d7d51d29/icons/check-s.svg" class="icon" alt="Green checkmark"> |
    | **Average** | Returns the average value of an event parameter. | <img src="/api/docs/image/f8a57079df9dd82ae8b22dc747691385d7d51d29/icons/check-s.svg" class="icon" alt="Green checkmark"> | <img src="/api/docs/image/f8a57079df9dd82ae8b22dc747691385d7d51d29/icons/check-s.svg" class="icon" alt="Green checkmark"> |
    | **Count** | Returns the number of event occurrences. | <img src="/api/docs/image/f8a57079df9dd82ae8b22dc747691385d7d51d29/icons/check-s.svg" class="icon" alt="Green checkmark"> | <img src="/api/docs/image/f8a57079df9dd82ae8b22dc747691385d7d51d29/icons/check-s.svg" class="icon" alt="Green checkmark"> |
    | **Count Distinct** | Returns the number of unique occurrences of an event parameter. | <img src="/api/docs/image/f8a57079df9dd82ae8b22dc747691385d7d51d29/icons/check-s.svg" class="icon" alt="Green checkmark"> | <img src="/api/docs/image/f8a57079df9dd82ae8b22dc747691385d7d51d29/icons/check-s.svg" class="icon" alt="Green checkmark"> |
    | **Last** | Returns the latest value of an event parameter. | <img src="/api/docs/image/f8a57079df9dd82ae8b22dc747691385d7d51d29/icons/check-s.svg" class="icon" alt="Green checkmark"> | <img src="/api/docs/image/f8a57079df9dd82ae8b22dc747691385d7d51d29/icons/check-s.svg" class="icon" alt="Green checkmark"> |
    | **Last - Time Window** | Works the same as Last, with the addition of a time window that limits results to event occurrences within a defined period. The maximum time window is 5 years. | <img src="/api/docs/image/f8a57079df9dd82ae8b22dc747691385d7d51d29/icons/close-s.svg" class="icon" alt="Red checkmark"> | <img src="/api/docs/image/f8a57079df9dd82ae8b22dc747691385d7d51d29/icons/check-s.svg" class="icon" alt="Green checkmark"> |
    | **First** | Returns the first value of an event parameter. | <img src="/api/docs/image/f8a57079df9dd82ae8b22dc747691385d7d51d29/icons/check-s.svg" class="icon" alt="Green checkmark"> | <img src="/api/docs/image/f8a57079df9dd82ae8b22dc747691385d7d51d29/icons/check-s.svg" class="icon" alt="Green checkmark"> |
    | **First - Time Window** | Works the same as First, with the addition of a time window that limits results to event occurrences within a defined period. The maximum time window is 5 years. | <img src="/api/docs/image/f8a57079df9dd82ae8b22dc747691385d7d51d29/icons/close-s.svg" class="icon" alt="Red checkmark"> | <img src="/api/docs/image/f8a57079df9dd82ae8b22dc747691385d7d51d29/icons/check-s.svg" class="icon" alt="Green checkmark"> |
    | **First Multi** | Returns a list (of a size you define) of items. The list can include parameters from only the first event, or from the first event and subsequent events if the first one did not contain enough items. | <img src="/api/docs/image/f8a57079df9dd82ae8b22dc747691385d7d51d29/icons/check-s.svg" class="icon" alt="Green checkmark"> | <img src="/api/docs/image/f8a57079df9dd82ae8b22dc747691385d7d51d29/icons/check-s.svg" class="icon" alt="Green checkmark"> |
    | **First Multi - Time Window** | Works the same as First Multi, with the addition of a time window that limits results to event occurrences within a defined period. The maximum time window is 5 years. | <img src="/api/docs/image/f8a57079df9dd82ae8b22dc747691385d7d51d29/icons/close-s.svg" class="icon" alt="Red checkmark"> | <img src="/api/docs/image/f8a57079df9dd82ae8b22dc747691385d7d51d29/icons/check-s.svg" class="icon" alt="Green checkmark"> |
    | **Last Multi** | Returns a list (of a size you define) of items. The list can include parameters from only the last event, or from the last event and preceding events if the last one did not contain enough items. | <img src="/api/docs/image/f8a57079df9dd82ae8b22dc747691385d7d51d29/icons/check-s.svg" class="icon" alt="Green checkmark"> | <img src="/api/docs/image/f8a57079df9dd82ae8b22dc747691385d7d51d29/icons/check-s.svg" class="icon" alt="Green checkmark"> |
    | **Last Multi - Time Window** | Works the same as Last Multi, with the addition of a time window that limits results to event occurrences within a defined period. The maximum time window is 5 years. | <img src="/api/docs/image/f8a57079df9dd82ae8b22dc747691385d7d51d29/icons/close-s.svg" class="icon" alt="Red checkmark"> | <img src="/api/docs/image/f8a57079df9dd82ae8b22dc747691385d7d51d29/icons/check-s.svg" class="icon" alt="Green checkmark"> |
    | **Top** | Returns the most popular occurrence of an event parameter. | <img src="/api/docs/image/f8a57079df9dd82ae8b22dc747691385d7d51d29/icons/check-s.svg" class="icon" alt="Green checkmark"> | <img src="/api/docs/image/f8a57079df9dd82ae8b22dc747691385d7d51d29/icons/check-s.svg" class="icon" alt="Green checkmark"> |
    | **Bottom** | Returns the rarest occurrence of an event parameter. | <img src="/api/docs/image/f8a57079df9dd82ae8b22dc747691385d7d51d29/icons/check-s.svg" class="icon" alt="Green checkmark"> | <img src="/api/docs/image/f8a57079df9dd82ae8b22dc747691385d7d51d29/icons/check-s.svg" class="icon" alt="Green checkmark"> |
    | **Top Multi** | Returns a list (of a size you define) of items, showing the most popular occurrences of an event parameter. | <img src="/api/docs/image/f8a57079df9dd82ae8b22dc747691385d7d51d29/icons/check-s.svg" class="icon" alt="Green checkmark"> | <img src="/api/docs/image/f8a57079df9dd82ae8b22dc747691385d7d51d29/icons/check-s.svg" class="icon" alt="Green checkmark"> |
    | **Bottom Multi** | Returns a list (of a size you define) of items, showing the least popular occurrences of an event parameter. | <img src="/api/docs/image/f8a57079df9dd82ae8b22dc747691385d7d51d29/icons/check-s.svg" class="icon" alt="Green checkmark"> | <img src="/api/docs/image/f8a57079df9dd82ae8b22dc747691385d7d51d29/icons/check-s.svg" class="icon" alt="Green checkmark"> |

5. From the **Choose event** dropdown list, select an event.
6. If you want to be more specific and analyze a particular aspect of the event click the **Where** button, to select [event parameters](/docs/analytics/i_events-parameter-value).  
6. To determine the time range from which the data will be analyzed, click the calendar icon.
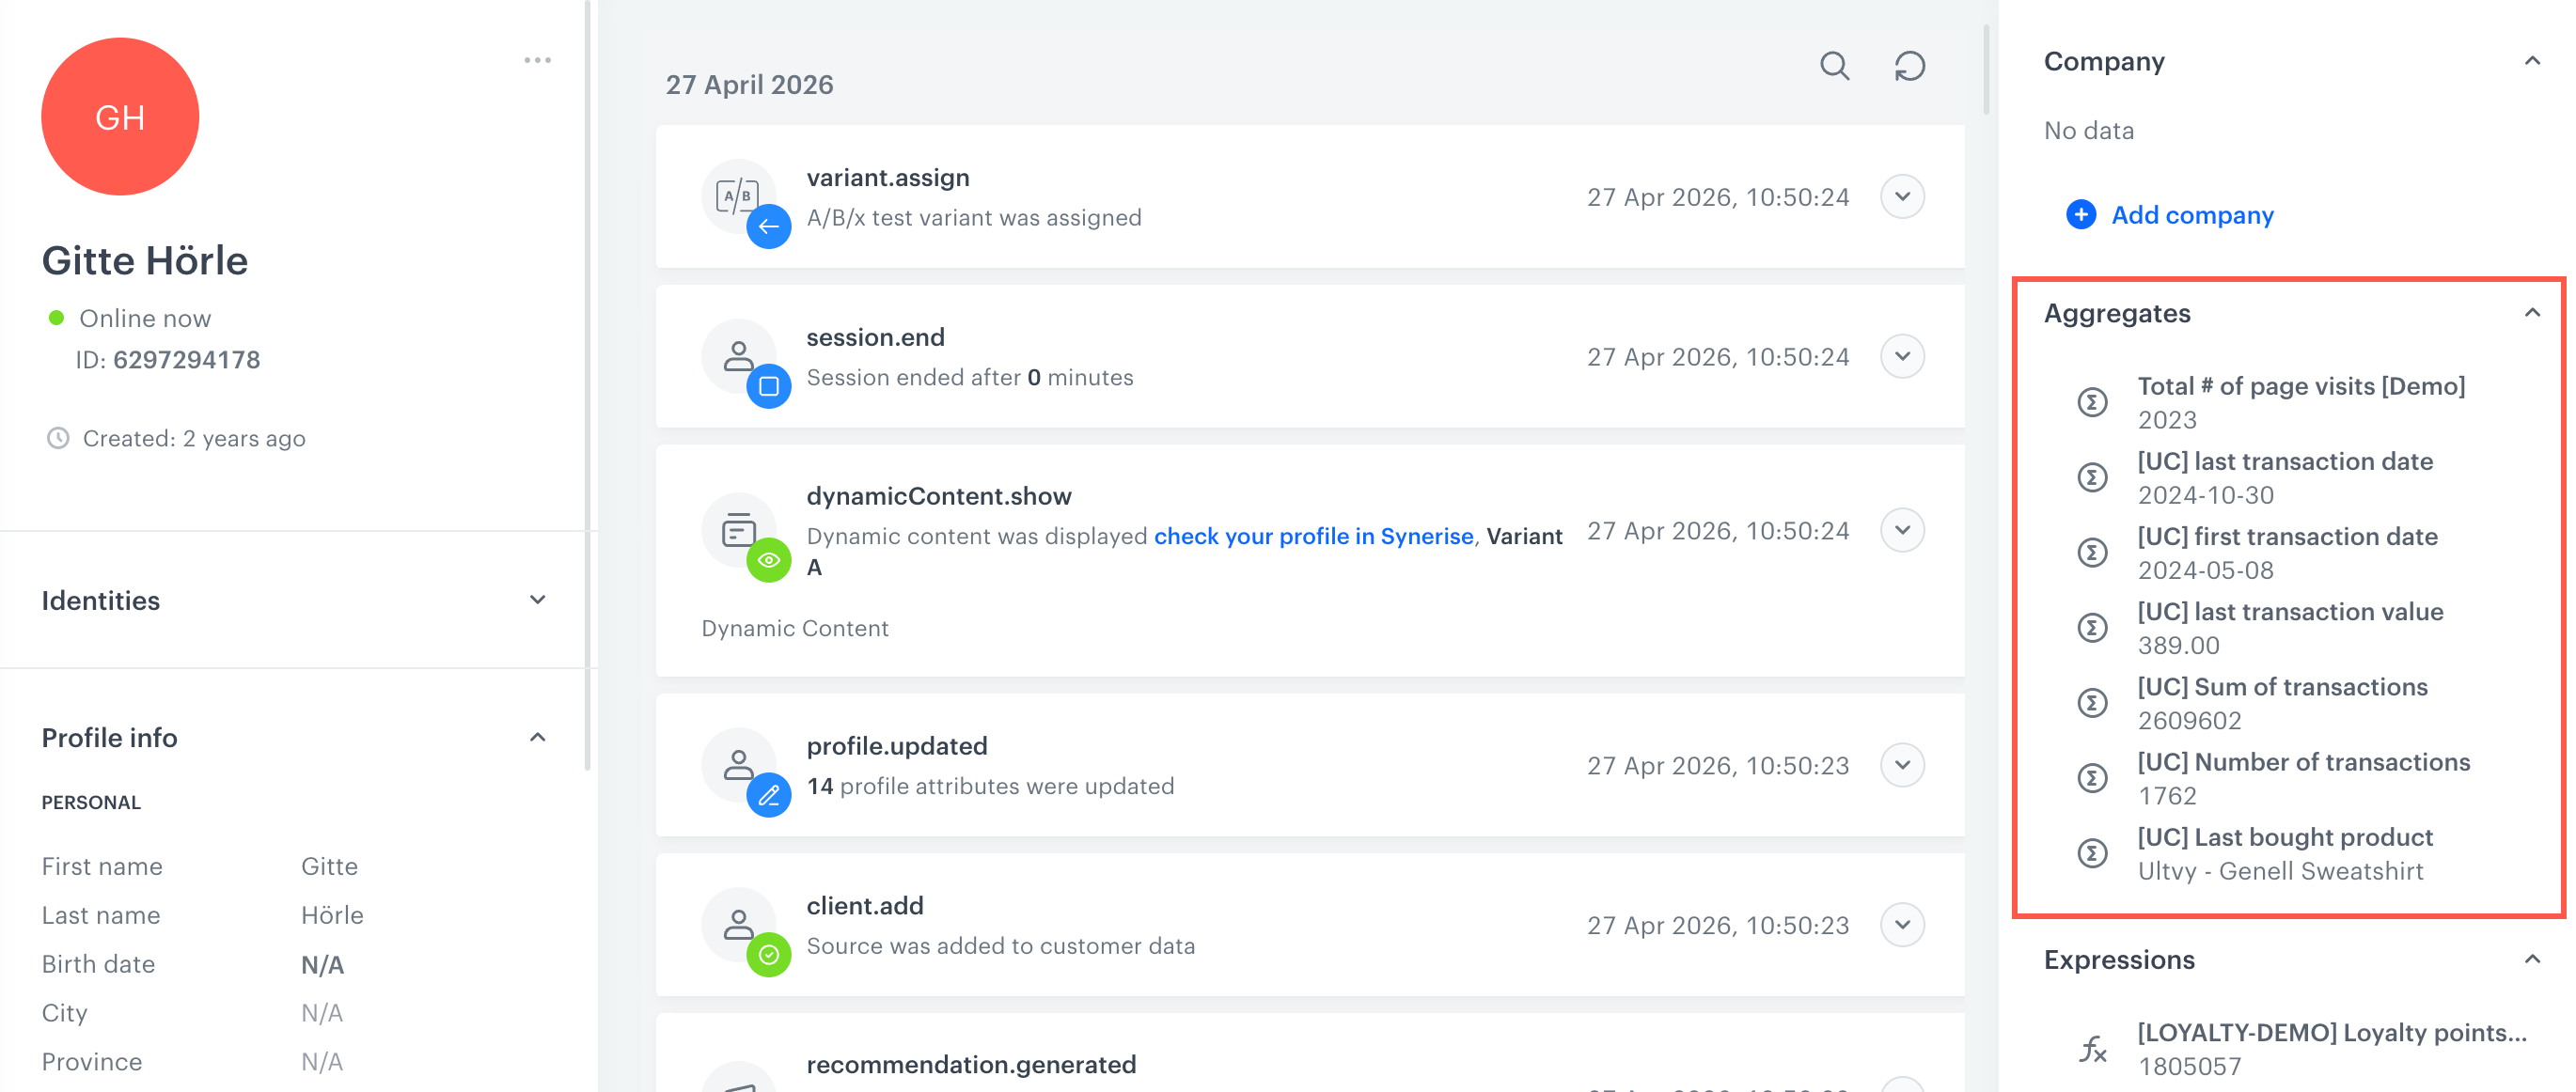
7. Optionally, if you want to show this aggregate on a customer card, switch the **Show in Profiles** option on. As an effect, you can check the results of the aggregate for a particular customer on a customer card.  
    <figure><img src="/api/docs/image/f8a57079df9dd82ae8b22dc747691385d7d51d29/docs/crm/_gfx/profile-analyses.png" class="large" alt="List of analyses on the profile card"><figcaption>List of analyses on the profile card</figcaption></figure>
8. To complete the process, click the **Save** button.
