Delays in data flow from various sources can contribute to discrepancies in the reported quantities. It is important to acknowledge that the final quantity of event consumption listed on the invoice may differ from the quantities shown in the statistics and reports. The definitive data for invoicing purposes will be determined at the end of the month, taking into account any updates or corrections that may arise during this period.
Consumption graphs and reports let you monitor your usage.
You can view graphs made with:
- the "New events" calculation method.
- the "Retention events" calculation method.
Alternatively, you can download a [comprehensive report](/docs/settings/organizations/consumption/report)
## Calculation methods
Synerise offers two modes of event calculation for consumption metrics:
- [New events](#new-events) - events that are added to the database every day.
- [Retention events](#retention-events) - the average number of events already saved in the database every day. The events are stored in the database according to their retention period, which differs between event types and may differ between workspaces.
In both methods, UTC time is used to determine what day an event belongs to.
### New events
The "New events" chart counts each event that is processed by Synerise, including events generated automatically by the SDKs and backend.
Events are counted according to the time they were added to the database.
For example, if an item was sold at an offline cash register on September 30 and the `transaction.charge` event was imported to Synerise on October 1 when the cash register came online, the event is counted towards October.
If you use `eventSalt` to overwrite events, each time the event is sent counts towards the "new events" metrics.
### Retention events
The "Retention events" chart counts the average daily number of events stored in the database, including events generated automatically by the SDKs and backend.
The events are counted in the following way:
1. Every day at midnight (UTC), Synerise checks the number of events in the database.
This may include events from earlier months, according to their retention period.
Events overwritten with `eventSalt` are treated as one event, unless the original event was already deleted due to retention.
2. The number of events is added to the monthly total.
3. At the end of the month, the monthly total is divided by the number of days in the month.
The result is the average daily number of events in the database.
The [Consumption report](/docs/settings/organizations/consumption/report) shows the retention of each event, in days. `-1` means the events are stored infinitely.
If you change the retention of an event, the change is immediate.
For example, if an event’s retention is 30 days, and you change it to 20 days, events older than 20 days are deleted from the database.
## Graph
You can view event consumption as a graph, which can be filtered by event type, date, and workspace.
1. Sign in to Synerise.
2. Enter an organization.
If you can't see any organizations next to the workspace list, it means you don't have access to an organization.
3. Go to **Statistics**.
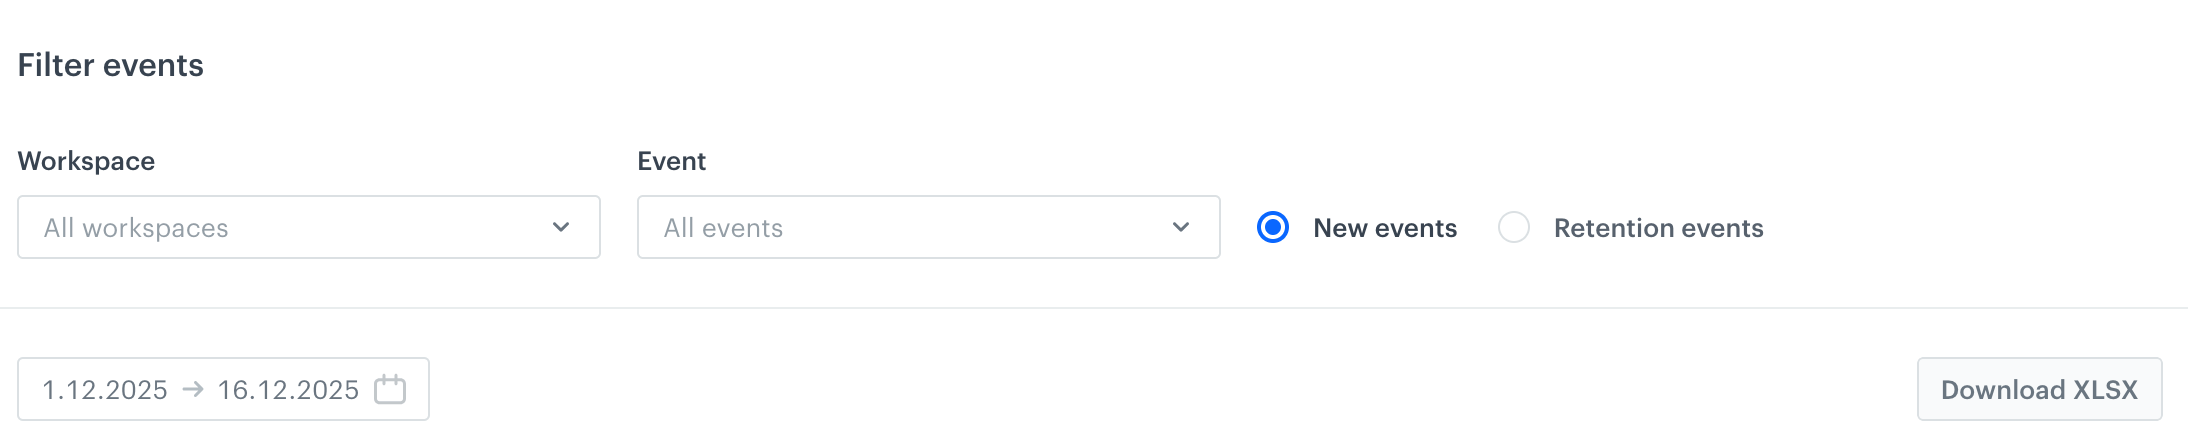
4. In the **Filter events** section, choose the data to show.
By default, the graph shows all event types, from all workspaces, according to the "New events" calculation method, from the first day of the current month until today.
Graph settings
If you want to change the data scope, you can:
- Narrow down the workspace selection with the **Workspaces** list.
- Narrow down the event type selection with the **Event** list.
- Change the calculation method between [New events](#new-events) and [Retention events](#retention-events).
- Set a different date range.
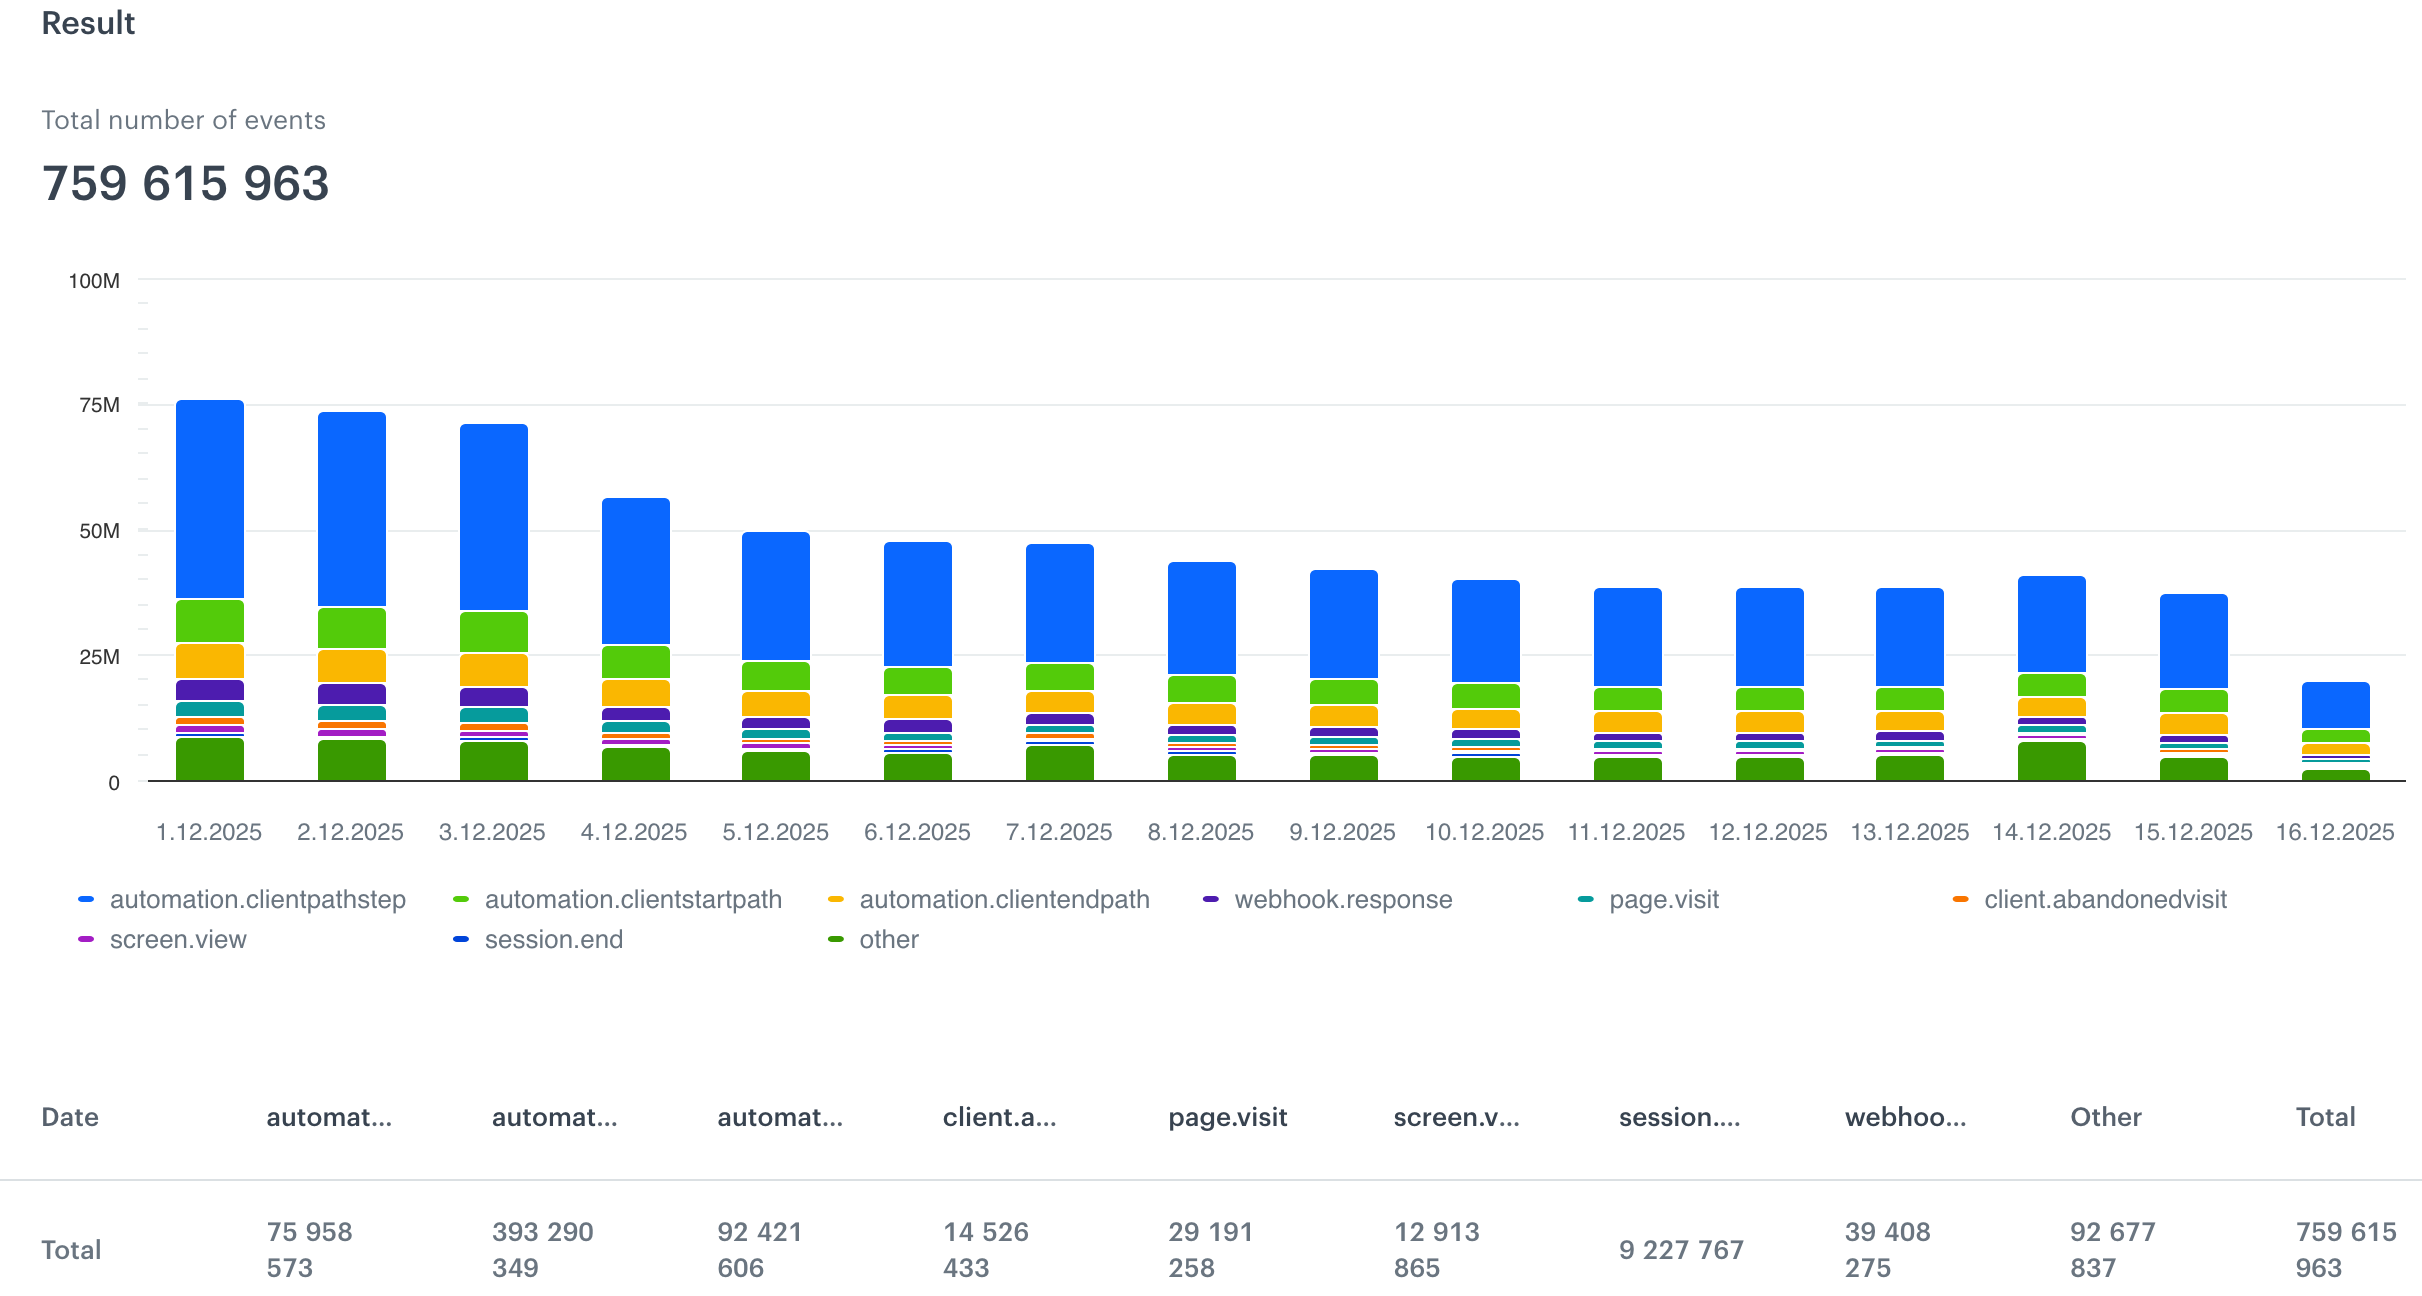
Event graph, default view
In the graph, each column (default view) is one day. If you change the date range to be more than a month, the view changes to monthly.
Under the graph, the legend informs which color denotes which event.
By hovering your cursor over a column, you can view the exact numbers.
The table below the graph shows a part of the data. To see the full table, you can use the **Download XLSX** option, and for a more detailed report, see [Comprehensive consumption reports](/docs/settings/organizations/consumption/report).