
Consumption reports are XLSX spreadsheets with:
-  Event consumption data made with both [calculation methods](/docs/settings/organizations/consumption/events#calculation-methods).
-  API call consumption details.

## Creating the report

To download a report:
1. Sign in to Synerise.
2. Enter an organization.  
    If you can't see any organizations next to the workspace list, it means you don't have access to an organization.
3. Go to <img src="/api/docs/image/54176ad07f146575310749eba44b7c2f42c1b327/icons/consumption.png" alt="Organization statistics icon" class="icon"> **Statistics**.
4. On the **Events** tab, select a data filter for the report:
   1. From the **Workspaces** dropdown list, select the workspaces to include. By default, all workspaces are selected.
   2. From the **Event** dropdown list, select the events to include. By default, all events are selected.
5. On the **API calls** tab, from the **Workspaces** dropdown list, select **the same workspaces as on the Events tab**.  
    If the selection differs, the report can't be generated.
6. Click **Generate report**.  
    Generating the report may take some time, depending on the size of the dataset.  
    **Result**: When the report is ready, your browser downloads it automatically or opens a dialog to confirm the download, depending on your settings.

## Reading the report
To read the report, open it with spreadsheet software, such as Microsoft Excel.  
You can filter and/or sort the data in the tables in the report. The available options depend on the software you're using.


<div class="admonition admonition-note"><div class="admonition-icon"><svg xmlns="http://www.w3.org/2000/svg" fill="none" viewBox="0 0 24 24" stroke="currentColor" stroke-width="2.5"><path stroke-linecap="round" stroke-linejoin="round" d="M13 16h-1v-4h-1m1-4h.01M21 12a9 9 0 11-18 0 9 9 0 0118 0z" /></svg></div><div class="admonition-body"><div class="admonition-content">

Slight discrepancies between the total average number of all retention events and the averages for individual event types or days may be caused by rounding. The number on the “Summary” sheet is more accurate.

</div></div></div>


### Summary sheet
Basic information about the report, such as the list of included workspaces and the generation date.

The table in this sheet shows the number of events and API calls in the entire organization for each month.


<div class="admonition admonition-note"><div class="admonition-icon"><svg xmlns="http://www.w3.org/2000/svg" fill="none" viewBox="0 0 24 24" stroke="currentColor" stroke-width="2.5"><path stroke-linecap="round" stroke-linejoin="round" d="M13 16h-1v-4h-1m1-4h.01M21 12a9 9 0 11-18 0 9 9 0 0118 0z" /></svg></div><div class="admonition-body"><div class="admonition-content">

If your report includes only a part of a month (for example, Sep 1 - Sep 15), remember that:

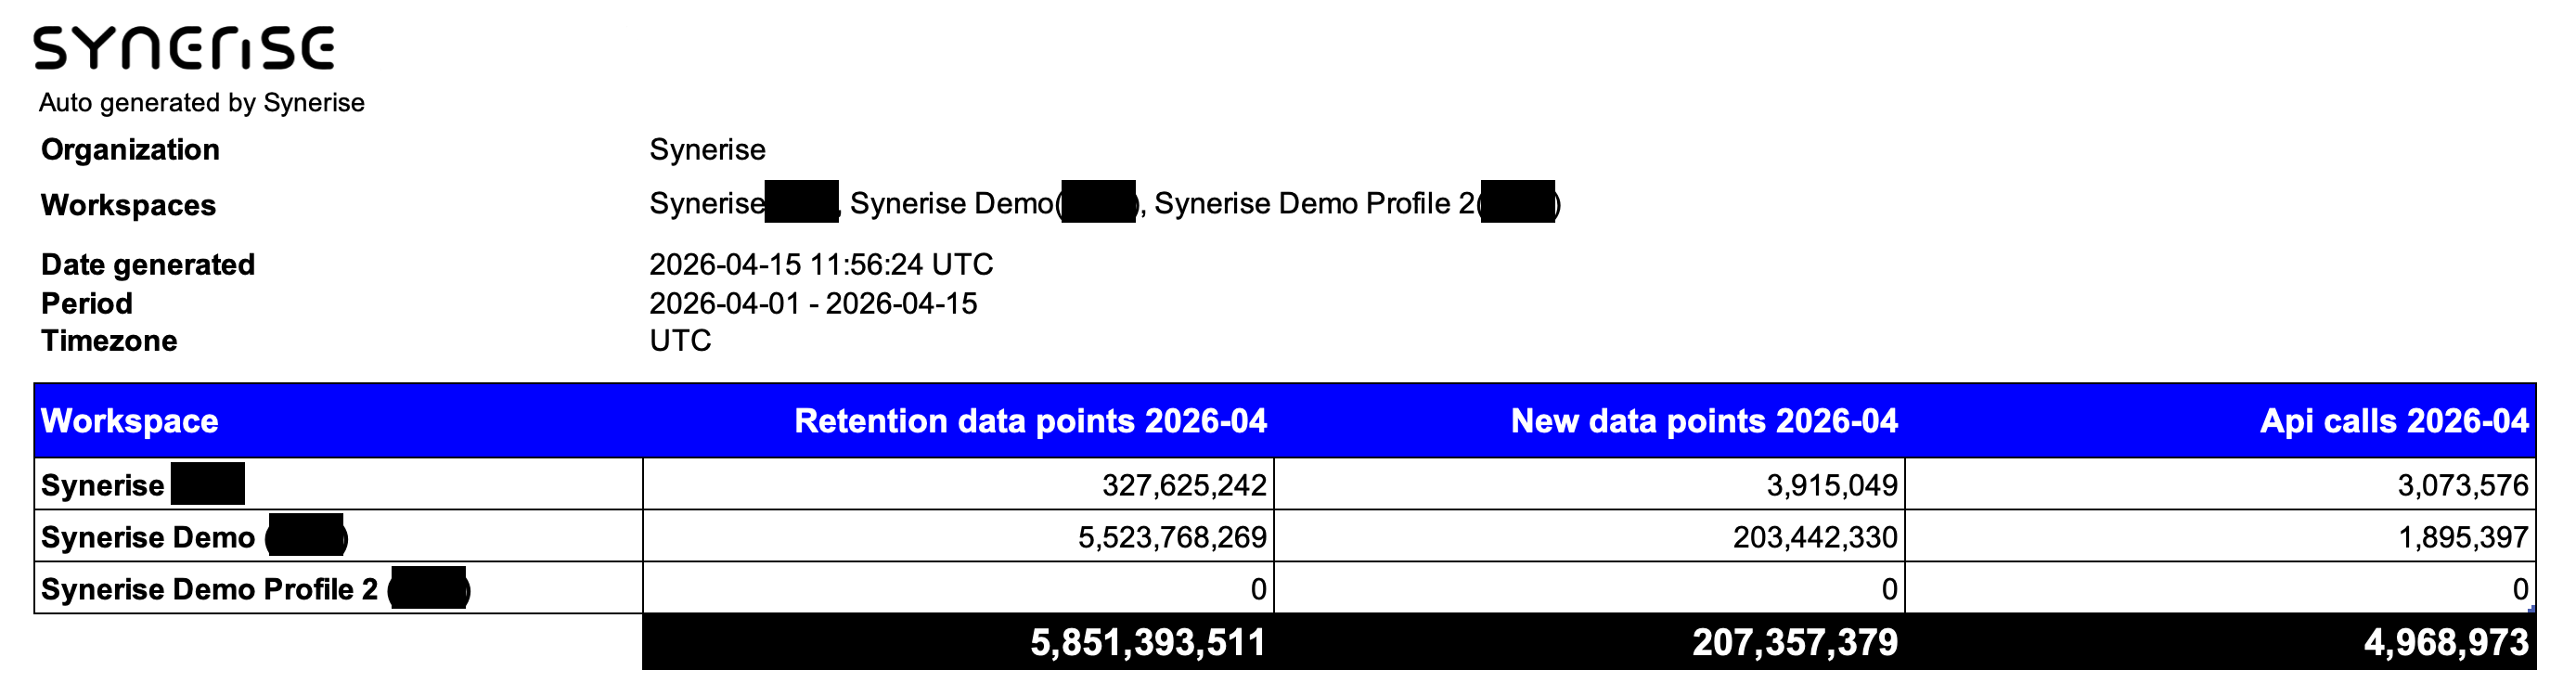
- New data points and API calls are calculated only for the days of the month that are included in the report. If your report is for only a part of the month, the number is usually lower than for a full month.
- Retention events and their average number are calculated only for the days included in the report. If a report is only for a part of a month, the average daily value is usually similar to the daily average from a full month.

</div></div></div>


<figure><img src="/api/docs/image/54176ad07f146575310749eba44b7c2f42c1b327/docs/settings/organizations/_gfx/report-summary.png" class="large" alt="Report summary sheet"><figcaption>Report summary sheet</figcaption></figure>

### All_data_YYYY-MM sheets
These sheets are generated for each month included in the report.

The tables show the number of events (both calculation methods) and API calls on each day of the month. Only workspaces and events/endpoints with at least 1 occurrence/daily average are listed.


### Monthly_summary_YYYY_MM sheets
These sheets are generated for each month included in the report.

The tables show the number of events and API calls summarized for the entire month. Only workspaces and events/endpoints with at least 1 occurrence/daily average are listed.

### All_data_workspace_YYYY_MM sheets
These sheets are generated for each month included in the report.

The tables show the number of events and API calls counted in each workspace in a given month. Only workspaces and events/endpoints with at least 1 occurrence/daily average are listed.