> Synerise Documentation — Use Cases (Part 3 of 3)
>
> This is part 3 of 3 of the "Use Cases" section. To reconstruct the full section, fetch all 3 parts in order (part 1, part 2, …) and concatenate them. Each article begins with a top-level "# " heading. The manifest listing all sections is at https://hub.synerise.com/llms-full.txt
# Dynamic content with recommendation carousel
Similar item recommendations are a powerful tool for online retailers that suggests products to customers that are similar to those they are currently browsing or have purchased in the past. These recommendations are useful as they can help customers discover new products that they might not otherwise find, and they can also help sellers increase sales by promoting products that customers are more likely to be interested in.
This use case describes the implementation of dynamic content (DC) with recommendations of similar items on a website. With predefined dynamic content web layer templates, you can create such a DC much faster without having to create a template from scratch.
## Prerequisites
---
- Implement a [tracking code](/developers/web/installation-and-configuration) into your website.
- [Configure AI engine](/docs/settings/configuration/ai-engine-configuration/engine-configuration-for-recommendations).
- [Configure an item catalog for recommendations](/docs/settings/configuration/ai-engine-configuration/engine-configuration-for-recommendations). Enable similar items recommendations.
## Process
---
In this use case, you will go through the following steps:
1. [Prepare AI recommendations](/use-cases/dynamic-content-recommendation-carousel#prepare-ai-recommendations).
2. [Create dynamic content](/use-cases/dynamic-content-recommendation-carousel#create-dynamic-content-campaign) with similar item recommendations using the predefined dynamic content web layer template.
## Prepare AI recommendations
---
In this part of the process, you will configure a similar items recommendation which will be later used in the dynamic content.
1. Go to **AI Hub > (AI Recommendations) Models > Add recommendation**.
2. Enter the name of the recommendation (it is only visible on the list of recommendation).
3. In the **Type & Items feed** section, click **Define**.
4. From the **Items feed** dropdown list, select an item feed.
5. In the **Type** section, choose the **Similar items** recommendation type.
6. Confirm the settings by clicking **Apply**.
7. In the **Items** section, click **Define**.
1. Click **Add slot**.
2. Define the minimum and maximum number of items that will be recommended to the customer in each slot.
3. Optionally, define [Static filters](/docs/ai-hub/recommendations-v2/creating-recommendation-campaign#static-filters) and [Elastic filters](/docs/ai-hub/recommendations-v2/creating-recommendation-campaign#elastic-filters).
4. Confirm by clicking **Apply**.
8. Optionally, you can define the **Boosting** factors and settings in the **Additional settings** section.
9. In the right upper corner, click **Save**.
## Create dynamic content campaign
---
Create a dynamic content campaign with recommendations of similar items using a predefined dynamic content web layer template. This dynamic content will be displayed as a pop-up on your site for the customers who have added products to their shopping cart.
1. Go to **Experience Hub > Dynamic content > Create new**.
2. Enter the name of the dynamic content.
3. Choose the **Web layer** type.
4. As the audience, select **Everyone**.
### Define content
5. In the **Content** section, click **Define**.
6. In the **Content** tab, click **Create Message**.
7. From the list of template folders, select a folder with the predefined **Web layer templates**.
**Result**: You are redirected to the list of predefined templates.
Web layer templates folder
8. Select the **Recommendations** template.
**Result**: You are redirected to the template builder.
You can edit the template in two ways, by editing the code of the template ([add inserts](/docs/campaign/dynamiccontent/creating-dynamic-content-templates/dynamic-content-template-builder#adding-a-snippet-to-the-template-code), [add variables](/docs/campaign/dynamiccontent/creating-dynamic-content-templates/dynamic-content-template-builder#adding-a-variable)) and/or by filling out the form in the Config tab. In this use case, we will use the capabilities of the predefined Config tab.
#### Edit the form in the Config tab
The form in the **Config** tab is already filled in with default values. You can keep them or change them to fit your business needs.
1. From the **Recommendation campaign** dropdown list, select the ID of recommendation campaign you created [in the previous step](/use-cases/dynamic-content-recommendation-carousel#prepare-ai-recommendations). You can find it by typing its name or ID in the search box.
2. In the **Header text** field, define the header text to appear in the popup message.
3. In the **Currency** field, specify the currency in which you want to display the prices of the recommended products.
4. In the **Bottom text** field, define the copy you want to appear in this section.
5. In the **Font** field, define the font of all text displayed in the dynamic content.
6. Define the colors in the **Bottom bar background** and **Bottom bar text color** fields.
7. Choose the most suitable carousel scrolling method for you by enabling one or all toggles at the same time:
- **Carousel autoplay**: activation of this toggle allows automatic scrolling of items in the carousel;
- **Carousel loop**: activation of this toggle allows users to navigate to the first article in the carousel by clicking the arrow after the last article displayed in the carousel;
- Enabling these two options at the same time will combine these functionalities. In this case, the recommendation carousel will scroll automatically and return to the first item automatically after displaying the last one.
- If you don't activate any of the toggles, users will have to scroll through the carousel on their own, and when they get to the last item, it won't automatically redirect them to the beginning of the carousel.
8. In the following fields, define the item amount that you would like to display in small, medium, large and extra large screens.
7. After you make changes to the template, you can check the preview.
1. Click the **Preview Contexts** button on the upper left side.
2. Enter the ID of a customer and define the product context.
3. Click **Apply**.
If you are using custom attributes in your product feed, you need to replace the names of the standard attributes used in the template code with the names of the attributes used in your feed. In our case, we changed the names of following attributes (according to the custom attribute names used in our product feed):
- `link` -> `productUrl`
- `imageLink` -> `image`
- `title` -> `name`
- `item.price.value`-> `item.price`
- `item.salePrice.value` -> `item.salePrice`
4. If the template is ready, in the upper right corner click **Save this template > Save as**.
5. On the popup:
1. In the **Template name field**, enter the name of the template.
2. From the **Template folder** dropdown list, select the folder where the template will be saved.
3. Confirm by clicking **Apply**.
6. To continue the process of configuring the dynamic content campaign, click **Next**.
7. To save your content changes, click **Apply**.
### Define schedule and display settings
1. In the **Schedule** section, click **Define** and set the time when the message will be active.
2. In the **Display Settings** section, click **Define**.
3. Specify circumstances for dynamic content to be displayed. Optionally, you can also define the Advanced options. In our case, we will define the frequency of dynamic content to be displayed to **Once per day**. You can also define the type of device you want to show your dynamic content.
4. Click **Apply**.
5. Optionally, you can define the UTM parameters and additional parameters for your dynamic content campaign.
Dynamic content configuration
6. Click **Activate**.
**Result**: This is an example of how the pop-up with the predefined template may look like on the website:
Example of dynamic content with carousel on a website
## Check the use case set up on the Synerise Demo workspace
---
You can check the configuration of each step from this use case in our Synerise Demo workspace:
- [AI Recommendation](https://app.synerise.com/ai-v2/recommendations/FvK977G7W8LM)
- [Dynamic content](https://app.synerise.com/campaigns/create/c1aff499-c68f-463e-94ba-bb3cd0c43294)
If you’re our partner or client, you already have automatic access to the **Synerise Demo workspace (1590)**, where you can explore all the configured elements of this use case and copy them to your workspace.
If you’re not a partner or client yet, we encourage you to fill out the contact [form](https://demo.synerise.com/request) to schedule a meeting with our representatives. They’ll be happy to show you how our demo works and discuss how you can apply this use case in your business.
## Generated events
This use case generates approximately 5 events per profile that completes the flow:
[`dynamicContent.show`](/docs/assets/events/event-reference/dynamic-content#dynamiccontentshow) (~1), [`dynamicContent.click`](/docs/assets/events/event-reference/dynamic-content#dynamiccontentclick) (~1), [`recommendation.generated`](/docs/assets/events/event-reference/recommendations#recommendationgenerated) (~1), [`recommendation.view`](/docs/assets/events/event-reference/recommendations#recommendationview) (~1), [`recommendation.click`](/docs/assets/events/event-reference/recommendations#recommendationclick) (~1).
## Read more
---
- [Dynamic content](/docs/campaign/dynamiccontent)
- [Dynamic content template builder](/docs/campaign/dynamiccontent/creating-dynamic-content-templates/dynamic-content-template-builder)
- [Recommendations](/docs/ai-hub/recommendations-v2)
# Create a Purchase Report Based on Product Categories
While creating a purchase analysis of specific products, we often want to group them according to specific rules, for example, by their category. However, the product category is not always added to the parameters of the transaction event. In this case, you can use Decision Hub, which creates the necessary parameter on the fly without changing the integration.
In this use case, you'll learn how to create category parameters on the fly using Synerise Decision Hub and how to create a report that shows how many purchases were made for products in the defined categories.
## Prerequisites
---
- Implement transaction events using [SDK](/developers/web/transactions-sdk) or [API](https://hub.synerise.com/api-reference/data-management#operation/CreateATransaction).
- Prepare a list of product SKUs that you would like to group into specific product categories.
## Process
---
- [Create an expression](/use-cases/group_products_by_category#group-sold-products-by-their-category-with-sku) that groups sold products into categories based on their SKU.
- [Create a metric](/use-cases/group_products_by_category#create-a-metric) that returns the number of products purchased within the defined category.
- [Create a report](/use-cases/group_products_by_category#create-a-report) that shows the metric result broken down into defined groups (product categories).
## Group sold products by their category with SKU
---
In our case, event expression is be based on the products SKU. Hovewer, it is only the example of the configuration of the expression. Depending on your business needs and parameters used in the product events, you can create any conditions that can be based for example on fragment from the product name, url, and any other conditions.
In this part of the process, you will create an event expression for the **product.buy** event. The formula of this expression will assign a product with a given SKU to a specific product category.
Groups of these SKUs have a repeating string in the middle (for example, one SKU has ZZ**XXXX**YY and another has AA**XXXX**BB)
If the SKU is included in the group corresponding to the regular expression conditions (constant with the value “.*XXXX.*”), then the expression assigns it to the product group (for example, constant with the value `Laptop`). The next groups of products will be added in the same way. If the product doesn't meet the expression conditions, it will be assigned to the `other` category.
1. Go to < **Behavioral Data Hub > Expression > New expression**.
2. Enter the name of the expression.
3. Set the Expression for option to **Event**.
4. From the dropdown list, select **product.buy**.
5. Build the expression as shown in the screenshot below:
Expression configuration
## Create a metric
---
Create a metric to receive the number of purchased products of the groups defined in the previous step.
1. Go to **Decision Hub > Metrics > New mertic**.
2. Enter the name of the metric.
3. As a metric kind, select **Simple metric**.
4. As the aggregator, set **Count**.
5. As the occurrence type, set **All**.
6. From the Choose event dropdown list, select **product.buy** event.
7. Click **Where** button.
Result: The Choose parameter button appears.
8. Click the **Choose parameter** button.
Result: A pop-up appears.
9. On the pop-up, click the **three-dot** button
Result: A dropdown shows.
10. From the dropdown, select **Expressions**.
11. In the list of expressions, find the event expression you have created [earlier](/use-cases/group_products_by_category#group-sold-products-by-their-category-with-sku).
12. Click the **Choose parameter** button.
13. From the dropdown, select **Not equal**.
14. In the text field, enter `other`.
15. To select a specific time range, click the **calendar** icon.
16. Confirm your choice with the **Apply** button.
17. Save metrics.
Metrics configuration
## Create a report
---
In this part of the process, create a report based on the metric and expression you prepared before. The result of the report is a table with the number of purchased products in each category over a specified time period.
1. Go to **Decision Hub > Reports > New report**.
2. Enter the name of the report.
3. Select metric you created in [this part](/use-cases/group_products_by_category#create-a-metric) of the process.
4. From the **Range** dropdown list, select the number of top (the most frequently bought group of products) to be shown in the preview of the report.
The selected number of product groups in the range must be greater than the number of product groups defined in the expression - for the report to pull them all in.
5. In the Dimension section, select the expression created in [this step](/use-cases/group_products_by_category#group-sold-products-by-their-category-with-sku).
6. In the date range, select the time that will be analyzed.
7. Save the report.
8. Click **Preview** to see the results.
Report configuration
Preview the results of the report:
Report preview
The sold products presented in the report are grouped according to predefined categories. You can use this data to compare whether sales of a particular product group have increased during the period of interest. If there has been a noticeable increase in product group sales, there is likely to be a fraud.
In this case, you can implement an alert system using email alert/sms alert nodes or outgoing integration. You can take inspiration from the following [use case](/use-cases/slack-integration), which describes the process of creating a workflow that sends alert messages based on the results of metrics to a Slack channel.
## Check the use case set up on the Synerise Demo workspace
---
You can check the configuration of each step from this use case in our Synerise Demo workspace:
- [Expression](https://app.synerise.com/analytics/expressions/b6b60b91-9333-42db-9a87-9343a87d87fd)
- [Metric](https://app.synerise.com/analytics/metrics/9399b940-b639-4bba-a83f-2d320827cf6e)
- [Report](https://app.synerise.com/analytics/reports/9d2f7346-368d-4099-8e9f-dd749641a374)
If you’re our partner or client, you already have automatic access to the **Synerise Demo workspace (1590)**, where you can explore all the configured elements of this use case and copy them to your workspace.
If you’re not a partner or client yet, we encourage you to fill out the contact [form](https://demo.synerise.com/request) to schedule a meeting with our representatives. They’ll be happy to show you how our demo works and discuss how you can apply this use case in your business.
## Generated events
This use case does not generate any events.
## Read more
---
- [Expressions](/docs/crm/expressions)
- [Metrics](/docs/analytics/metrics)
- [Reports](/docs/analytics/reports)
# Extra points for purchases from the specific locations during specific time
In today's highly competitive business environment, establishing and nurturing customer loyalty holds immense significance for companies aiming to maintain their customer base and drive revenue growth. To accomplish this, deploying a well-designed loyalty program emerges as a powerful tool, incentivizing customers for their purchases and fostering continuous engagement and brand advocacy.
This specific use case delves into the implementation of a targeted loyalty program, wherein customers earn reward points for transactions conducted exclusively at a designated point of sale (POS). The program's strategic focus aligns with the grand opening of a new store, offering a limited-time promotion that is exclusively available during the opening weekend.
Following a purchase, it is possible to send customers an email informing them of their existing points balance. Although the specifics of this communication process are not addressed in this particular scenario, if you are interested in acquiring knowledge on generating analytics to calculate point balances for customers, we suggest referring to this [use case](/use-cases/loyalty-points-for-category), which offers a comprehensive, step-by-step tutorial on creating such analytics.
## Prerequisites
---
- Implement transaction events using [SDK](/developers/web/transactions-sdk) or [API](https://hub.synerise.com/api-reference/data-management#operation/CreateATransaction). Make sure that you implement shopID parameter that contains the ID of the point of sales where the purchase has been made.
- Implement basic [loyalty program](/use-cases/loyalty-programs-basics) based on which you granted customers with 1 point for every 1 PLN spent.
## Security configuration
Before you start working with this module, if you are a Synerise customer or partner, consider reading [the section about denylisting events](/docs/settings/tool/api#denylist). This natively accessible configuration will allow you to manage the restrictions in points management that may help you prevent fraud.
## Create a workflow
---
Design a workflow that awards 150 points for completing 10 transactions within a specified timeframe and location. In our particular use case, this will apply during the weekend when the grand opening of the stationary shop will take place. For the purposes of this use case, we will use the `ShopID` of the stationary shop, which is **POS4**.
1. Go to **Automation Hub > Workflows > New workflow**.
2. Enter the name of the workflow.
### Define the Profile Event trigger node
At this stage, we will configure the conditions that launch the workflow. As a trigger, we will use the `transaction.charge` event.
1. As the first node of the workflow, add **Profile Event**. In the configuration of the node:
1. From **Choose event** dropdown menu, choose the `transaction.charge` event.
2. Click the **+ where** button and from the dropdown list, choose **shopID**.
3. From the **Choose operator** dropdown, select **Equal**.
4. In the text field, type the name of the **shopID**, as `POS4`.
5. Click the **+ where** button and from the dropdown list, choose **revenue**.
6. From the **Choose operator** dropdown, choose **More or equal to**.
7. In the text field enter `10`.
8. Click the **+ where button** and from the dropdown list, choose **TIMESTAMP**.
9. From the **Choose operator** dropdown, choose **Custom (Date)**.
10. Click **Select date range**.
11. Set the time range in which your promotion is active. In this use case, it will be one week.
2. Confirm by clicking **Apply**.
Profile Event trigger node
### Configure the Generate Event node
In this part of the process, you will create a node that generates a `points.loyalty` event which adds extra loyalty points. This event is created in addition to the regular `points.loyalty` event. In result, the customer receives points for a purchase in the specific point of sales twice:
- Points based on the loyalty points schema described as a part of prerequisites.
- Extra points through this workflow. The body of the additional event will contain 150 bonus points for purchases in location - POS4.
1. As the second node of the workflow, add **Generate Event**.
2. In the **Event name** field, enter `points.loyalty`.
4. In the **Body** section, define the parameters of this event, and click **Apply**.
**Example content of **Body** section:**
The event body is an example. You can add more parameters or change the point calculation, perform any mathematical formula according to your business needs.
Generate Event node configuration
### Add the end node
---
1. On the **Generate Event** node, click the plus icon.
2. From the dropdown list, select **End**.
3. Optionally, define **capping**.
4. Optionally, add titles to each node so the workflow will be more understandable to your colleagues.
5. In the upper right corner, click **Save & Run**.
The workflow configuration
## Check the use case set up on the Synerise Demo workspace
---
You can check the configuration of the [workflow](https://app.synerise.com/automations/automation-diagram/db6e214d-59ee-49e1-ac73-62341017f825) directly in Synerise Demo workspace:
If you’re our partner or client, you already have automatic access to the **Synerise Demo workspace (1590)**, where you can explore all the configured elements of this use case and copy them to your workspace.
If you’re not a partner or client yet, we encourage you to fill out the contact [form](https://demo.synerise.com/request) to schedule a meeting with our representatives. They’ll be happy to show you how our demo works and discuss how you can apply this use case in your business.
## Generated events
This use case generates approximately 5 events per profile that completes the flow:
[`transaction.charge`](/docs/assets/events/event-reference/items#transactioncharge) (~1), [`automation.clientStartPath`](/docs/assets/events/event-reference/automation#automationclientstartpath) (~1), [`automation.clientPathStep`](/docs/assets/events/event-reference/automation#automationclientpathstep) (~1), [`automation.clientEndPath`](/docs/assets/events/event-reference/automation#automationclientendpath) (~1), [`points.loyalty`](/docs/assets/events/event-reference/loyalty#pointsloyalty) (~1).
## Read more
---
- [Automation Hub](/docs/automation)
- [Expressions](/docs/crm/expressions)
- [Loyalty programs basics](/use-cases/loyalty-programs-basics)
# Loyalty points for the first purchase after registration
There are various strategies to motivate new customers to join your loyalty program, boost revenue, and encourage repeat purchases, ultimately fostering long-term loyalty. One effective approach is to provide customers with rewarding loyalty points immediately upon registration, coupled with a minimum transaction requirement. By offering these points, you incentivize customers to increase their spending while providing them with a valuable currency that can be used to unlock a range of rewards, discounts, and exclusive benefits.
In this use case, we will create a workflow that grants 100 loyalty points for new loyalty program members. This offer will be available for transactions equal to or higher than 10$.
## Prerequisites
---
- Implement transaction events using [SDK](/developers/web/transactions-sdk) or [API](https://hub.synerise.com/api-reference/data-management#operation/CreateATransaction).
- Add a [custom event](https://hub.synerise.com/api-reference/data-management#operation/CustomEvent) to save data to customers' profiles when they perform an activity. In this particular use case: `points.register`
- Integrate Synerise [mobile SDK](/developers/) in your mobile application.
- Integrate mechanism for awarding loyalty points.
Find more in the [Loyalty programs basics](/use-cases/loyalty-programs-basics) use case.
## Security configuration
---
Before you start working with this hub, if you are a Synerise customer or partner, consider reading [the section about denylisting events](/docs/settings/tool/api#denylist). This natively accessible configuration will allow you to manage the restrictions in points management that may help you prevent fraud.
## Process
---
In this use case, you will go through the following steps:
1. [Create a segmentation](#create-a-segmentation) that groups customers that already have loyalty points for registration.
2. [Create a workflow](#create-a-workflow) which grants 100 loyalty points for the first purchase worth a minimum $10 after registration.
## Create a segmentation
---
In this part of the process, you create a segmentation based on the `points.register` event.
1. Go to **Decision Hub > Segmentations > New segmentation**.
2. Enter a meaningful name for the segmentation.
3. Click the **Add condition** and from the dropdown list, select the `points.register` event.
4. In the calendar in the right bottom of the page:
1. In the **Relative date range** section, click **More** and from the dropdown list, select **Lifetime**.
2. Click **Apply**.
Segmentation configuration
5. Click **Save**.
The segment is saved and can be viewed in **Preview**.
## Create a workflow
---
Create a workflow that grants 100 loyalty points for the first purchase for a minimum value to customers who register for the first time.
1. Go to **Automation Hub > Workflows > New workflow**.
2. Enter the name of the workflow.
### Define the Profile Event trigger node
At this stage, we will configure the conditions that launch the workflow. As a trigger, we will use the `transaction.charge` event with value equal to or higher than $10.
1. As the first node of the workflow, add **Profile Event**. In the configuration of the node:
1. From **Choose event** dropdown menu, choose the `transaction.charge` event.
2. Click the **+ where** button and from the dropdown list, choose **$revenue**.
3. From the **Choose operator** dropdown, select **More or equal to (Number)**.
4. In the text field, type the minimal value of the transaction. In our case it will be `10`.
5. Confirm by clicking **Apply**.
Profile Event node configuration
### Define the Profile Filter node
As the next step, add the Profile Filter node, which checks if the customer already has points for the registration. If the customer has not yet received loyalty points for registration, then in the next step we will generate an event with those points for them, and if they have already received points, then the workflow ends.
1. Add **Profile Filter** node.
2. Click **Choose filter > Profiles > Segmentations** and from the dropdown list, select [the segmentation you created in the previous step](#create-a-segmentation).
3. From the **Choose operator** dropdown, choose **Is true (Boolean)**.
4. Click **Apply**.
Profile Filter node configuration
### Congifure the Generate Event node
1. To the **Not matched** path, add a **Generate Event** node.
2. In the settings of the node:
1. Enable the **Action limit** toggle.
2. In the **Event name** field, enter the name of the event. In our case, we are using `points.register` event.
4. In the **Body** section, use the following code and modify it to your needs:
{
               "points": "100"
               }
3. Click **Apply**.
Generate Event node configuration
### Add final setting to your workflow
1. Add the **End** node to both paths.
2. Launch the workflow by clicking **Save&Run**.
Configuration of the workflow
## Check the use case set up on the Synerise Demo workspace
---
In Synerise Demo workspace, you can check the configuration of:
- [Segmentation](https://app.synerise.com/analytics-v2/segmentations/5b6f8c9a-5bef-4902-acd7-46bad11e976f)
- [Workflow](https://app.synerise.com/automations/automation-diagram/637d8052-4bff-4040-81db-afd3f1db59c7)
If you’re our partner or client, you already have automatic access to the **Synerise Demo workspace (1590)**, where you can explore all the configured elements of this use case and copy them to your workspace.
If you’re not a partner or client yet, we encourage you to fill out the contact [form](https://demo.synerise.com/request) to schedule a meeting with our representatives. They’ll be happy to show you how our demo works and discuss how you can apply this use case in your business.
## Generated events
This use case generates approximately 6 events per profile that completes the flow:
[`transaction.charge`](/docs/assets/events/event-reference/items#transactioncharge) (~1), [`automation.clientStartPath`](/docs/assets/events/event-reference/automation#automationclientstartpath) (~1), [`automation.clientPathStep`](/docs/assets/events/event-reference/automation#automationclientpathstep) (~2), [`automation.clientEndPath`](/docs/assets/events/event-reference/automation#automationclientendpath) (~1), `points.register` (~1).
## Read more
---
- [Automation Hub](/docs/automation)
- [Jinjava inserts](/developers/inserts)
- [Snippets](/docs/assets/snippets)
- [Segmentation](/docs/analytics/segmentations)
# Switch Brands in Product Recommendations with Custom Filters
In order to diversify or monetize positions in the recommendation frame, you can use the recommendation slots. By combining using slots and recommendation filters, you can create branding campaigns. Such campaigns can be later displayed on the product page.
In this example, we will set a campaign that will return items similar to the one that is the context.
However, when the context item's brand is “BrandA”, the first two items in the recommendation frame will be from the “BrandB” brand. This can be done to better position items from a brand that you have a partnership with, as the first two positions in a recommendation frame have the highest click-through rate. To make this possible, we will utilize slots.
The first slot will contain two items and no filter will be applied, unless the context item’s brand is “BrandA”, then they will be filtered to items that are from the “BrandB” brand.
The second slot, consisting of four items, won't have filters and will display similar items to the context one.
Brand switching campaign
## Prerequisites
---
The [similar recommendation model](/docs/ai-hub/recommendations-v2) must be enabled and ready.
## Create recommendations
---
1. Go to **AI Hub > (AI Recommendations) Models > Add recommendation**.
2. Enter the campaign name.
3. In the **Type & Items feed** section:
1. Click **Define**.
2. From the dropdown list, select the catalog that contains items for the recommendation.
3. As the type, select **Similar items**.
4. Click **Apply**.
4. In the **Items** section, click **Add slot**. You can name the slot for later reference.
5. Set the minimum and maximum number of items to `2`.
Setting the minimum and maximum number of items to the same number ensures that exactly this many items will appear in the slot.
6. Click **Static filter** and choose **IQL Query**.
7. Create a filter that applies the following logic:
- If the context brand is "BrandA", filter the results to the "BrandB" brand.
- If the context brand is NOT "BrandA", no filter should be applied.
It should resemble the following filter: `IF(context.brand == "BrandA", brand == "BrandB", ALL)`
8. Add another **slot**.
9. Set minimum and maximum number of items to `4`.
10. Enable the **Keep slots in order** toggle.
11. Click **Apply**.
12. In **Boosting**, you can enable [boosting](/docs/ai-hub/recommendations-v2/creating-recommendation-campaign#define-the-boosting-factors).
13. In **Additional settings**, you can exclude already bought products and set a metric to sort by.
14. Save the campaign by clicking **Save**.
## Generated events
This use case generates approximately 3 events per profile that completes the flow:
[`recommendation.generated`](/docs/assets/events/event-reference/recommendations#recommendationgenerated) (~1), [`recommendation.view`](/docs/assets/events/event-reference/recommendations#recommendationview) (~1), [`recommendation.click`](/docs/assets/events/event-reference/recommendations#recommendationclick) (~1).
## Read more
---
- [Filters](/docs/ai-hub/recommendations-v2/recommendation-filters)
- [Recommendation campaigns](/docs/ai-hub/recommendations-v2)
# Personalized prices for loyalty club members
---
Adjusting product prices for customers with a loyalty card affects customer engagement and attachment to the brand.
Loyalty programs provide not only motivation for customers to make a purchase but also help you to create meaningful connections. To **boost your member engagement**, you can use special discount policies.
This is an effective way to create a unique customer experience. **Special prices only for members** can be a great value to your clients, proving that you want to provide better service to them. On the other side, your lower prices will seem more appealing and encourage your customers to make a purchase.
## Example of use - Retail industry
**Challenge**
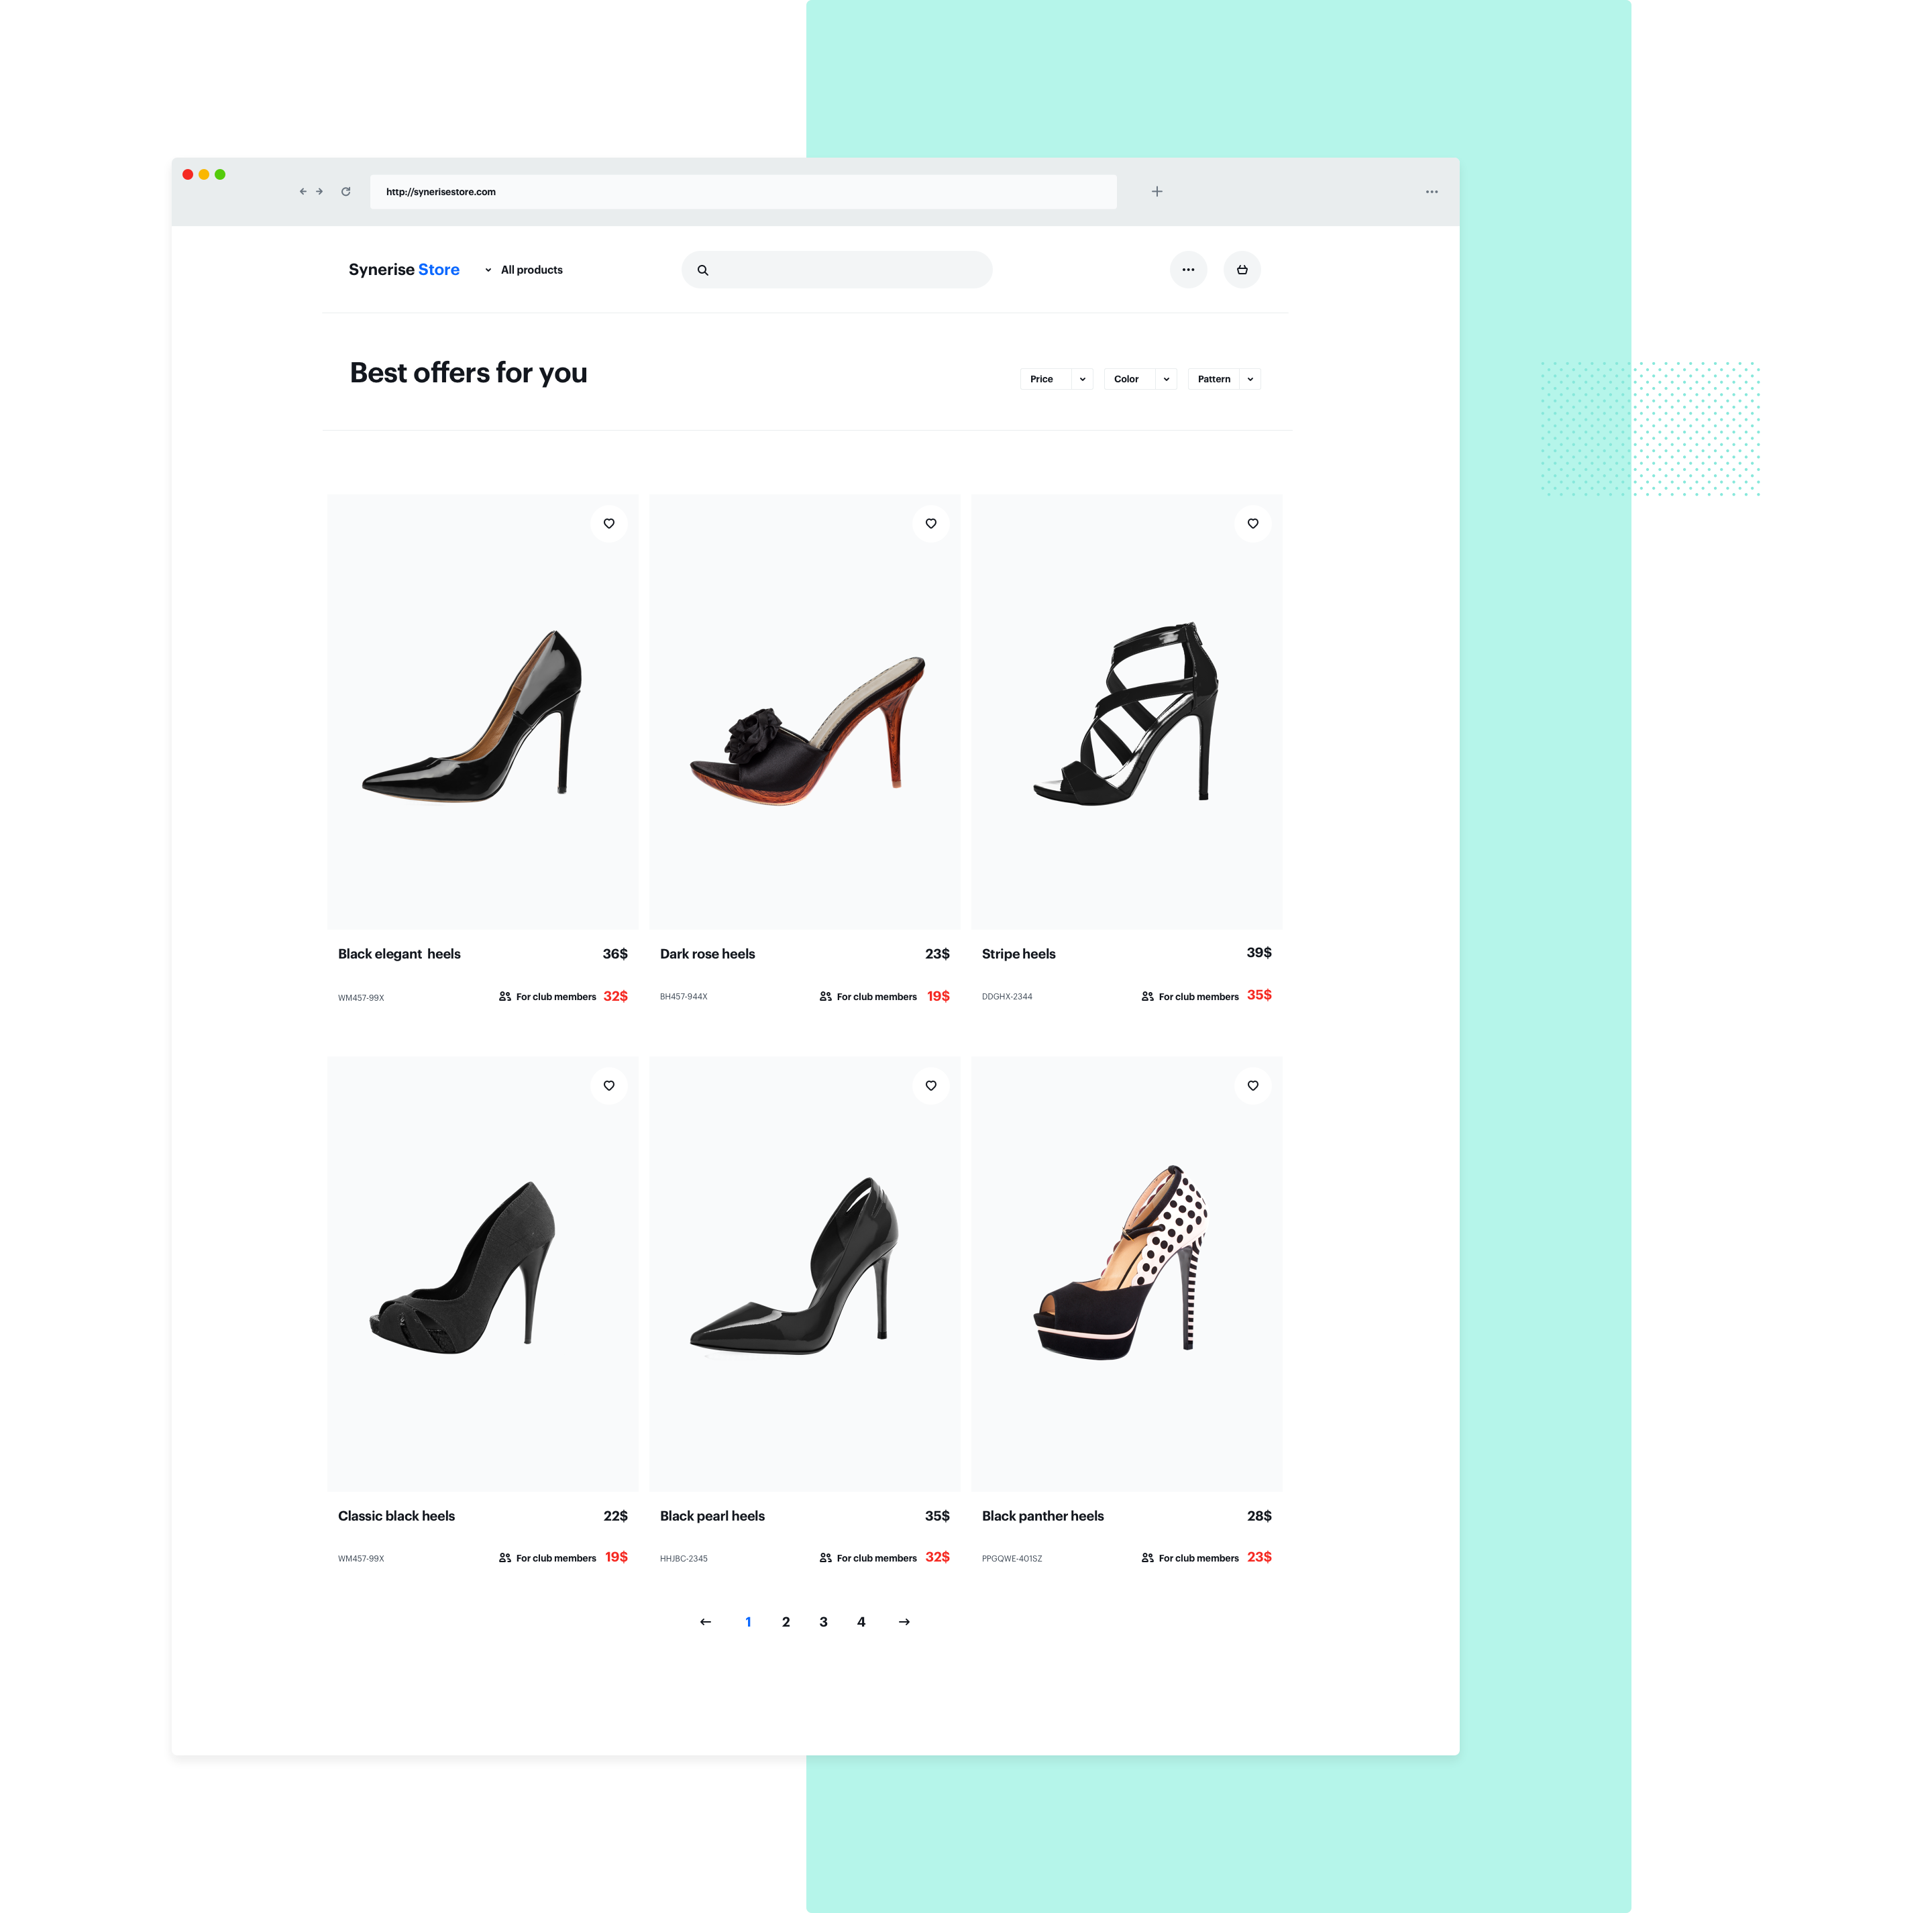
A customer from the jewelry industry has a group of clients who belong to a loyalty club. For these users, product prices in the recommendation boxes **should be reduced by 10%. **
The value of products is the same for everyone until a specific user logs in to the client panel as a loyalty club member. When the system recognizes him, then the discount is added, and relevant information is sent to Synerise.
After the customer visits the site, he will see recommended products with a better price, with a special discount for him. In addition, such products are marked with a special mini logo so that the customer is aware that this is not a standard discount, but a discount for club members.
## Requirements
---
1. Basic elements of AI integration:
- Synerise Tracker
- Product feed, filled with appropriate custom attributes
- Transactional events
- OG tags
2. Additionally:
- information in the product feed about the price after the discount, saved as a custom parameter, or providing a special rule by which we will calculate the price
- information sent to dataLayer or a cookie with information about being a loyalty club member
## How to do it
---
1. Prepare AI campaign. Select the type of recommendation, for example personalized recommendations.
2. In the next step, you should modify the dynamic content campaign so that it will download information from dataLayer or cookies and modify the prices of products.
To prepare the mechanism, both product prices should be downloaded **using jinjava**. This is necessary because downloading data from the feed is only possible when the user enters the website, and at this time we do not yet have information whether a given discount should be granted. It's best to keep both prices hidden in CSS. We check the information in Data Layer / cookies in JS and based on it we discover the price accordingly.
Sample code below:
- **HTML:**
Here the appropriate price variant is discovered.
## Generated events
This use case generates approximately 5 events per profile that completes the flow:
[`dynamicContent.show`](/docs/assets/events/event-reference/dynamic-content#dynamiccontentshow) (~1), [`dynamicContent.click`](/docs/assets/events/event-reference/dynamic-content#dynamiccontentclick) (~1), [`recommendation.generated`](/docs/assets/events/event-reference/recommendations#recommendationgenerated) (~1), [`recommendation.view`](/docs/assets/events/event-reference/recommendations#recommendationview) (~1), [`recommendation.click`](/docs/assets/events/event-reference/recommendations#recommendationclick) (~1).
## Read more
---
- Read more about [AI](/docs/ai-hub/recommendations-v2/recommendation-types#personalized)
- Read more about [dynamic content](/docs/campaign/dynamiccontent)
- Read more about [recommendation types](/docs/ai-hub/recommendations-v2)
# Promotion with basket trigger
Basket trigger promotion applies to the entire contents of a shopper's basket and the customer is entitled to the promotion when the total value of the shopping cart exceeds a designated range.
The decision to frame a promotion within a specific range of purchase values is strategic and purposeful. By setting a minimum threshold for eligibility, customers are motivated to explore additional products or services to reach the lower end of the range, often discovering new items of interest. On the other hand, those who are considering higher-value purchases find the incentive to maximize their savings by striving for the upper end of the range. This enables businesses to harmonize the promotion with their broader pricing strategy.
In this use case, if a customer's total basket value is between 100-500 PLN, they become eligible for a generous 10% discount on their overall purchase.
## Prerequisites
---
- POS must be integrated with Synerise promotion engine to calculate discounted values of basket items.
- Apply [the Process basket method](https://hub.synerise.com/api-reference/loyalty-and-engagement#operation/processSale_POST) which sends information (basket value and purchased items) about the transaction made at the checkout to Synerise (in the case of applying promotions, also in offline stores). This way, we can determine whether the transaction qualifies for being included in this specific promotion.
- Implement transaction events using [SDK](/developers/web/transactions-sdk) or [API](https://hub.synerise.com/api-reference/data-management#operation/CreateATransaction).
- Implement promotions with [SDK mobile in your mobile application](/developers/mobile-sdk/loyalty) or through [API](https://hub.synerise.com/api-reference/loyalty-and-engagement#operation/profileLogin) in any channel.
This use case only works when Synerise is the [main source of promotion calculation](/docs/ai-hub/promotions/introduction-to-promotions#promotion-implementation-variants).
## Creating the promotion
---
1. Go to **AI Hub > Regular Promotions > Add promotion**.
2. Select the **For entire cart** option.
3. In the **Audience** section, select a group of customers for whom the promotion will be activated. Confirm your selection, by clicking **Apply**.
4. In the **Content** section, define the name, description, and an image of the promotion. Confirm the settings by clicking **Apply**.
5. In **Type & limits** section:
1. As a discount type, choose **Percentage**.
2. In the **Value** field, enter the amount of discount, in our case it's `10`.
4. Define the minimum and maximum basket value trigger to apply promotion. In our case it will be `100` and `500`.
5. Apply changes.
Configuration of the promotion
6. In the **Schedule** section, define the distribution period.
7. Optionally, in the **Stores** section, select the offline stores where the profiles can redeem the promotion.
8. In the **Items** section, select the catalog and items to be included in the promotion.
8. To apply all changes and run the promotion, click **Publish**.
As the next step, you can create a [document](/docs/assets/documents) within Synerise that includes this promotion, so that it [becomes visible](/docs/assets/documents/introduction-to-documents#exemplary-usages), for example, in the mobile application. Thanks to this, you can enhance the promotion's reach and effectiveness, potentially increasing customer engagement and sales.
## Check the use case set up on the Synerise Demo workspace
---
You can check the [promotion configuration](https://app.synerise.com/campaigns/promotions/317404be-1da6-4fd0-95e2-a880ab99131c) directly in Synerise Demo workspace.
If you’re our partner or client, you already have automatic access to the **Synerise Demo workspace (1590)**, where you can explore all the configured elements of this use case and copy them to your workspace.
If you’re not a partner or client yet, we encourage you to fill out the contact [form](https://demo.synerise.com/request) to schedule a meeting with our representatives. They’ll be happy to show you how our demo works and discuss how you can apply this use case in your business.
## Generated events
This use case generates approximately 4 events per profile that completes the flow:
[`client.activatePromotion`](/docs/assets/events/event-reference/loyalty#clientactivatepromotion) (~1), [`transaction.charge`](/docs/assets/events/event-reference/items#transactioncharge) (~1), [`product.buy`](/docs/assets/events/event-reference/items#productbuy) (~2).
## Read more
---
- [Promotions](/docs/ai-hub/promotions)
# A/B test in AI Search
By preparing A/B tests in AI Search, you can find out which configuration of the AI search brings better results in terms of conversion, revenue, and CTR in your business. This use case describes an implementation that compares the results of presenting search results promoting bestsellers against personalizing the results.
The bestsellers are selected according to item popularity, whereas personalization uses the history of a customer's activity.
## Prerequisites
---
- Import a product feed to Synerise. You can find instructions [here](/docs/settings/configuration/ai-engine-configuration/engine-configuration-for-search).
- Implement the `item.search.click` event that is generated when an item shown in the search results is clicked. Use this [API method](https://hub.synerise.com/api-reference/data-management#tag/AI-Events/operation/publishAiCompatItemSearchClickUsingPOST).
## Process
---
In this use case, you will go through the following steps:
1. [Prepare two search indexes](/use-cases/ai-search-ab-test#prepare-two-search-indexes).
2. [Prepare AB test](/use-cases/ai-search-ab-test#prepare-ab-test).
3. [Analyze results](/use-cases/ai-search-ab-test#analyze-results).
## Prepare two search indexes
---
As the first part of the process, create two separate search indexes (personalization and bestseller) which will differ only in the settings of search results hierarchy.
1. Go to **AI Hub > Indexes**.
2. Click **Add index**.
3. Follow the instructions on the interface until the configuration of Ranking (step 4). If you need more information, you can read instruction on configuring [AI Search index](/docs/ai-hub/ai-search/create-index).
4. Set the ranking for the personalization search index. You will create the besteller version later.
- For the personalization search index:
- Frequency of item page views to 70%
- Frequency of item purchases to 0%
- Personalization to 100%
- For the bestseller search index:
- Frequency of item page views to 20%
- Frequency of item purchases to 80%
- Personalization to 0%
5. Save the index. The index will be ready in several minutes.
View after saving the index
6. Create the bestseller search index. Apply the same settings as with the personalization search index apart from the Ranking settings.
## Prepare AB test
---
1. Go to **AI Hub > (AI Search) A/B/X Tests > New A/B test**.
2. Enter the name of the test.
3. In the **Variants and customer allocation** section, click **Define**.
4. Click the **Base variant** tab.
5. From the dropdown list, select one of the indices you created in [the previous part of the process](/use-cases/ai-search-ab-test#prepare-two-search-indexes).
6. Add the next variant by clicking .
7. From the **Index** dropdown list, select the second index you created in the previous part of the process. You can rename the tab for better management of the versions.
8. In the **Customer allocation** section, assign the percentage of customers to each variant.
9. Confirm the settings by clicking **Apply**.
10. Click **Save&Run**.
After some time you can [check the statistics of the A/B test](/use-cases/ai-search-ab-test#analyze-results).
## Analyze results
---
When the A/B tests has been running for long enough, you can analyze the statistics for each variant.
1. Go to **AI Hub > (AI Search) A/B/X Tests**.
2. From the list, select the test.
3. Choose the **Statistics** tab. You can find there the results for key performance indicators such as a conversion rate or revenue.
You can find more information about [A/B test statistics here](/docs/ai-hub/ai-search/ab-test-statistics).
4. Compare the statistics of the two indexes you created.
5. You can [export the settings of the winning variant](/docs/ai-hub/ai-search/configuring-ab-test#export-settings-of-the-winning-version) to your base index.
## Check the use case set up on the Synerise Demo workspace
---
In the Synerise Demo workspace, you can check the:
- [Index A](https://app.synerise.com/ai-v2/search/indices/5cd51abababc055a9c4a94984892949e1729770365/stats/global),
- [Index B](https://app.synerise.com/ai-v2/search/indices/949f07ea19ad6450e351b9139781de701729770402/stats/global),
- [A/B test](https://app.synerise.com/ai-v2/search/abtests/1087).
If you’re our partner or client, you already have automatic access to the **Synerise Demo workspace (1590)**, where you can explore all the configured elements of this use case and copy them to your workspace.
If you’re not a partner or client yet, we encourage you to fill out the contact [form](https://demo.synerise.com/request) to schedule a meeting with our representatives. They’ll be happy to show you how our demo works and discuss how you can apply this use case in your business.
## Generated events
This use case generates approximately 3 events per profile that completes the flow:
[`variant.assign`](/docs/assets/events/event-reference/search#variantassign) (~1), [`item.search`](/docs/assets/events/event-reference/search#itemsearch) (~1), [`item.search.click`](/docs/assets/events/event-reference/search#itemsearchclick) (~1).
## Read more
---
- [AB tests](/docs/ai-hub/ai-search/configuring-ab-test)
- [AI Search](/docs/ai-hub/ai-search)
# Collecting newsletter submissions from users without cookie tracking
Privacy regulations may require that users who decline cookie consent still have the ability to subscribe to communications such as a newsletter. In this use case, we’ll show you how to collect newsletter signups **without using tracking mechanisms**, and still create a compliant user profile in Synerise.
This setup ensures you're not violating privacy preferences while still growing your subscriber base.
## Prerequisites
---
A privacy-compliant form on your website that works independently of the SDK.
## Process
---
In this use case, you’ll go through the following steps:
1. [Create an incoming integration](/use-cases/do-not-track#create-an-incoming-integration) (webhook) to receive form data.
2. [Create a workflow](/use-cases/do-not-track#create-a-workflow) that listens to incoming events.
## Create an incoming integration
---
In this part of the process, you will create an incoming integration to securely receive form submissions from the newsletter form, from users who have opted out of cookies or tracking.
1. Go to **Automation Hub > Incoming > New integration**.
2. On the pop-up, select **without authentication**, **JWT authentication** or **Webhook from Meta** based on your business needs.
3. Enter the name of the webhook.
3. In the **Endpoint** section, click **Define**.
The URL field is already is filled in with the endpoint to which the data will be sent.
1. Optionally, you can add an icon to this integration.
3. Confirm by clicking **Apply**.
4. In the **Incoming data** section, click **Define**.
5. Click **Retrieve data**. Right after you click the button, send a request to the endpoint in the **Endpoint** section with the sample of data that will be sent through forms. Example request:
You can retrieve the data and parameters you need for your business. An example is shown above.
6. When the endpoint receives data from the request, verify the list of variables available in the **Incoming data** section. If the variables include those which are in the payload click **Apply**. If not, click **Start again** re-send request, and wait for the results.
7. Click **Save & publish**.
The full documentation of the incoming integration feature is available in the [Incoming Integration](/docs/automation/integration/incoming-webhook-node) article.
## Create a workflow
---
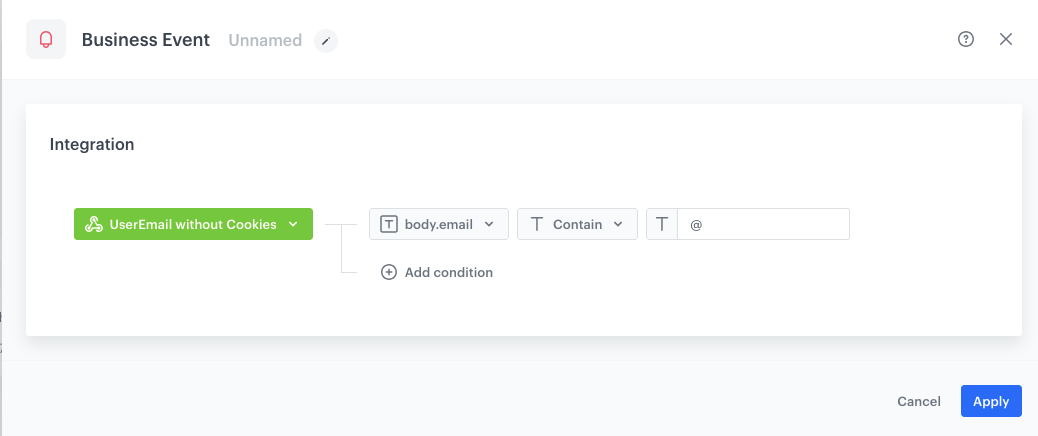
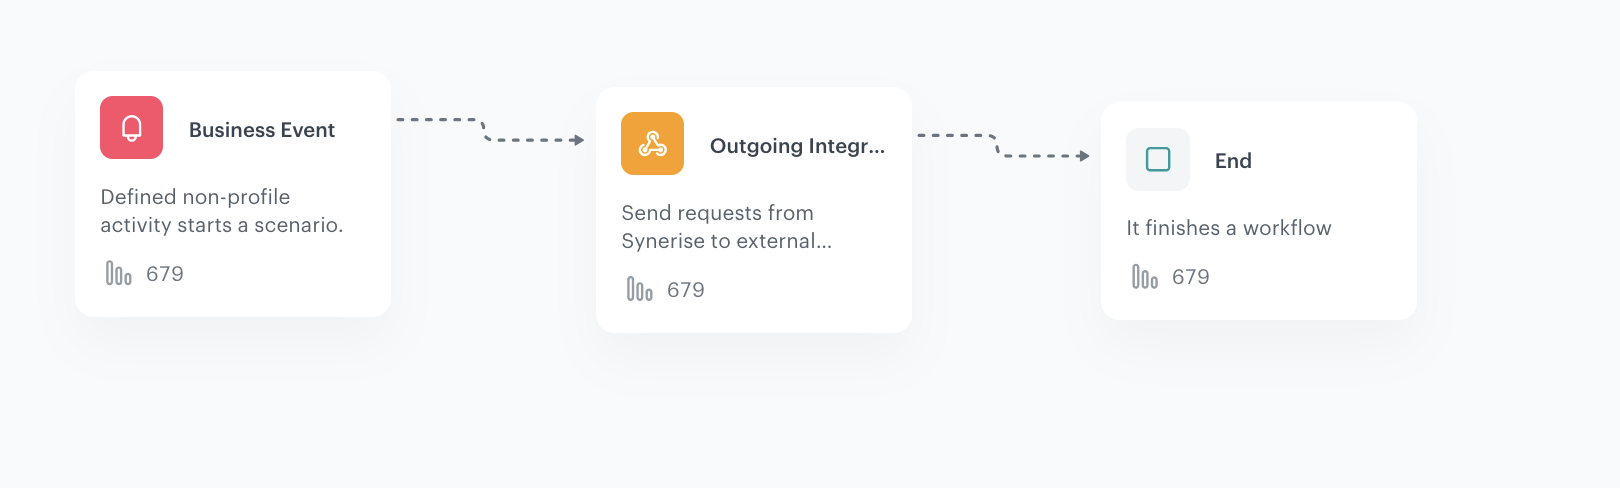
In this part of the process, you will build a workflow that triggers automatically each time new user data is received through the webhook. Make sure the email field is present and valid (in our case, it contains an `@` symbol). The workflow sends the email address through the Outgoing Integration node to the endpoint that creates or updates a user profile in Synerise.
1. Go to **Automation Hub > Workflows > New workflow**.
2. Enter the name of the workflow.
### Define the Business Event node
3. As the trigger, select **Business Event**. In the configuration of the node:
1. Select the [incoming integration for customer's data](#create-an-incoming-integration) you created as the first part of the process.
2. Add the condition which checks the email address is provided and correct:
1. From the **Add condition** dropdown list, select the **body.email**.
2. As the logical operator, select **Contains**.
3. In the text field, enter `@`
4. Confirm by clicking **Apply**.
Business Event node configuration
### Define the Outgoing Integration node
In this step, you’ll make an API call to create or update a Synerise profile using just the provided email address—no tracking needed. Call the endpoint that handles creating or updating user profiles in Synerise.
5. From the dropdown list, select the **Outgoing Integration** node.
6. Click the node. In the configuration of the node:
1. Select the **Custom webhook**.
2. Enter the name of the webhook.
3. Choose webhook connection type - select **By API key**.
You can read more about API keys [here](/docs/settings/tool/api) and you can find more information about the endpoint and required API key permissions [here](https://hub.synerise.com/api-reference/profile-management#operation/CreateAClientInCrm).
1. In the **Webhook name** field, enter the value that will be displayed in the `name` parameter of the event which will contain the request response.
2. Optionally, in the **Event name** field, choose an action name for the event that contains the request response from the endpoint.
If you leave the field blank, the action defaults to `webhook.response`.
3. Select the **POST** method.
3. In the URL address, enter `https://api.synerise.com/v4/clients/batch`.
Read more about the [Batch add ord update clients method](https://hub.synerise.com/api-reference/data-management#tag/Profile-management/operation/BatchAddOrUpdateClients)
4. Enter the following headers:
- set the `Content-Type` header to `application/json` (default),
- set the `Api-Version` header to `4.4`
5. Enter the request body. For the scenario described in this use case, the body is as follows:
This is just an example, you can create JSON according to your business needs.
6. Confirm by clicking **Apply**.
This operation is safe to repeat — if the profile exists (matched by email or ID), it will be updated; if not, a new one will be created.
### Add final setting to your workflow
---
1. Add the **End** node.
2. Launch the workflow by clicking **Save & Run**.
Final view of the workflow configuration
**Process logic:**
- For users who did not give consent to tracking – use the webhook + automation method described above.
- For users who gave tracking consent – submit form data as per usual.
For implementation details of form tracking, see the [documentation](/developers/web/tracking-form-data).
Learn more about the process from the [Do Not Track documentation](/developers/web/do-not-track).
## Generated events
This use case generates approximately 6 events per profile that completes the flow:
`incoming webhook event` (~1), [`automation.clientStartPath`](/docs/assets/events/event-reference/automation#automationclientstartpath) (~1), [`automation.clientPathStep`](/docs/assets/events/event-reference/automation#automationclientpathstep) (~1), [`automation.clientEndPath`](/docs/assets/events/event-reference/automation#automationclientendpath) (~1), [`webhook.response`](/docs/assets/events/event-reference/integration#webhookresponse-and-custom-webhook-response-names) (~1), [`client.add`](/docs/assets/events/event-reference/profiles#clientadd) (~1).
## Read more
---
- [Automation Hub](/docs/automation)
- [Business Event node](/docs/automation/triggers/businees-event-trigger)
- [Do Not Track documentation](/developers/web/do-not-track)
- [Incoming integration](/docs/automation/integration/incoming-webhook-node)
- [Outgoing Integration](/docs/automation/actions/webhook-node)
- [Outgoing integration node](/docs/automation/actions/webhook-node)
# Send a message encouraging replenishment on WhatsApp
WhatsApp is a trusted platform by millions of users worldwide, making it a valuable channel for customer communication. It's a channel where you can get closer to your customers by forming personalized communication with them, building a stronger bond with your brand, and increasing loyalty. Thanks to Synerise's integration with WhatsApp, you have unlimited possibilities to customize your communication with customers. You can take advantage of all the insights you collect in Synerise and use them effectively to deliver the greatest value to your customers.
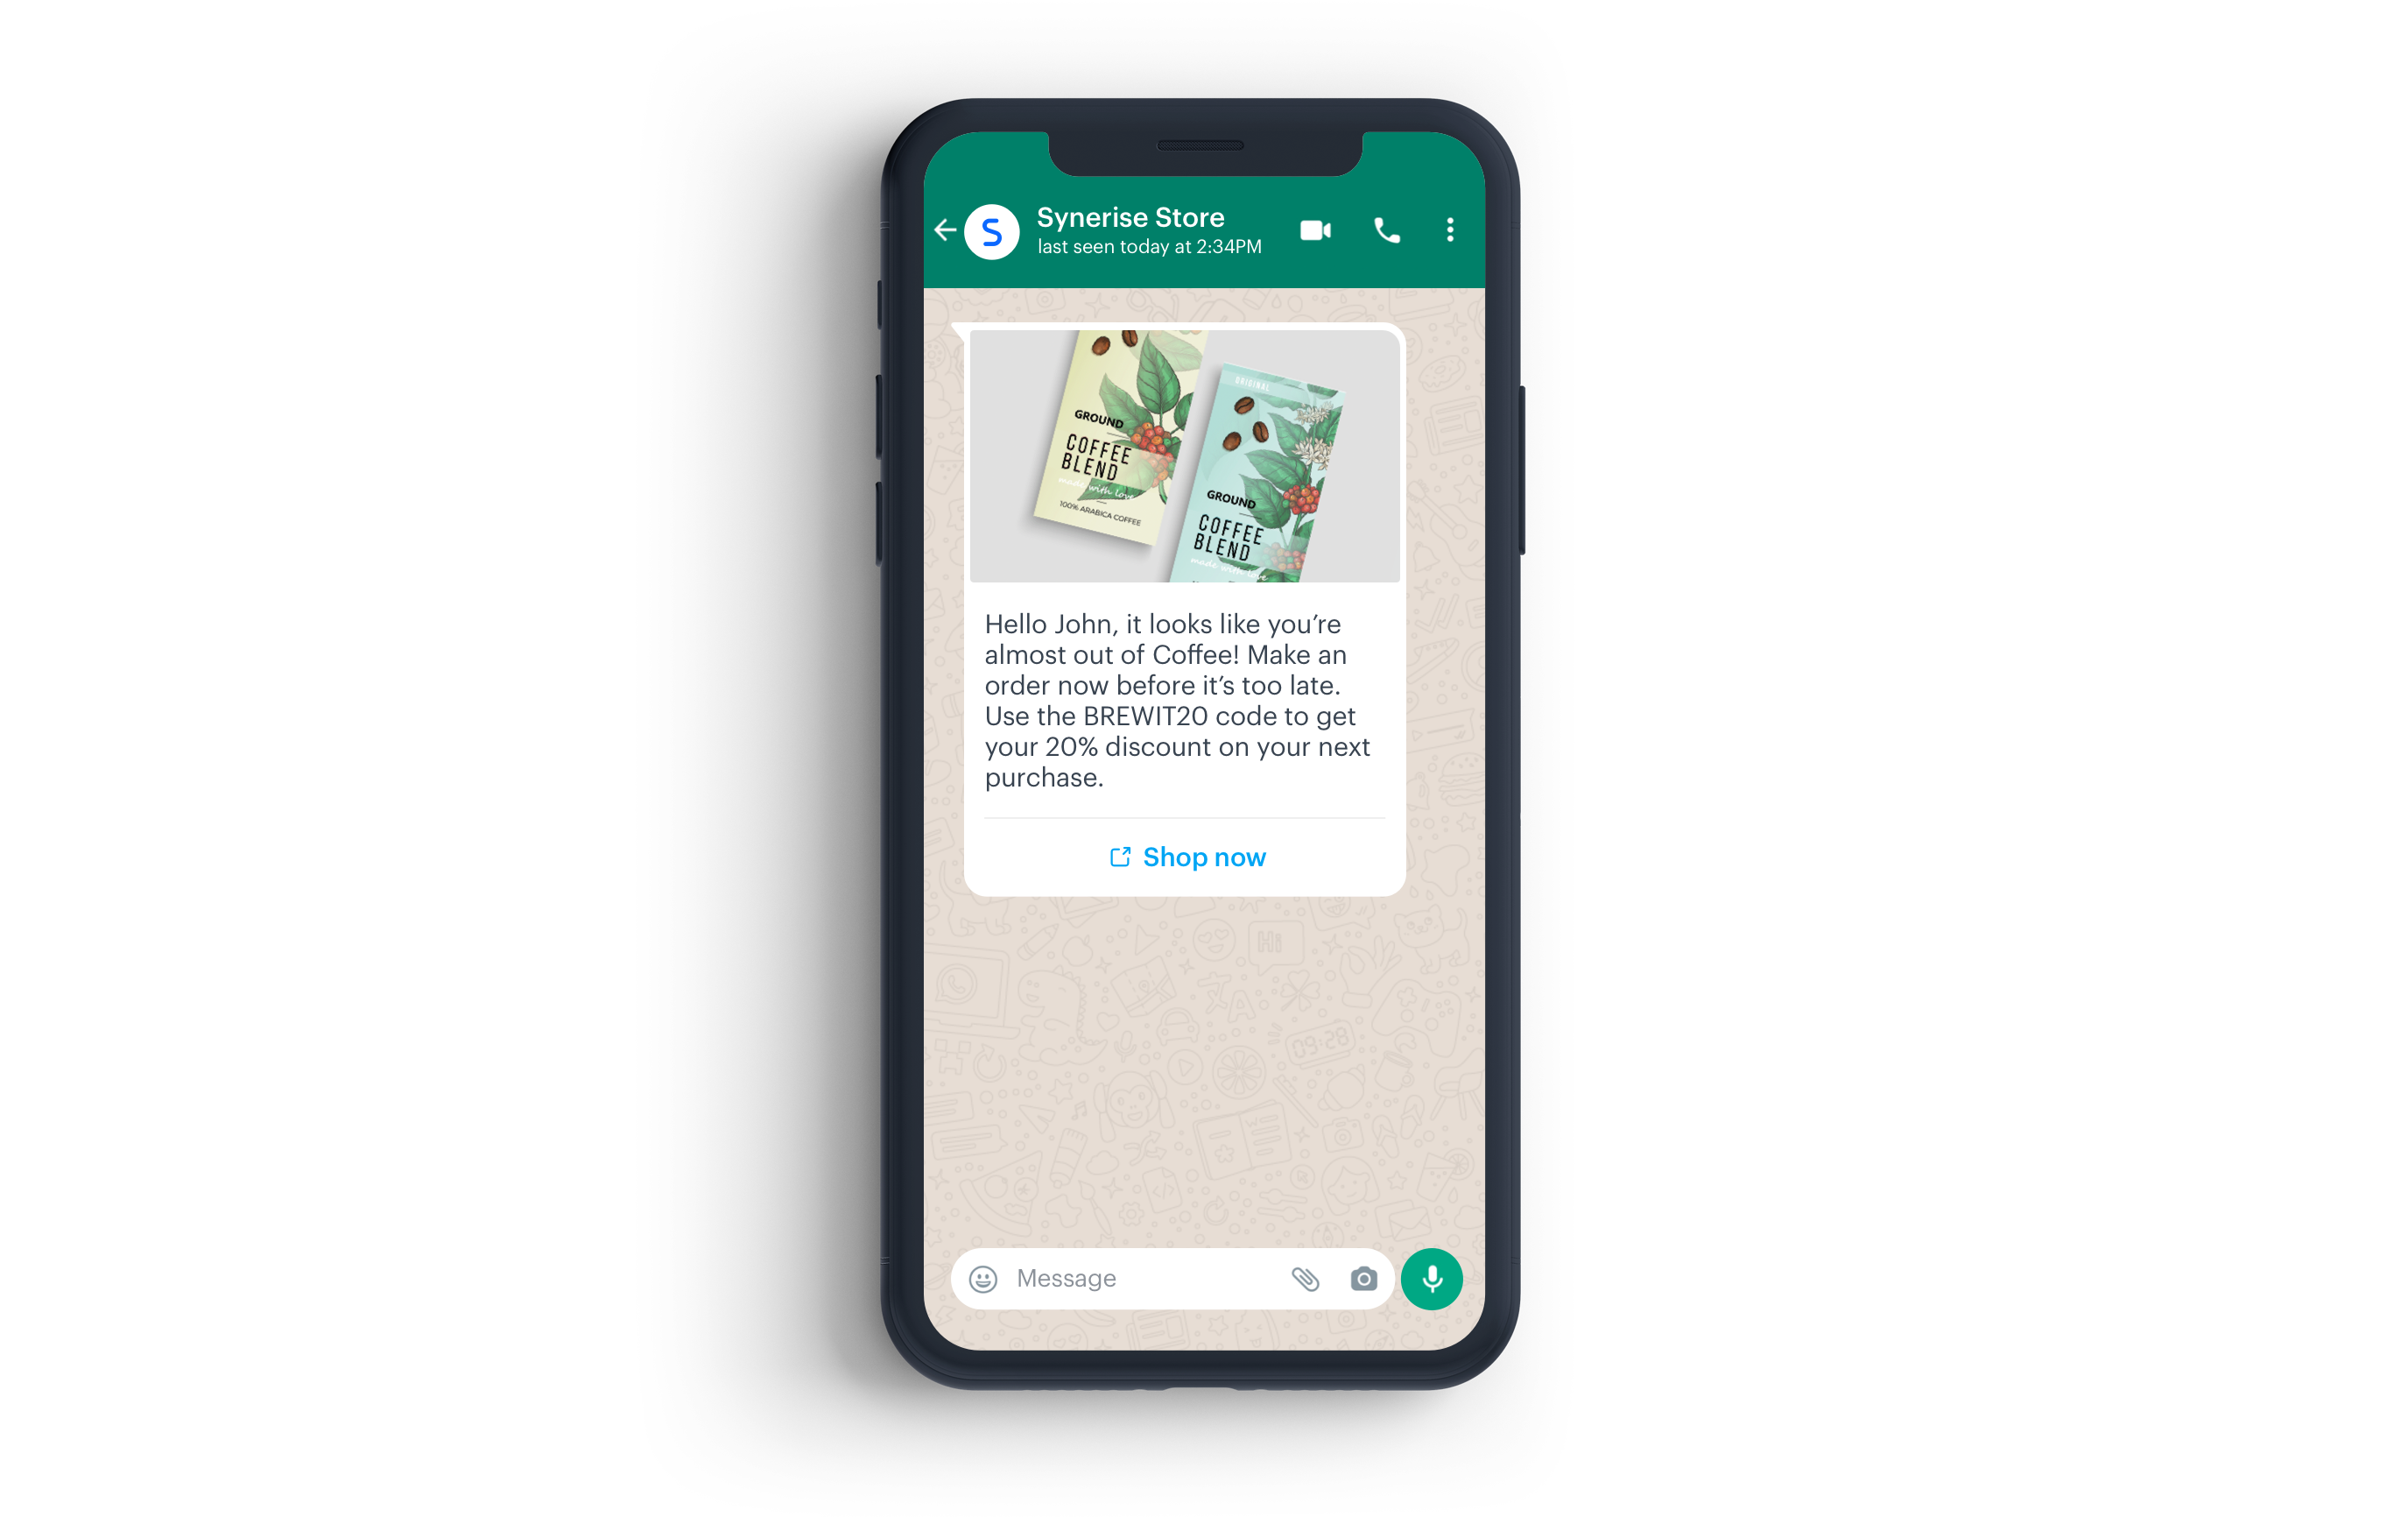
This use case shows a scenario with a replenishment campaign. You will learn how to perform a simple integration with WhatsApp to send a personalized message to customers encouraging them to reorder a product from a specific category, additionally incentivizing the reorder by giving them a discount code for that purchase.
## Prerequisites
---
- Make sure you meet all [prerequisites](/docs/automation/integration/whats-app/send-template-message#prerequisites) to work with the **Send Template Message** node.
- Implement transaction events either through [SDK](/developers/web/transactions-sdk) or [API](https://hub.synerise.com/api-reference/data-management#operation/CreateATransaction).
- Create [item feed](/docs/ai-hub/recommendations-v2/item-feed-requirements)
- Create a [voucher pool](/docs/assets/code-pools). The ID of this voucher pool will be used as a dynamic value during the message creation process, allowing discount codes to be assigned to each customer participating in this scenario.
## Process
---
1. [Create an aggregate](/use-cases/send-replenishment-message-on-whats-app#create-an-aggregate) which returns the SKU of the last purchased product from the specified category.
2. [Create a message template in the Meta portal](/use-cases/send-replenishment-message-on-whats-app#create-a-message-template-in-the-meta-portal)
3. [Create a workflow to send a message to customers on WhatsApp](/use-cases/send-replenishment-message-on-whats-app#create-a-workflow-to-send-message-to-customers-on-whatsapp)
## Create an aggregate
---
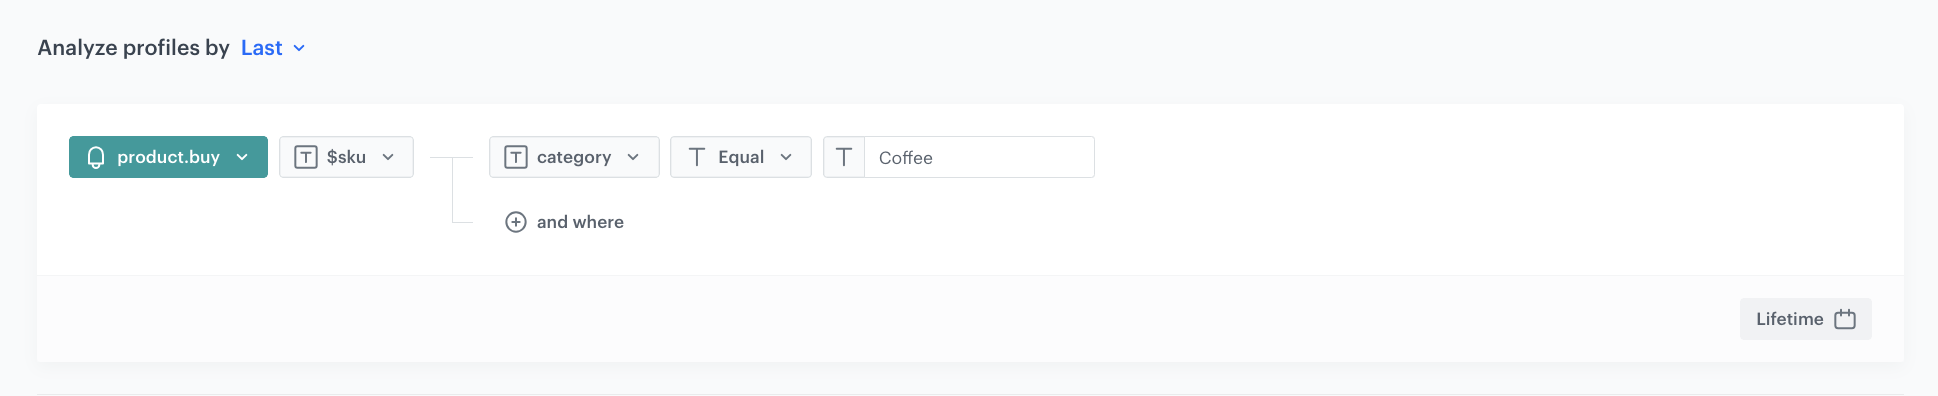
In this part of the process, create an aggregate that returns the SKU of the last purchased product from the `Coffee` category.
1. Go to **Behavioral Data Hub > Live Aggregates > Create aggregate**.
2. As the aggregate type, select **Profile**.
2. Enter the name of the aggregate.
3. Click **Analyze profiles by** and select **Last**.
4. From the **Choose event** dropdown list, select the `product.buy` event.
4. As the event parameter, select **$sku**.
5. Next to the **$sku**, click **+where**.
6. From the dropdown list, select **$category**.
7. As the operator, choose **Equal**.
9. In the text field, enter the value of the category you want to use in replenishment campaign - in this use case, it will be `Coffee`.
8. Define the period analyzed in the aggregate.
9. Save the aggregate.
Configuration of the aggregate
## Create a message template in the Meta portal
---
Create a message template in the Meta portal that you will use in the next part of the process. In the body of the message, mark places where the dynamic elements will be added.
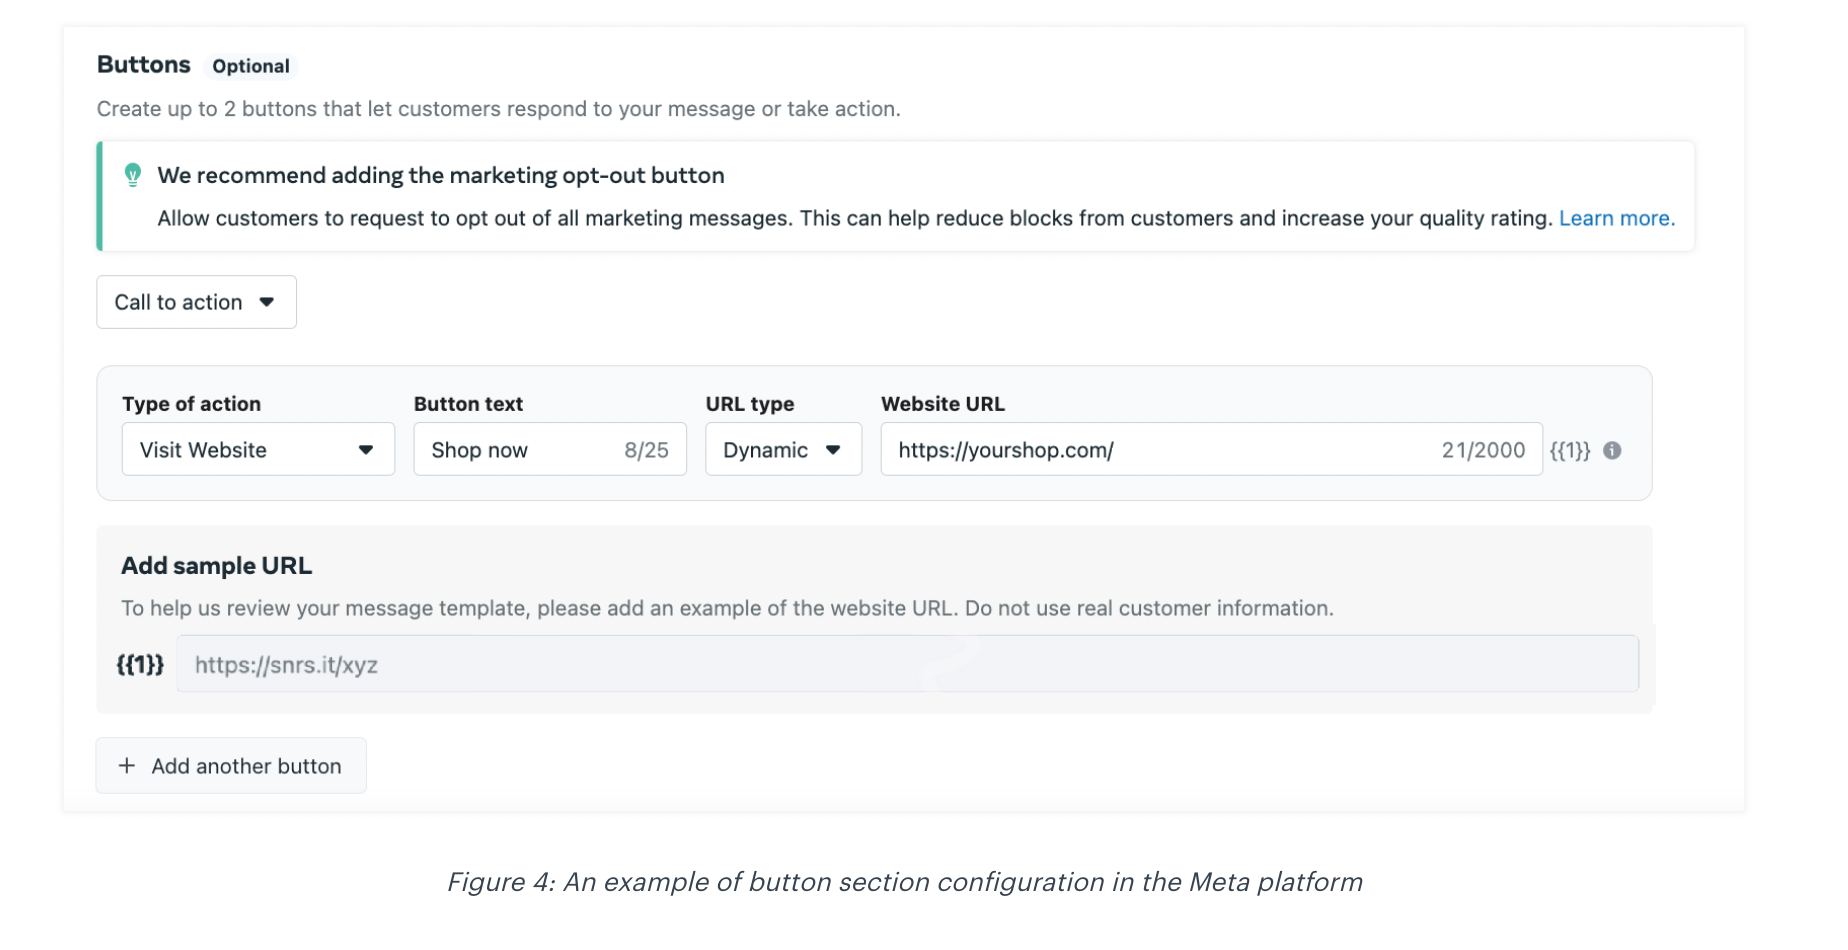
In addition, if you would like to add a CTA at the end of the message, you can add a button and define its copy. The page to which the customer will be redirected after clicking the button can be defined in Synerise.
The example message used in this use case:
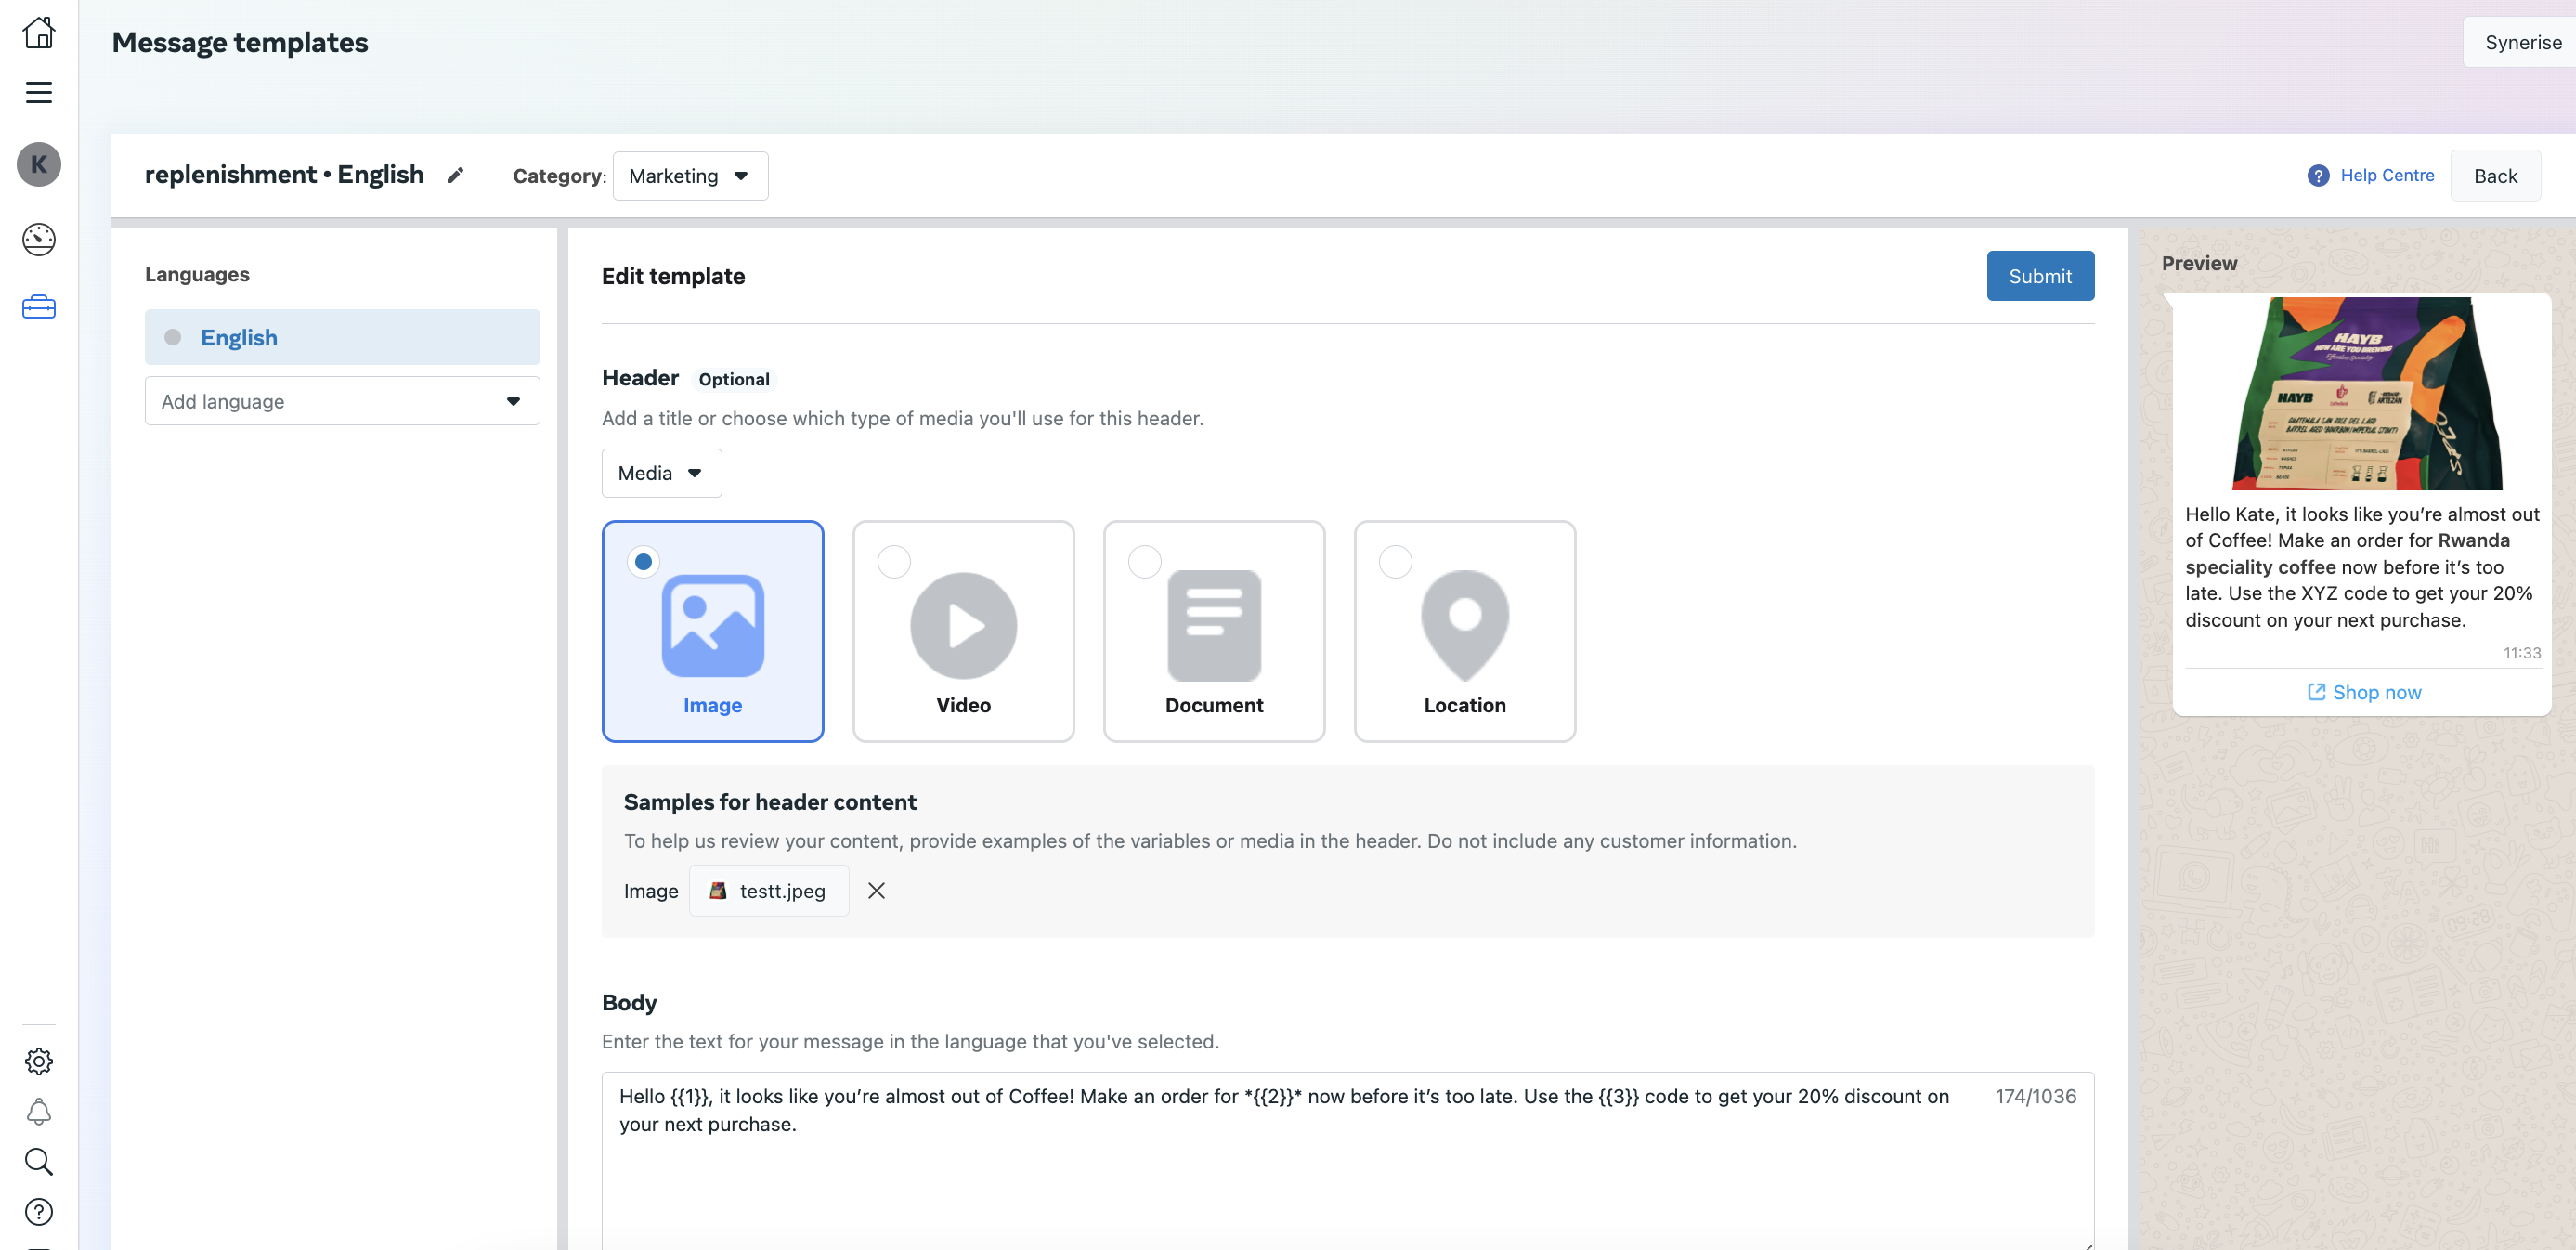
`Hello {{1}}, it looks like you’re almost out of Coffee! Make an order for {{2}} now before it’s too late. Use the {{3}} code to get your 20% discount on your next purchase.`
Where `{{1}}, {{2}}` and `{{3}}` are markers that will be replaced with the dynamic values. This step will be done in Synerise.
The screen below shows an example of creating a template message in the Meta portal:
An example of body section configuration in Meta platform
In the following screen, you can see how a button can be defined in the Meta portal:
An example of button section configuration in Meta platform
## Create a workflow to send message to customers on WhatsApp
---
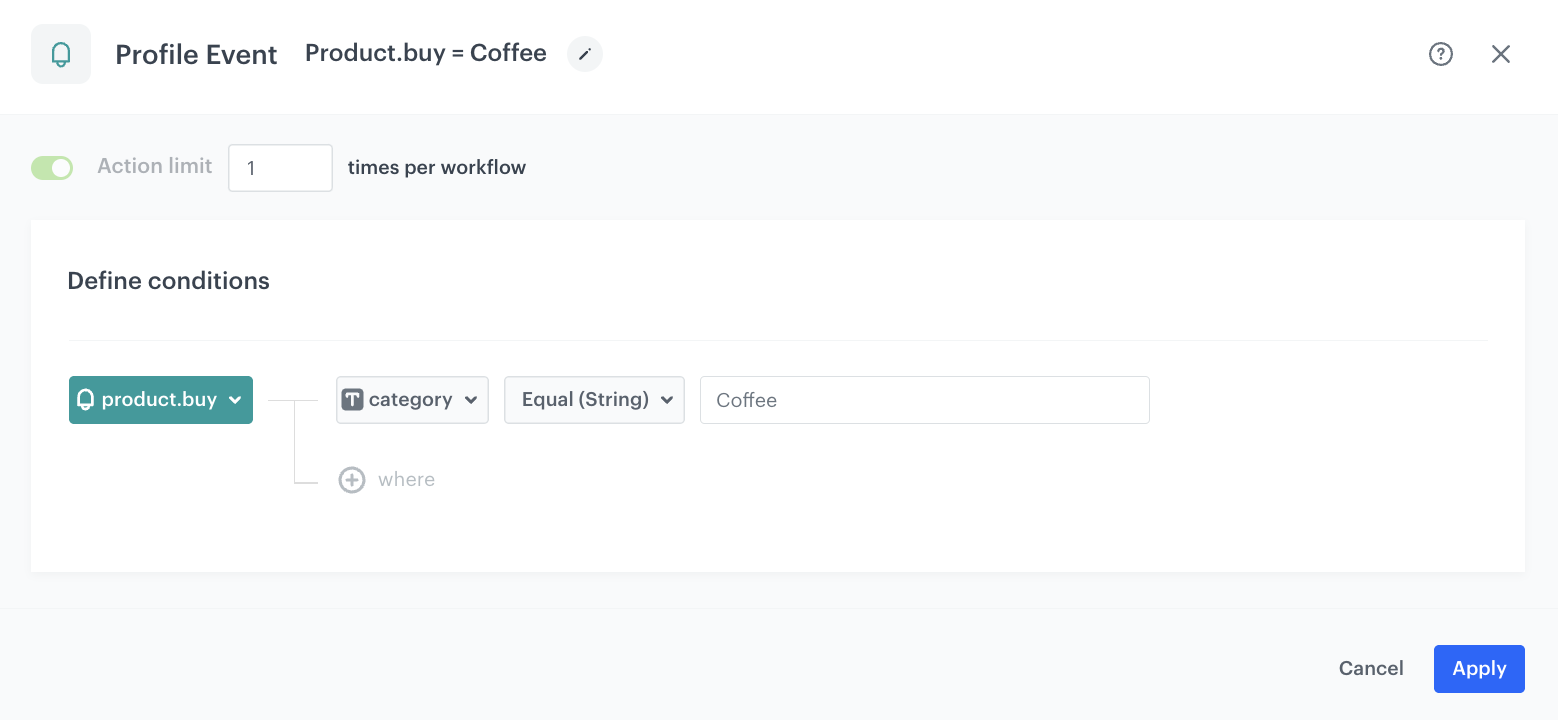
The workflow will be triggered by the `product.buy` event from the selected product category. The delay is defined up to 30 days. If a customer does not make another purchase from the defined category after that period, we will send a WhatsApp message with the recommended products from the defined category.
1. In Synerise, go to **Automation Hub > Workflows > New workflow**.
2. Enter the name of the workflow.
### Define the trigger node
3. As the trigger node, add **Profile Event**. In the configuration of the node, select the event that triggers the workflow. In this use case, it's a `product.buy` event.
4. Click **+ where** and choose **$category**.
5. As the logical operator, select **Equal**.
6. In the text field, enter `Coffee`.
4. Confirm by clicking **Apply**.
Configuration of the Profile Event node
### Configure the Delay node
1. Add the **Delay** node. In the node settings:
1. In the **Delay** field, type `30`.
2. From the dropdown list, choose **Day**.
2. Click **Apply**.
### Define the profile filter node
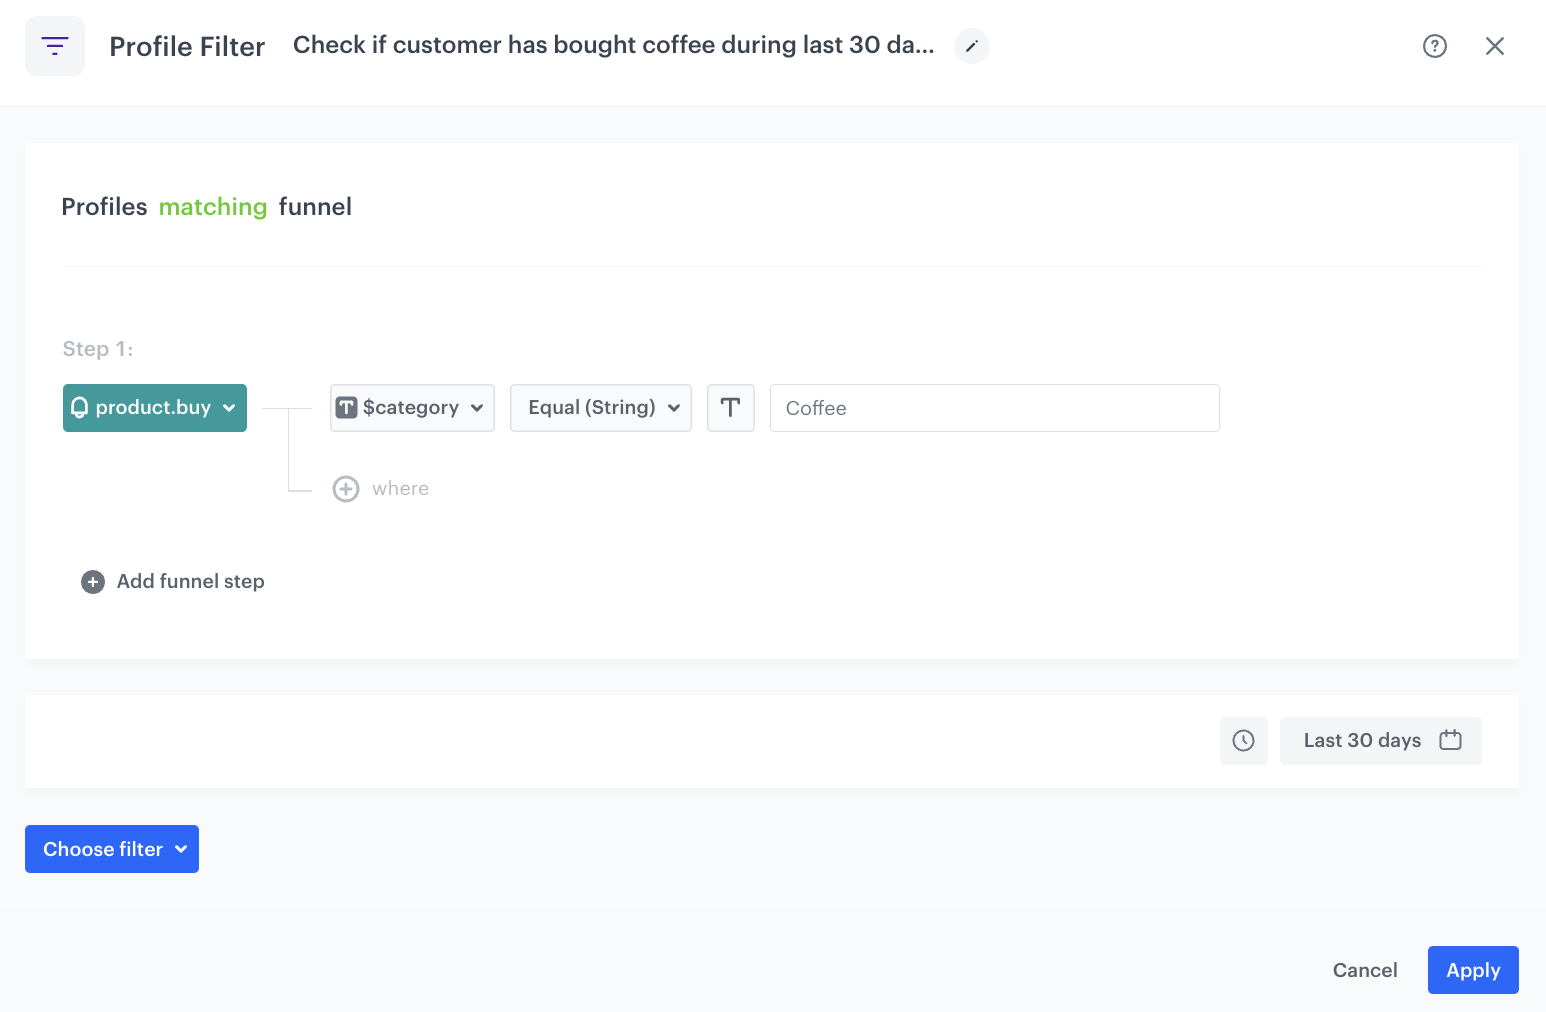
As the next node, choose **Profile Filter** to check if customers have bought a product from the Coffee category during last 30 days. To do this:
1. Choose the `product.buy` event.
2. As the parameter, choose **$category**.
5. As the logical operator, select **Equal**.
6. In the text field, enter `Coffee`.
3. Set the time range to last 30 days.
4. Click **Apply**.
7. To the **Matched** path, add the **End** node.
Configuration of the Profile Filter node
### Define the Send Template Mesage node
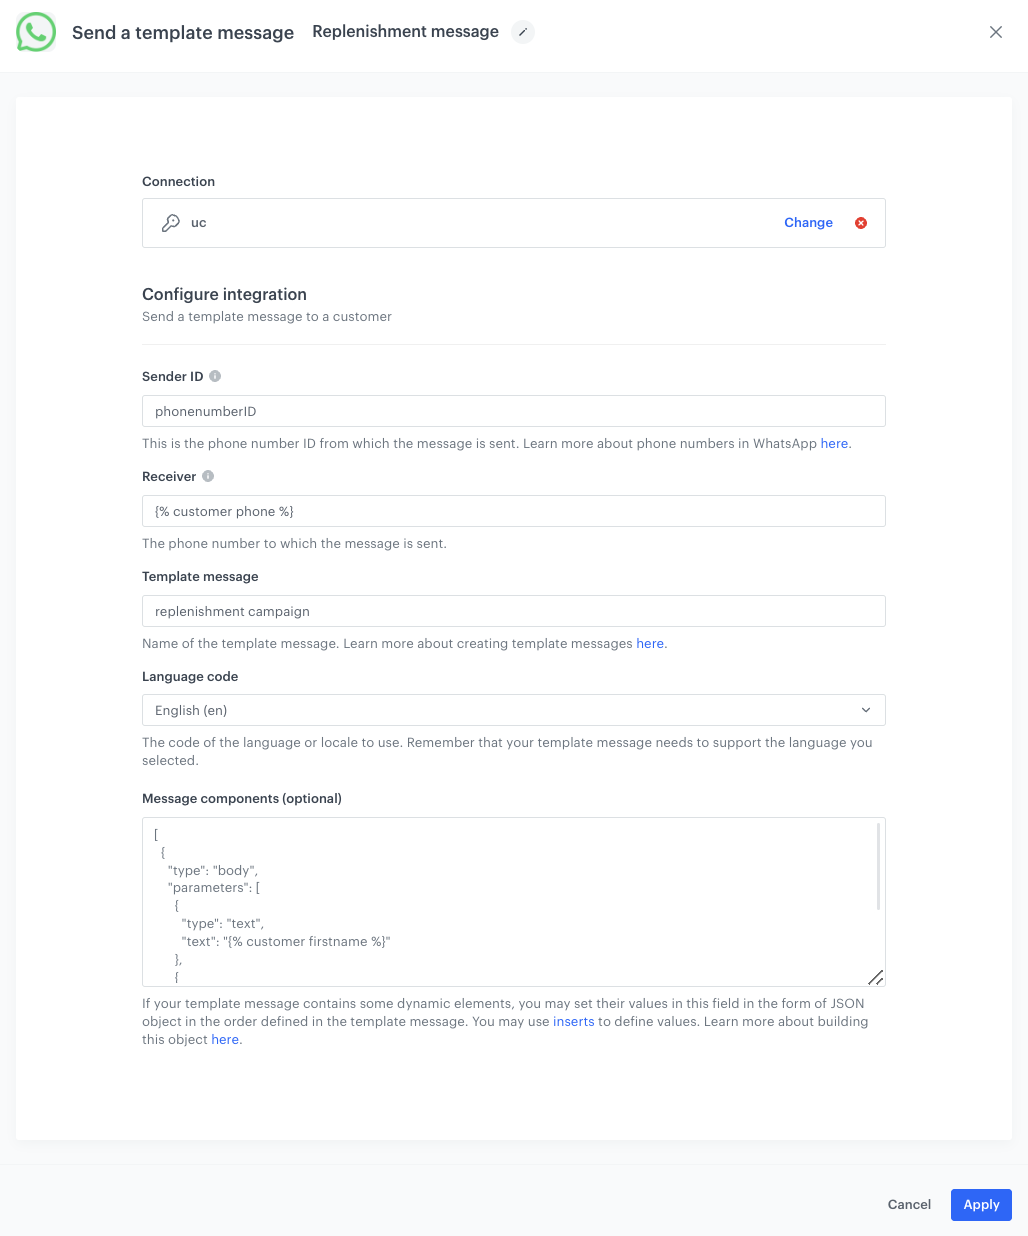
8. To the **Not matched** path, add the WhatsApp **Send Template Message** node.
1. Click **Select connection**.
2. From the dropdown list, select the connection.
- If no connections are available or you want to create a new one, see [Create a connection](/docs/automation/integration/whats-app/send-template-message#create-a-connection).
- If you selected an existing connection, proceed to defining the integration settings.
3. In the **Sender ID** field, enter the phone number ID from which the message will be sent.
[You can find more information about phone number ID here](https://developers.facebook.com/docs/whatsapp/cloud-api/get-started/add-a-phone-number).
4. In the **Receiver** field, enter the phone number of the customer who will receive this message.
We recommend using the `{% customer phone %}` insert, which inserts the phone number of an individual customer who goes through this node.
5. In the **Message template** field, enter the name of the [message template](/use-cases/send-replenishment-message-on-whats-app#create-a-message-template-in-the-meta-portal) you created earlier in the Meta portal.
6. From the **Language code** dropdown list, select the language used in the message.
7. In the **Message components** field, insert the object that contains the dynamic values in the order defined in the message template.
The example of object used in this use case:
The aggregate and voucher pool IDs are used as examples for the purpose of this use case.
9. Click **Apply**.
The following table explains all the inserts used in the body, button and header sections shown above.
| Section | Insert value | Insert explanation |
|---------|--------------------------------------------------------------------------------------------------------------------------------------------------------------------------------------------------------------------------------------|--------------------------------------------------------------------------------------------------------------------------------------------------------------------------------------------------------------------------------------------------------------------------------------------------------------------------|
| body | `{% customer firstname %}` | The value of this insert is used as the value of `{{1}}`, so the name of a customer can be displayed in the message. |
| body | `{% aggregate c37acfe7-08a1-345c-a3e7-da795bb6a326 %} {% for item in aggregate_result %} {% catalog.store-1(item).name %} {% endfor %} {% endaggregate %}` | The value of this insert is used as the value of `{{2}}` to return a product that the customer bought the last time and did not purchase again within the estimated time period. |
| body | `{% voucher %} 8c3c8fd3-e7e9-487d-ba89-0b7824f65f33 {% endvoucher %}` | The value of this insert is used as the value of `{{3}}`. In this example, we assign a voucher code from the voucher pool to an individual customer. |
| button | `{% aggregate c37acfe7-08a1-345c-a3e7-da795bb6a326 %}{% for item in aggregate_result %}{% catalogvar.store-1(item).url %}{{ catalog_result\|replace('https://yourshop.com', '') }}{% endcatalogvar %}{% endfor %}{% endaggregate %}` | The value of this insert is used to return product url. Here we specify the URL omitting the domain, because we define the domain in the Meta platform, as you can see in the screenshot with the [button creation](/use-cases/send-replenishment-message-on-whats-app#create-a-message-template-in-the-meta-portal). |
| header | `{% aggregate c37acfe7-08a1-345c-a3e7-da795bb6a326 %}{% for item in aggregate_result %}{% catalogvar.store-1(item).image %}{{ catalog_result }}{% endcatalogvar %}{% endfor %}{% endaggregate %}` | This value of insert is used to return the url to the product image in header. |
Workflow configuration
## Check the use case set up on the Synerise Demo workspace
---
You can check the configuration of the [aggregate](https://app.synerise.com/analytics/aggregates/c37acfe7-08a1-345c-a3e7-da795bb6a326) and the [workflow](https://app.synerise.com/automations/automation-diagram/998f1dc1-932d-4636-bb98-d1d823b00af6) directly in our Synerise Demo workspace.
If you’re our partner or client, you already have automatic access to the **Synerise Demo workspace (1590)**, where you can explore all the configured elements of this use case and copy them to your workspace.
If you’re not a partner or client yet, we encourage you to fill out the contact [form](https://demo.synerise.com/request) to schedule a meeting with our representatives. They’ll be happy to show you how our demo works and discuss how you can apply this use case in your business.
## Generated events
This use case generates approximately 8 events per profile that completes the flow:
[`product.buy`](/docs/assets/events/event-reference/items#productbuy) (~1), [`automation.clientStartPath`](/docs/assets/events/event-reference/automation#automationclientstartpath) (~1), [`automation.clientPathStep`](/docs/assets/events/event-reference/automation#automationclientpathstep) (~3), [`automation.clientEndPath`](/docs/assets/events/event-reference/automation#automationclientendpath) (~1), [`voucherCode.assigned`](/docs/assets/events/event-reference/loyalty#vouchercodeassigned) (~1), [`whatsapp.sendTemplateMessage`](/docs/assets/events/event-reference/integration#whatsappsendtemplatemessage) (~1).
## Read more
---
- [Aggregates](/docs/crm/aggregates)
- [Automation Hub](/docs/automation)
- [Jinjava inserts](/developers/inserts)
- [Recommendations](/docs/ai-hub/recommendations-v2)
- [WhatsApp **Send Template Message** node](/docs/automation/integration/whats-app/send-template-message)
# Dynamic SMS campaign with promotion at customer's preferred stationary store
You can use SMS channel to effectively inform your customers about upcoming or ongoing promotions both in online or brick-and-mortar stores. The key to the success of these campaigns is personalization.
Imagine you have a large customer base and you want to notify them about an exciting promotion in specific stores. Instead of creating multiple campaigns for each store, you can achieve this with just one campaign using Synerise. With Jinjava, you can effortlessly customize your message content. You can dynamically change store names, locations, and other crucial details with a simple Jinjava code. This means less work for you and more personalized experience for your customers.
This use case describes a scenario that begins by explaining how to assign IDS of customers' top-choice stores as attributes to their profiles. The further part of the process outlines how to create a dynamic SMS campaign targeting customers from the selected stores.
Additional assumptions used in this use case:
- The promotion is created on the client side,
- The created catalog contains only those stores where the promotion is implemented,
- Information about the current promotion is sent to users who have assigned a store ID to their profile.
## Prerequisites
---
- Permissions that allow access to Catalogs section and adding new catalogs.
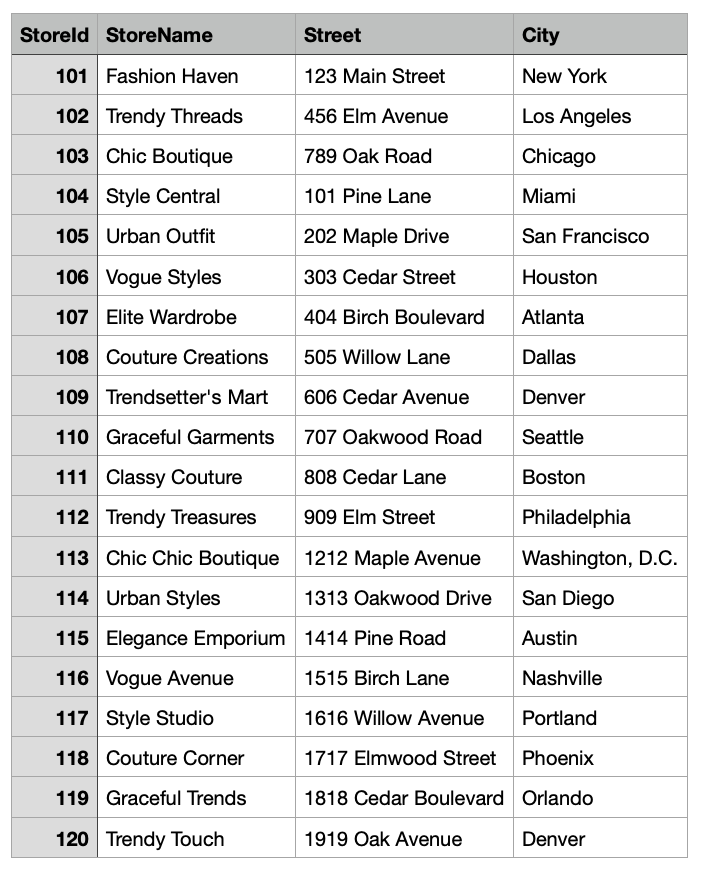
- Prepare a CSV file with the stores where the promotion you are creating a campaign for will be available.
The file used in this use case contains the following columns: `StoreId`, `StoreName`, `Street`, `City`.
Example file
Sample file
- Implement the [transaction events](/developers/web/transactions-sdk) using [SDK](/developers/web/transactions-sdk) or [API](https://hub.synerise.com/api-reference/data-management#operation/CreateATransaction). Implement a custom parameter to the event that refers to the store where the transaction occurred. In this case, we will use the `StoreId` parameter.
- Meet all requirements listed in the [introduction to SMS](/docs/campaign/SMS/introduction-to-sms#requirements).
- Promotion must be implemented on the client side.
## Process
---
1. [Create an aggregate](/use-cases/dynamic-sms-campaign#create-an-aggregate) that identifies the top store for customers based on their transactions.
2. [Create a workflow](/use-cases/dynamic-sms-campaign#create-a-workflow-that-assigns-a-store-id-to-customer-profile) that assigns a store ID to customer profile.
3. [Create a catalog](/use-cases/dynamic-sms-campaign#create-a-catalog) with the store details.
4. [Prepare an SMS message template](/use-cases/dynamic-sms-campaign#prepare-an-sms-message-template).
5. [Create a workflow for the SMS campaign](/use-cases/dynamic-sms-campaign#create-a-workflow-for-the-sms-campaign).
## Create an aggregate
---
Create an aggregate to find the top store for customer based on transaction history.
1. Go to **Behavioral Data Hub > Live Aggregates > Create aggregate**.
2. As the aggregate type, select **Profile**.
2. Enter the name of the aggregate.
3. Click **Analyze profiles by** and select **Top**.
4. From the **Choose event** dropdown list, select the **transaction.charge** event.
5. As the event parameter, select **StoreId**.
6. Using the date picker in the lower-right corner, set the time range to **Lifetime**. Confirm your choice with the **Apply** button.
7. Click **Save**.
Final configuration of the aggregate
## Create a workflow that assigns a store ID to customer profile
---
Create a workflow that assigns a **StoreId** attribute to customers who do not have this attribute yet and update it for the customers who have switched to another store over time.
1. Go to **Automation Hub > Workflows > New workflow**.
2. Enter the name of the workflow.
### Define the trigger node
---
1. Add the **Profile Event** node.
2. From the **Choose event** dropdown list, select the **transaction.charge** event.
3. Click **Apply**.
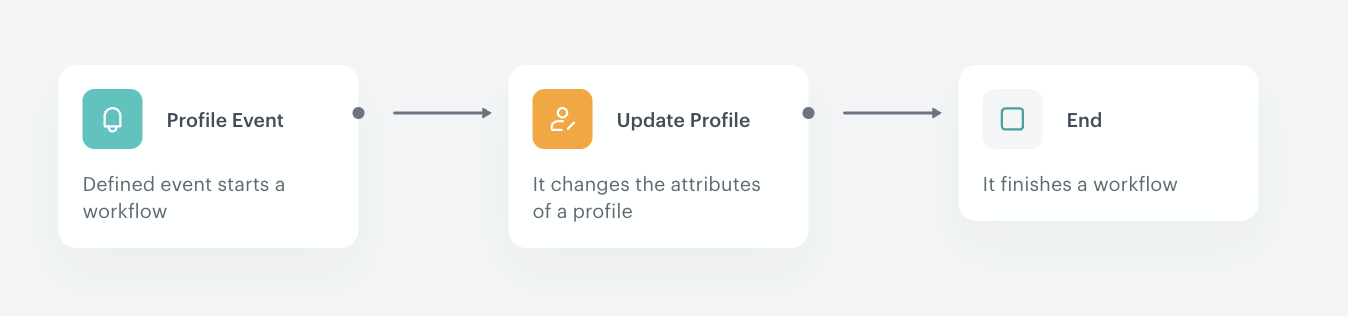
### Define the Update Profile node
---
In this part of the process, you will add an attribute **StoreId** to the customers who do not have this attribute yet and update it for the customers who have switched to another store over time.
1. Add the **Update Profile** node.
2. From the left dropdown list, select **Attributes > StoreId**.
3. From the right dropdown list, select **Change**.
4. In the text field, add a Jinjava with the ID of the aggregate [created earlier](/use-cases/dynamic-sms-campaign#create-an-aggregate). This Jinjava will return the top StoreId for the individual customer.
Jinjava used in the use case:
The above Jinjava contains the ID of the aggregate created in this use case. Make sure to replace this ID with the ID of your aggregate.
5. Click **Apply**.
### Add the final node
---
1. Add the **End** node.
3. Save and activate the automation by clicking **Save&Run**.
Final configuration of the workflow
## Create a catalog
---
In this part of the process, create a catalog and import there your CSV file you prepared as a part of prerequisites.
1. Go to **Data Modeling Hub > Catalogs > New Catalog**.
2. Enter the name of the catalog and confirm it by clicking **Apply**.
Don't use diacritical letters and spaces.
3. Click the catalog on the list and click **Import Local File**.
If you prepared a CSV file in Excel, open it in a text editor to check whether commas are used as separators. If not, replace them with commas.
4. Click the **Upload a new file** button and select the file to be uploaded, then click the **Next** button.
5. You will see the information that your file has been successfully uploaded. To continue the import process, click the **Next** button.
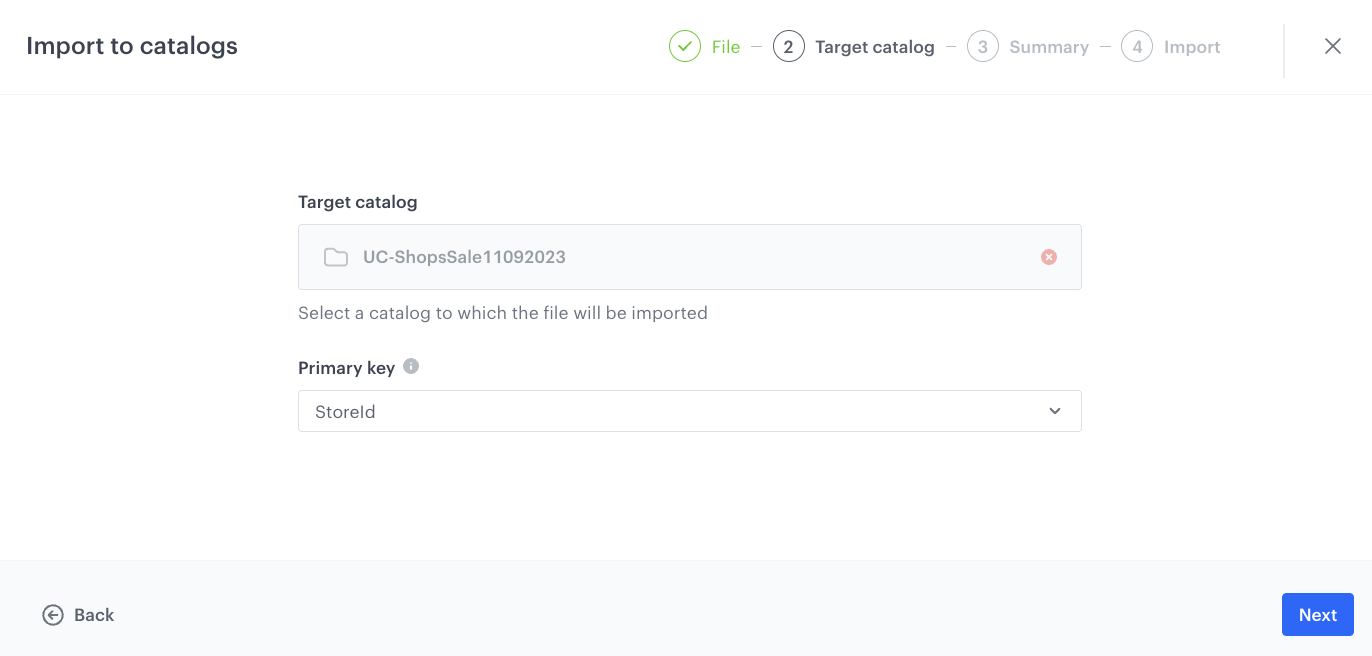
6. In the **Primary key** field, type the name of the column whose values are treated as the key. In this case, it will be `StoreId`. To continue the process, click the **Next** button .
Catalog primary key configuration
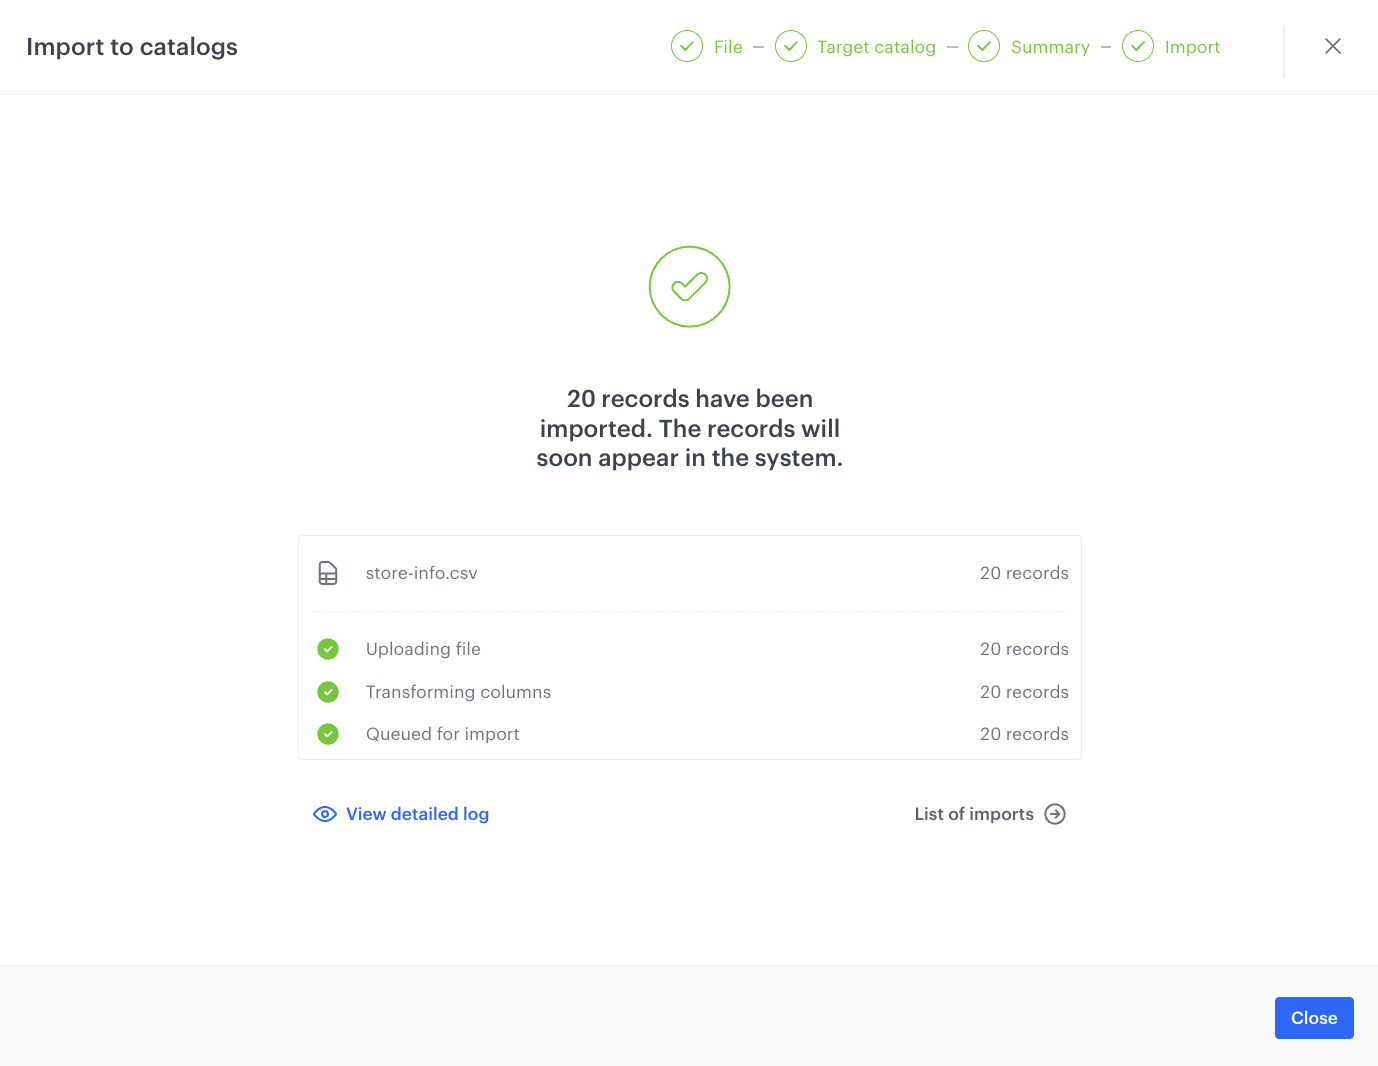
7. In the next screen you will find the summary of your import. If no changes are needed, click **Run import** button.
Import success
## Prepare an SMS message template
---
Create a dynamic SMS template using Jinjava that customizes the store details for each customer.
1. Go to **Experience Hub > SMS**.
2. In the menu on the left, click **Templates**.
3. Click **Create new**.
4. Click **Text editor**.
The text editor and SMS preview open.
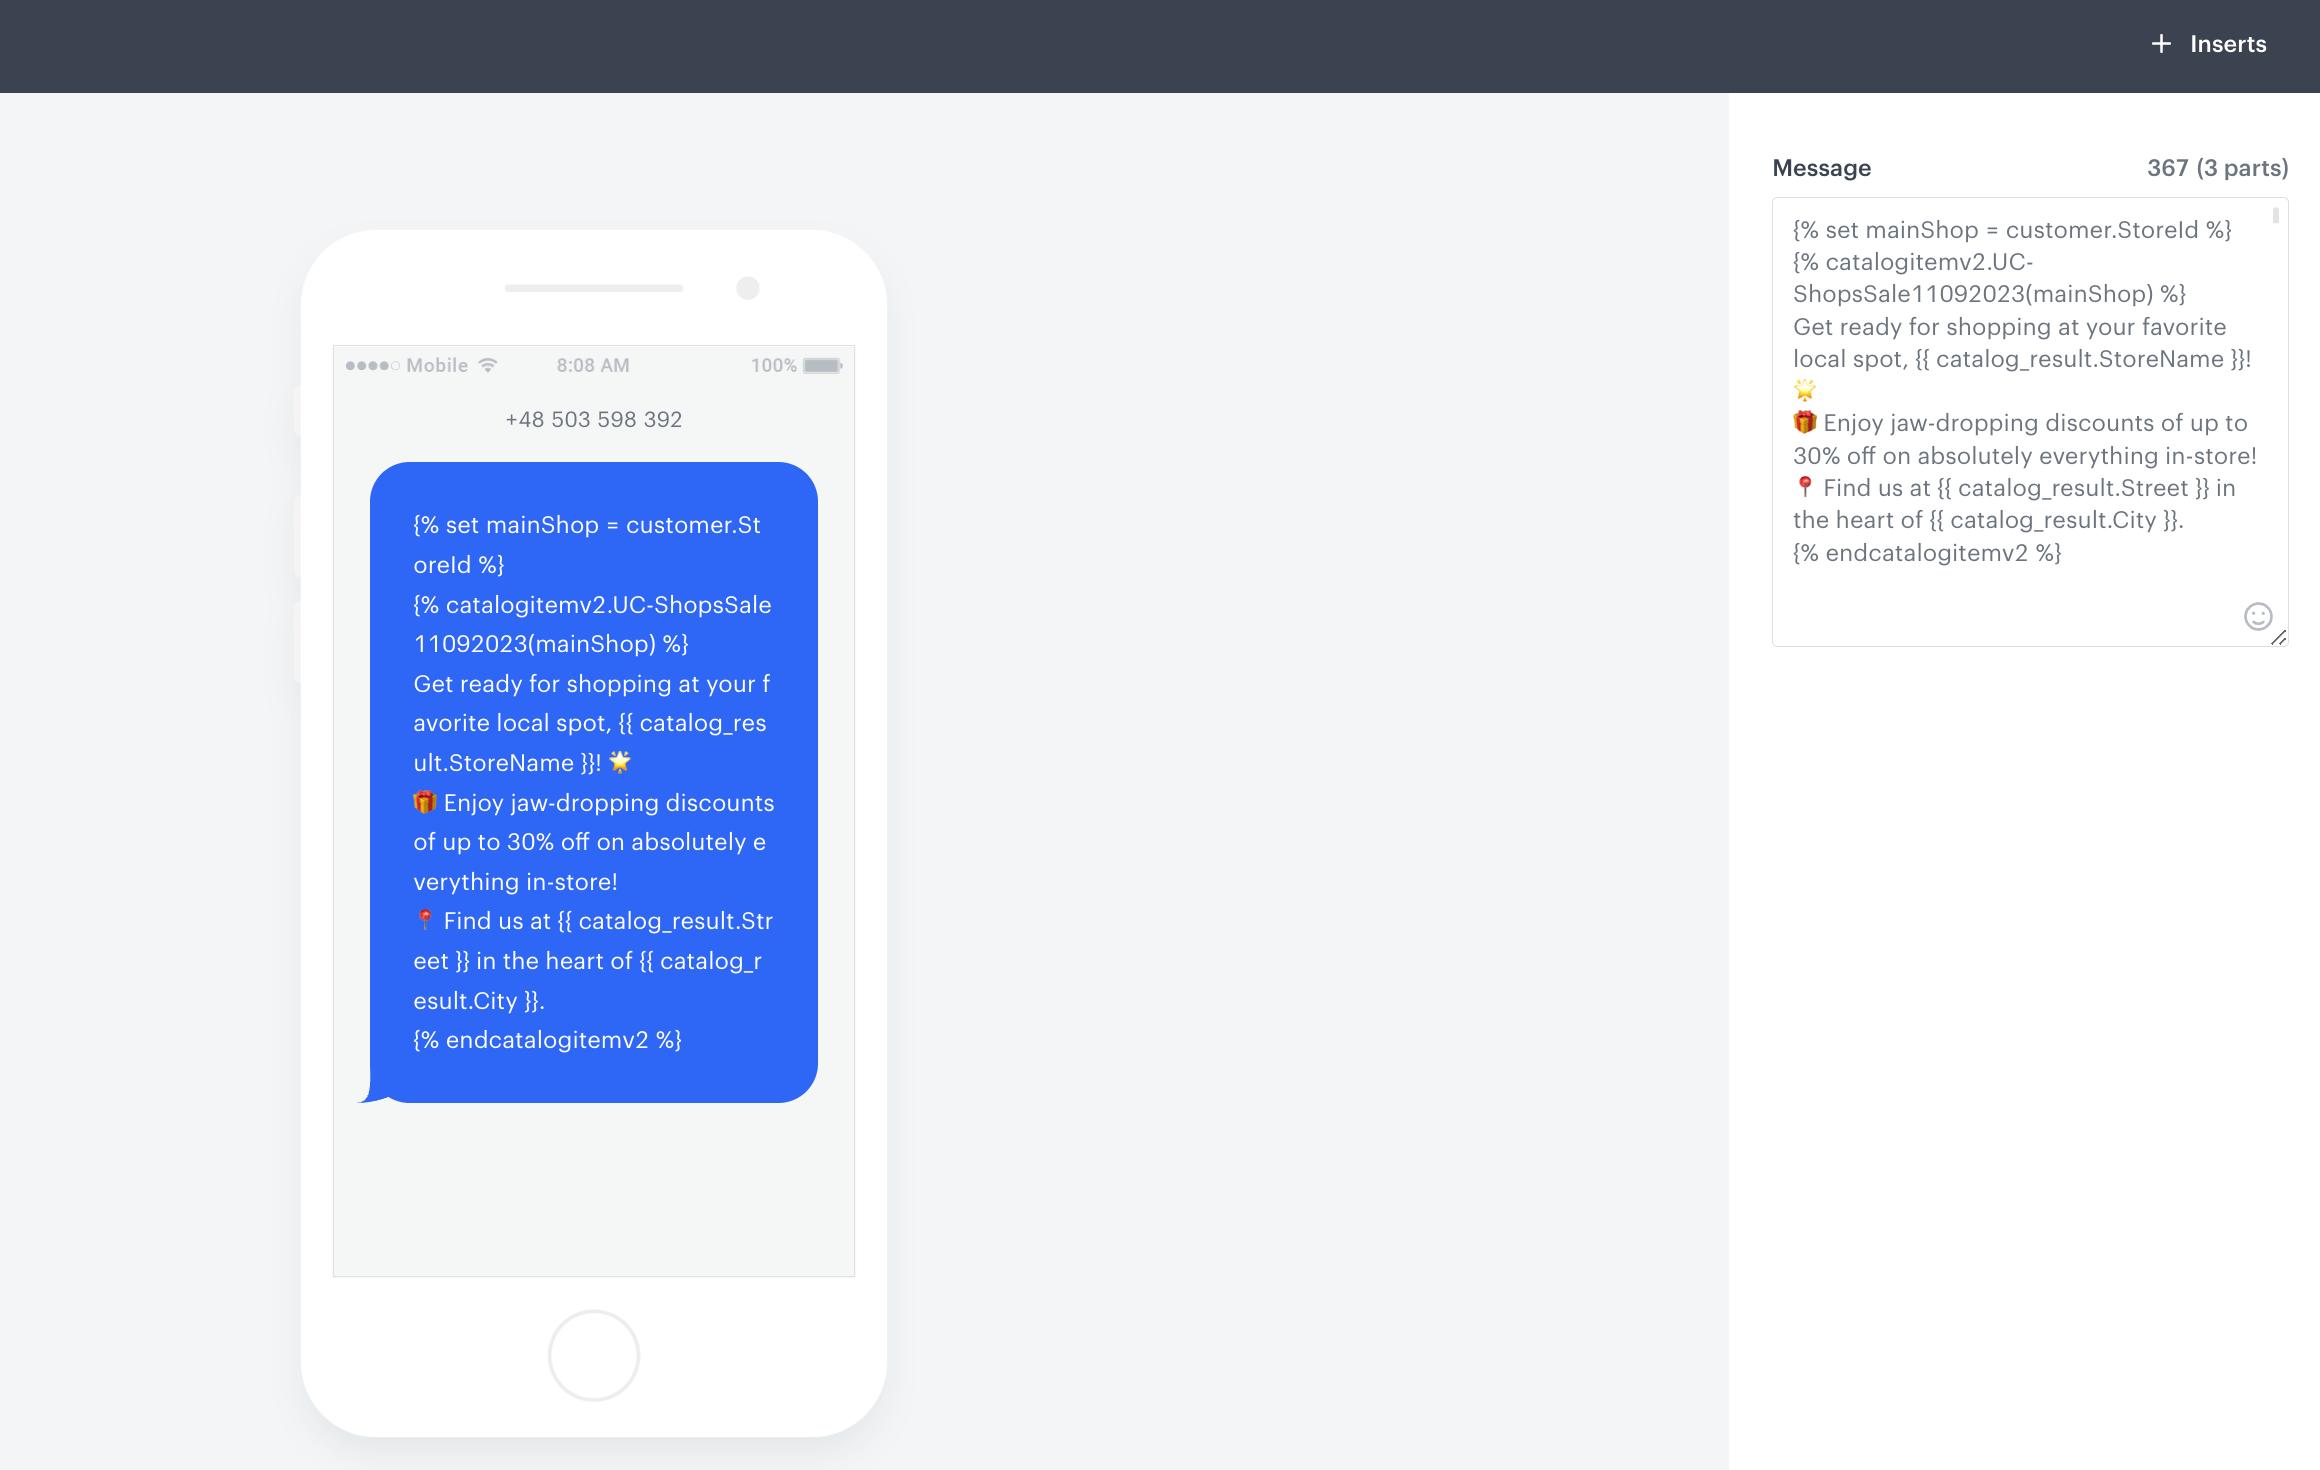
5. In the text box on the right, enter the contents of your message.
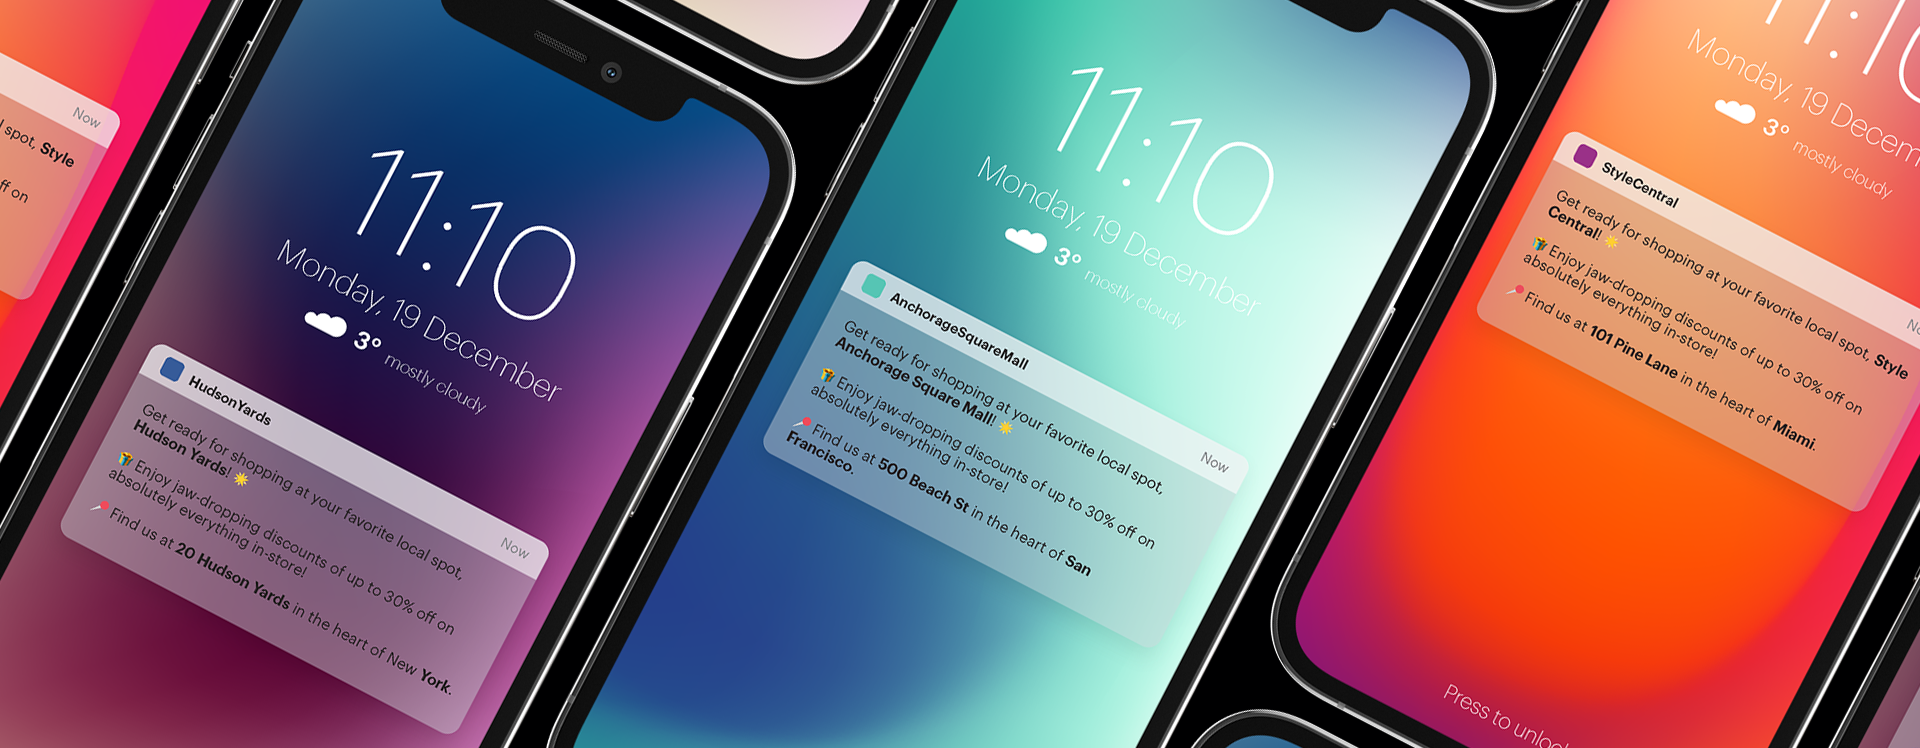
This use case uses the following content:
{% set mainShop = customer.StoreId %}
   {% catalogitemv2.UC-ShopsSale11092023(mainShop) %}
   Get ready for shopping at your favorite local spot, {{ catalog_result.StoreName }}! 🌟
   🎁 Enjoy jaw-dropping discounts of up to 30% off on absolutely everything in-store!
   📍 Find us at {{ catalog_result.Street }} in the heart of {{ catalog_result.City }}.
   {% endcatalogitemv2 %}
Where:
- `StoreId` - the name of the attribute assigned to the user profile reflecting the store ID,
- `UC-ShopsSale11092023` - is the name of the created catalog,
- `StoreName`, `Street`, `City` - are the names of the columns defined in the catalog.
Example of a SMS template
6. Save the template.
### Create a workflow for the SMS campaign
---
Create a workflow that sends a personalized SMS message to a selected segment of customers, informing them of a promotion at a store of their choice.
1. Go to **Automation Hub > Workflows > New workflow**.
2. Enter the name of the workflow.
### Define the Audience node
---
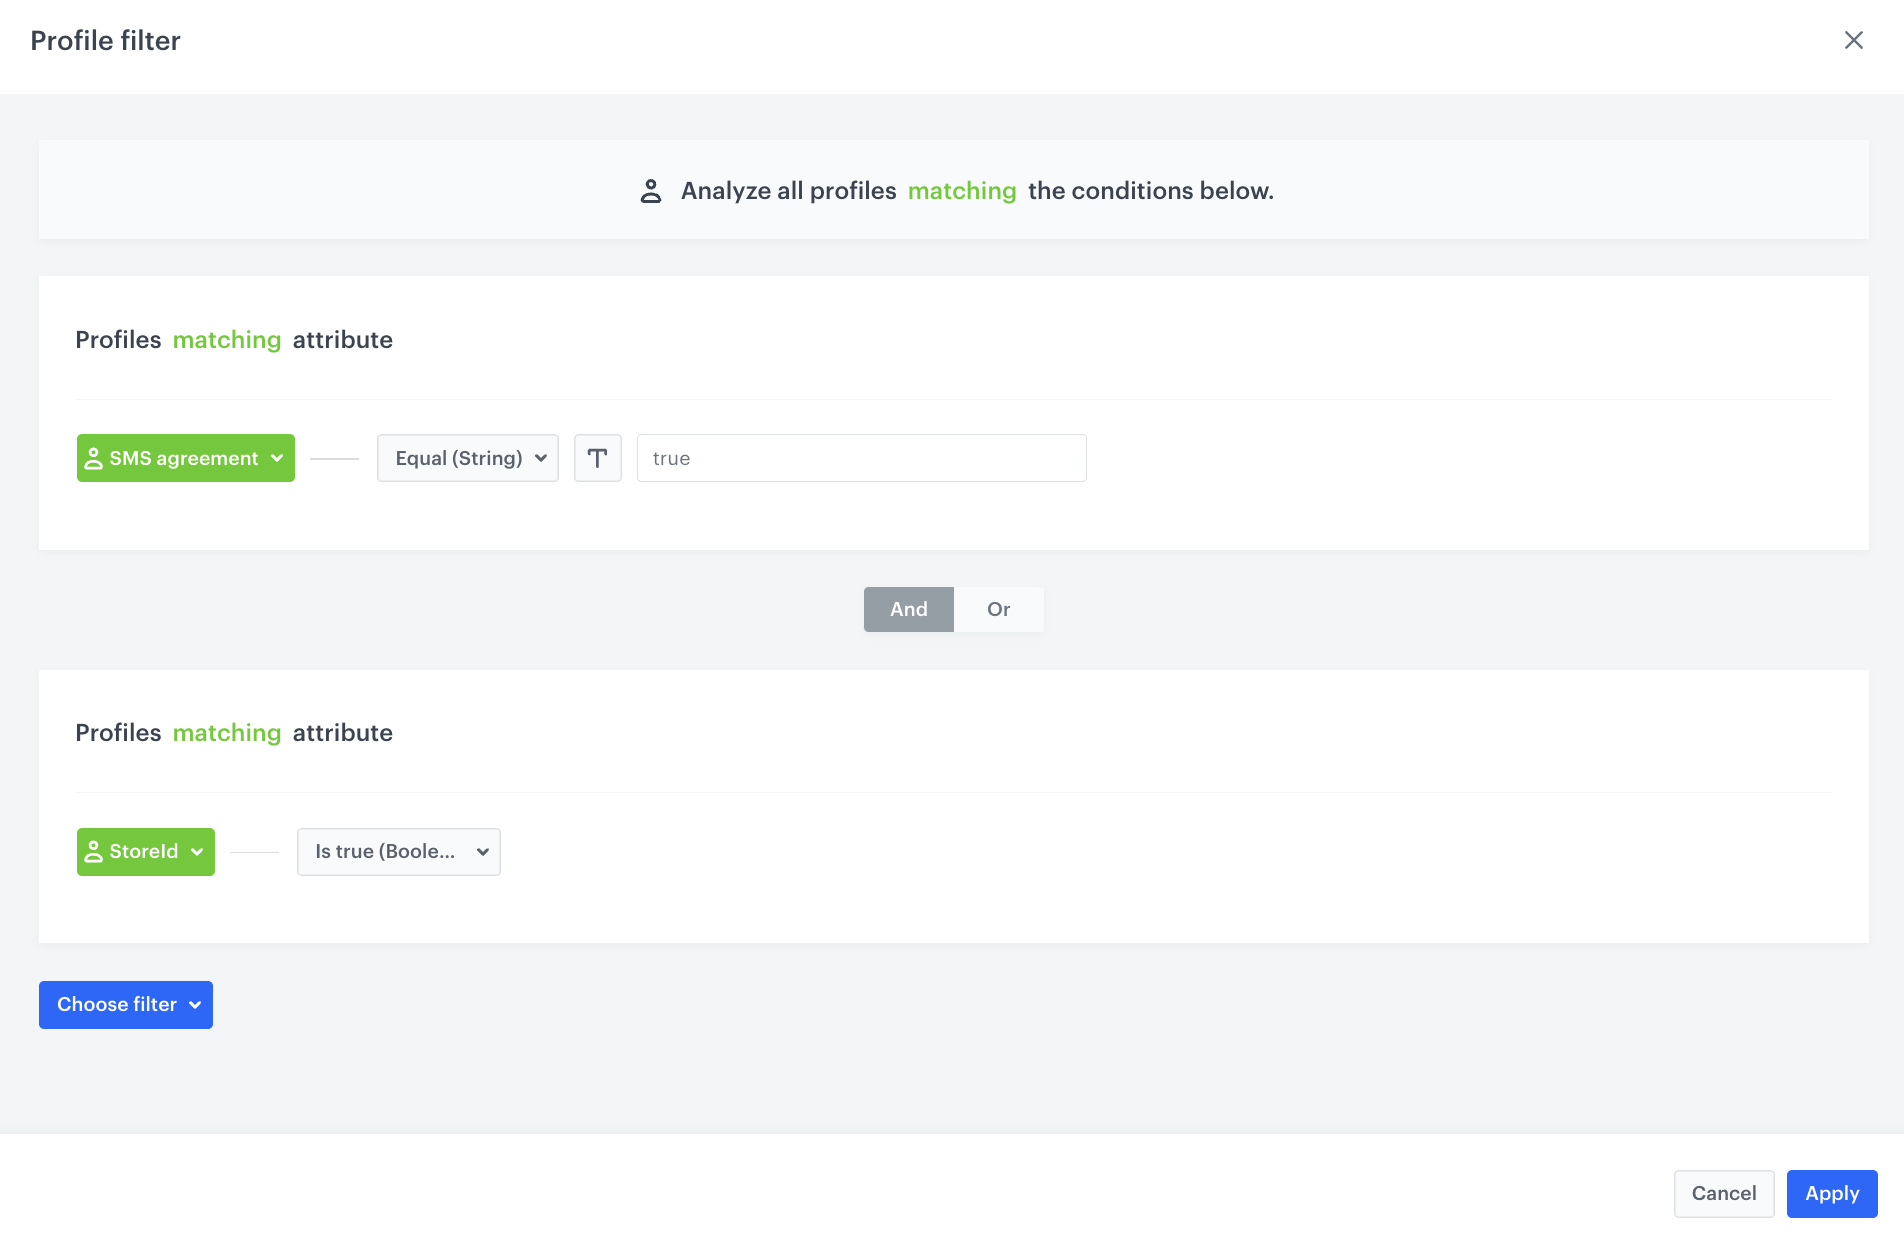
Choose the **Audience** node as the trigger. In this scenario, we are creating a group of customers who have agreed to receive SMS messages and have assigned StoreId attribute to their profile.
The audience should consist of users who have an attribute used as the **Primary key** in the catalog, otherwise the message will have an **sms.notSent** event with **Jinava rendering failed** as the parameter.
1. Start the workflow with the **Audience** node.
2. In the configuration of the node, leave the **Run trigger** as **one time**.
3. Choose the day and time when the process starts.
4. In **Define audience**, choose **New Audience** and define the conditions according to your needs.
The following screen shows the audience configuration used in this use case.
Audience configuration
### Define the Send SMS node
---
1. Add the **Send SMS** node. In the node settings:
1. In the **Content** section, choose the phone number from which the message will be sent.
2. From the **SMS template** drop-down, select [the template you created earlier in the process](/use-cases/dynamic-sms-campaign#prepare-an-sms-message-template).
2. Click **Apply**.
### Add the finishing node and set capping
---
1. Add the **End** node.
2. In the upper right corner, click **Save & Run**.
Final configuration of the workflow
## Check the use case set up on the Synerise Demo workspace
---
You can check the configuration of each step directly in the Synerise Demo workspace:
- [Aggregate](https://app.synerise.com/analytics/aggregates/6b686d01-758f-328a-859b-91e3542c5bbe)
- [Workflow to assign StoreId to customer profile](https://app.synerise.com/automations/workflows/automation-diagram/73ee4841-ffc1-48b1-a273-3f3e58415aac)
- [Catalog](https://app.synerise.com/assets/catalogs/182901)
- [Workflow for the SMS campaign](https://app.synerise.com/automations/automation-diagram/4c02a16a-4455-4f31-bc50-1b2a2f563281)
If you’re our partner or client, you already have automatic access to the **Synerise Demo workspace (1590)**, where you can explore all the configured elements of this use case and copy them to your workspace.
If you’re not a partner or client yet, we encourage you to fill out the contact [form](https://demo.synerise.com/request) to schedule a meeting with our representatives. They’ll be happy to show you how our demo works and discuss how you can apply this use case in your business.
## Generated events
This use case generates approximately 9 events per profile that completes the flow:
[`transaction.charge`](/docs/assets/events/event-reference/items#transactioncharge) (~1), [`automation.clientStartPath`](/docs/assets/events/event-reference/automation#automationclientstartpath) (~2), [`automation.clientPathStep`](/docs/assets/events/event-reference/automation#automationclientpathstep) (~2), [`automation.clientEndPath`](/docs/assets/events/event-reference/automation#automationclientendpath) (~2), [`profile.updated`](/docs/assets/events/event-reference/profiles#profileupdated) (~1), [`sms.send`](/docs/assets/events/event-reference/sms#smssend) (~1).
## Read more
---
- [Aggregates](/docs/crm/aggregates)
- [Automation Hub](/docs/automation)
- [Catalogs](/docs/assets/catalogs/introduction-to-catalogs)
- [SMS campaigns](/docs/campaign/SMS)
# Importing product data into the Synerise catalog
Data quality and timeliness are key to executing effective business operations. It is important that the data you are handling is always up-to-date, otherwise your communications won't meet the current needs of your customers. A useful solution, in this case, can be the cyclical transfer of data stored on servers to Synerise catalogs. It gives you the possibility to use up-to-date product data in customer communications such as e-mail campaigns, dynamic content, text messages, web pushes, and other customized messaging.
This use case describes the process of creating an automated, recurring workflow that transfers data from your server over HTTPS to a catalog in Synerise.
## Prerequisites
---
- [Create a catalog](/docs/assets/catalogs/creating-catalogs). The catalog can be empty.
- Product data in the form of an XML file under the HTTPS link. Check [XML feed requirements](/developers/product-feed).
The maximum allowed size of the data file is 5 GB (5 000 000 000 bytes).
## Create the workflow
---
Create the workflow that imports the product data from the HTTPS link into the Synerise catalog every hour.
1. Go to **Automation Hub > Workflows > New workflow**.
3. Enter the name of the workflow.
4. As the trigger node, add **Scheduled Run**.
5. In the configuration of the node:
1. In the **Run trigger** dropdown, leave the defauld option **All time**.
2. From the **Timezone** list, select the time zone.
3. Select **Everyday** tab to launch the workflow every day at the defined time.
4. Add the hours when the workflow should be activated.
5. Confirm by clicking **Apply**.
The configuration of the Scheduled Run node
6. Add the **HTTPS Get File** node.
7. In the configuration of the node:
1. Leave the method at default (**GET**).
2. In the URL, enter the address of the resource.
3. As a file format, from the dropdown list, select **XML feed**.
4. In the Authentication section, select the required authentication method.
6. Confirm by clicking **Apply**.
The configuration of the HTTPS get file node
8. Add the **Import to Catalog** node.
9. In the configuration of the node:
1. Select the catalog to which the data will be imported.
2. As the primary key, enter the name of the XML element which contains the unique identifiers of the items.
3. Confirm by clicking **Apply**.
The configuration of the Import to Catalog node
10. Add the **End** node.
The workflow configuration
Information about products from the catalog can be referenced in customer communications such as e-mails, dynamic content, text messages, etc. using [inserts](/developers/inserts/insert-usage#catalogs).
Example of a catalog with imported data:
Example of a catalog with imported items
## Check the use case set up on the Synerise Demo workspace
---
You can check the workflow configuration directly in Synerise demo workspace, at this [link](https://app.synerise.com/automations/automation-diagram/b9496621-b24f-4866-8fe1-8a5da67931df).
If you’re our partner or client, you already have automatic access to the **Synerise Demo workspace (1590)**, where you can explore all the configured elements of this use case and copy them to your workspace.
If you’re not a partner or client yet, we encourage you to fill out the contact [form](https://demo.synerise.com/request) to schedule a meeting with our representatives. They’ll be happy to show you how our demo works and discuss how you can apply this use case in your business.
## Generated events
This use case generates approximately 4 events per workflow execution:
[`automation.clientStartPath`](/docs/assets/events/event-reference/automation#automationclientstartpath) (~1), [`automation.clientPathStep`](/docs/assets/events/event-reference/automation#automationclientpathstep) (~2), [`automation.clientEndPath`](/docs/assets/events/event-reference/automation#automationclientendpath) (~1).
## Read more
- [Catalogs](/docs/assets/catalogs/introduction-to-catalogs)
- [Product feed](/developers/product-feed)
# Test with different types of recommendations
---
In Synerise we have many different types of recommendations. You can choose the one that best suits you and your business.
We recommended adding them in different stages of the customer journey. From which type you should start?
You can discover this only through testing. Testing different types of recommendations determine which one will convert best is the optimal solution.
## Example of use - Retail Industry
**Challenge**
We created a strategy for the website of a client from the retail industry consisting of different types of recommendations:
- Personalized recommendations on the home page
- Personalized recommendation on the listing based on gender
- Cross-selling recommendations on the product page
- Cart recommendations in the basket
- Recommendations on the zero-search results page
All of the recommendations were added to the campaign dashboard to monitor results.
The results were generally good, but we decided to compare them with the results from another brand belonging to the customer. We also decided to switch from cross-selling and cart recommendations to fully personalized recommendations because we did not have any historical transactions from the client and we wanted to compare which gave better results in a situation when you do not have any data but you want to still personalize the content.
We implemented the same recommendations as in the first brand (except the recommendations on the product page).
**Solution**
We decided to make three changes:
**1st** We put personalized recommendations everywhere on the site
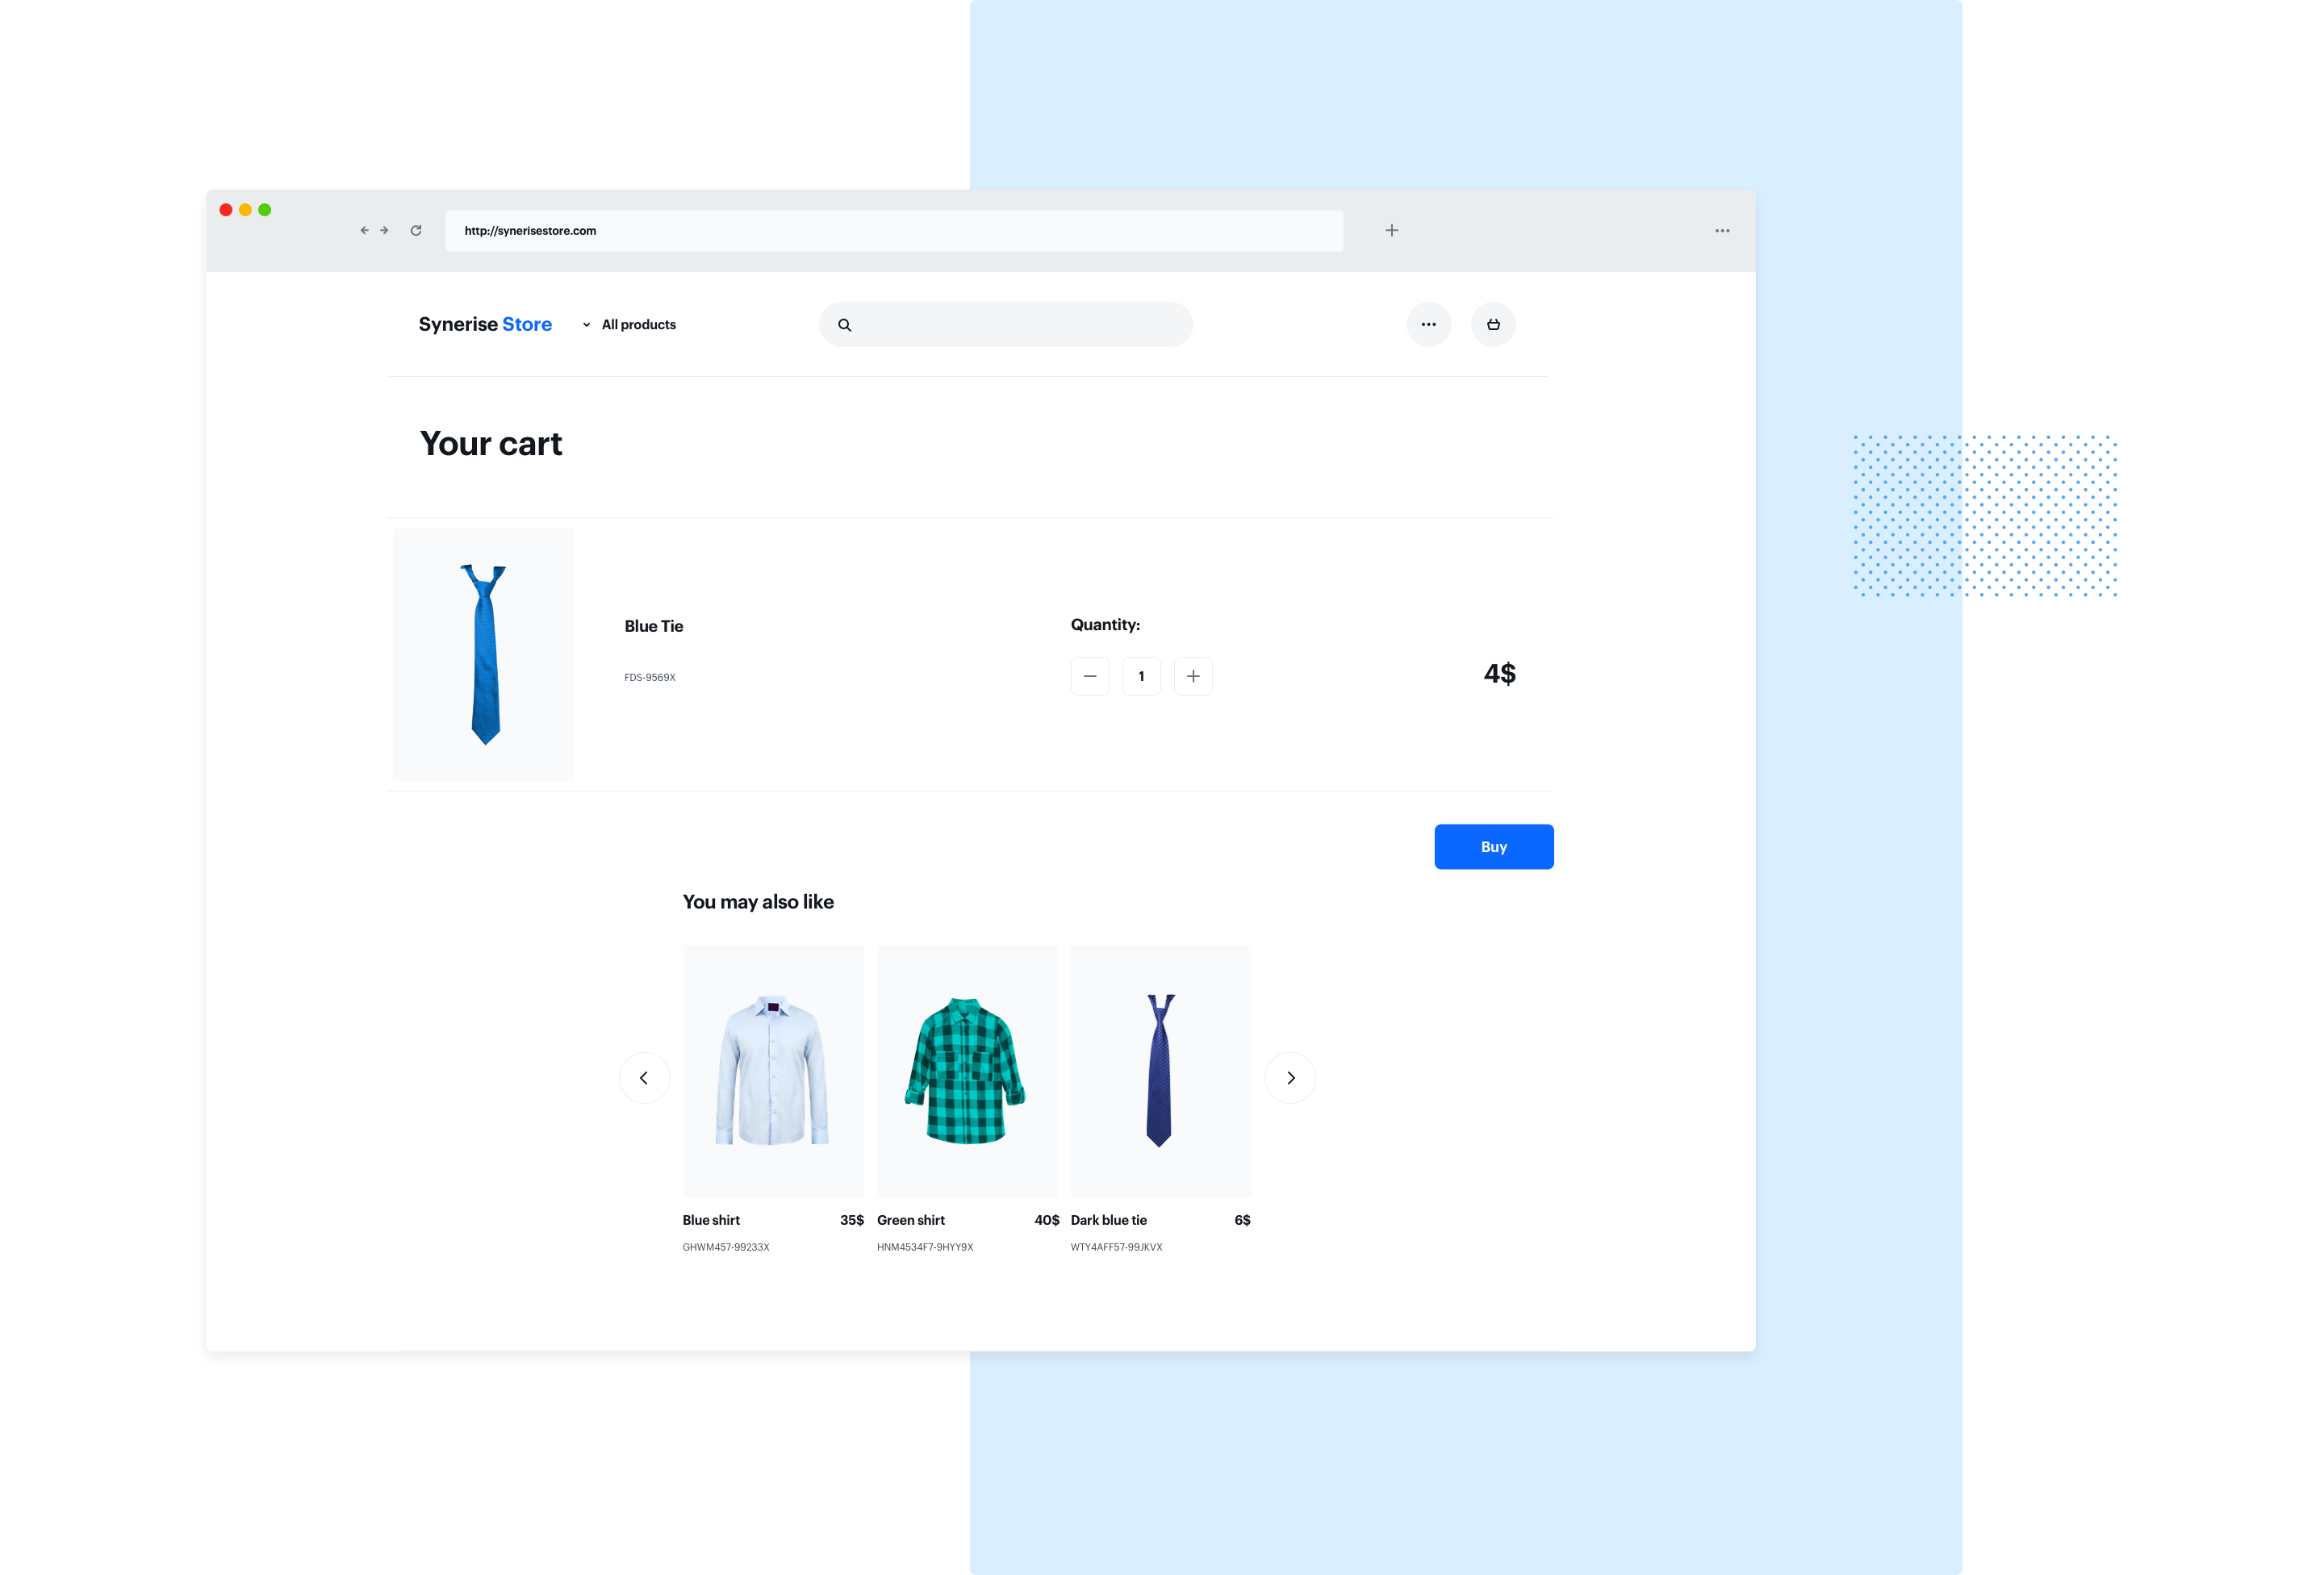
**2nd** We put sets of products on the cart recommendations - when someone added a men’s shirt to a cart, we recommend only ties
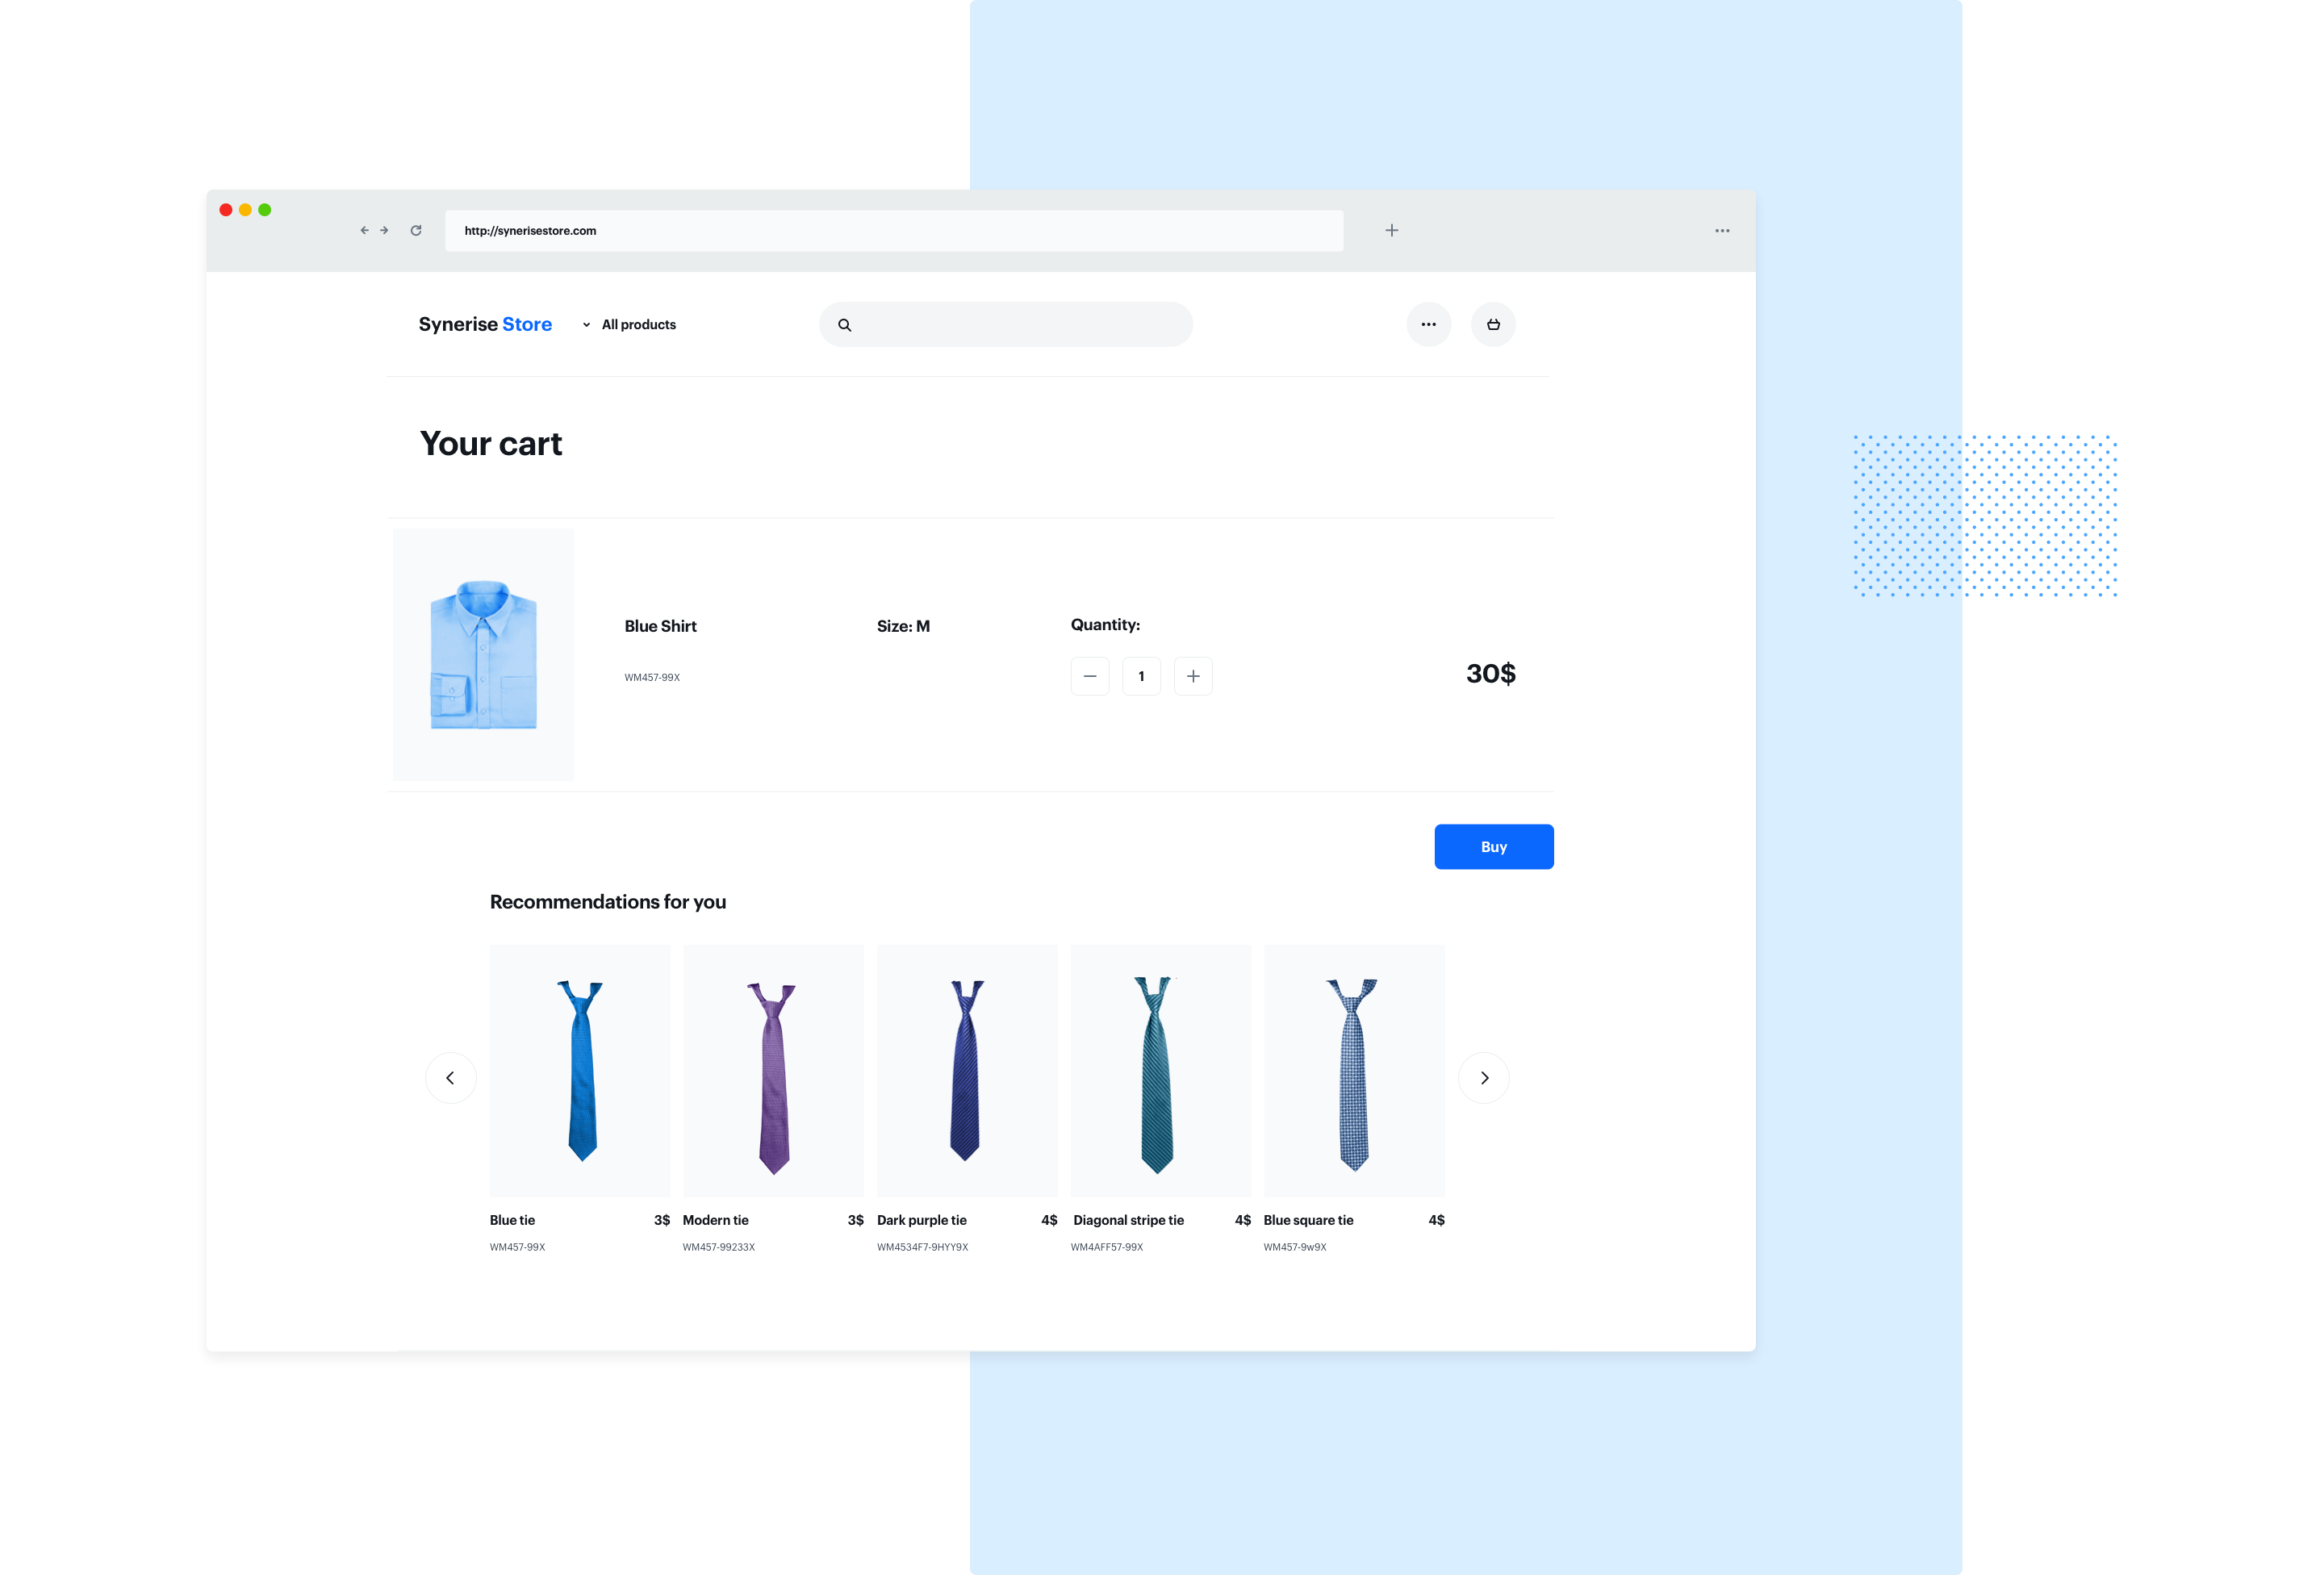
**3rd** We put sets of products on the cart recommendations - when someone added a men’s trousers to a cart, we recommend only shirts
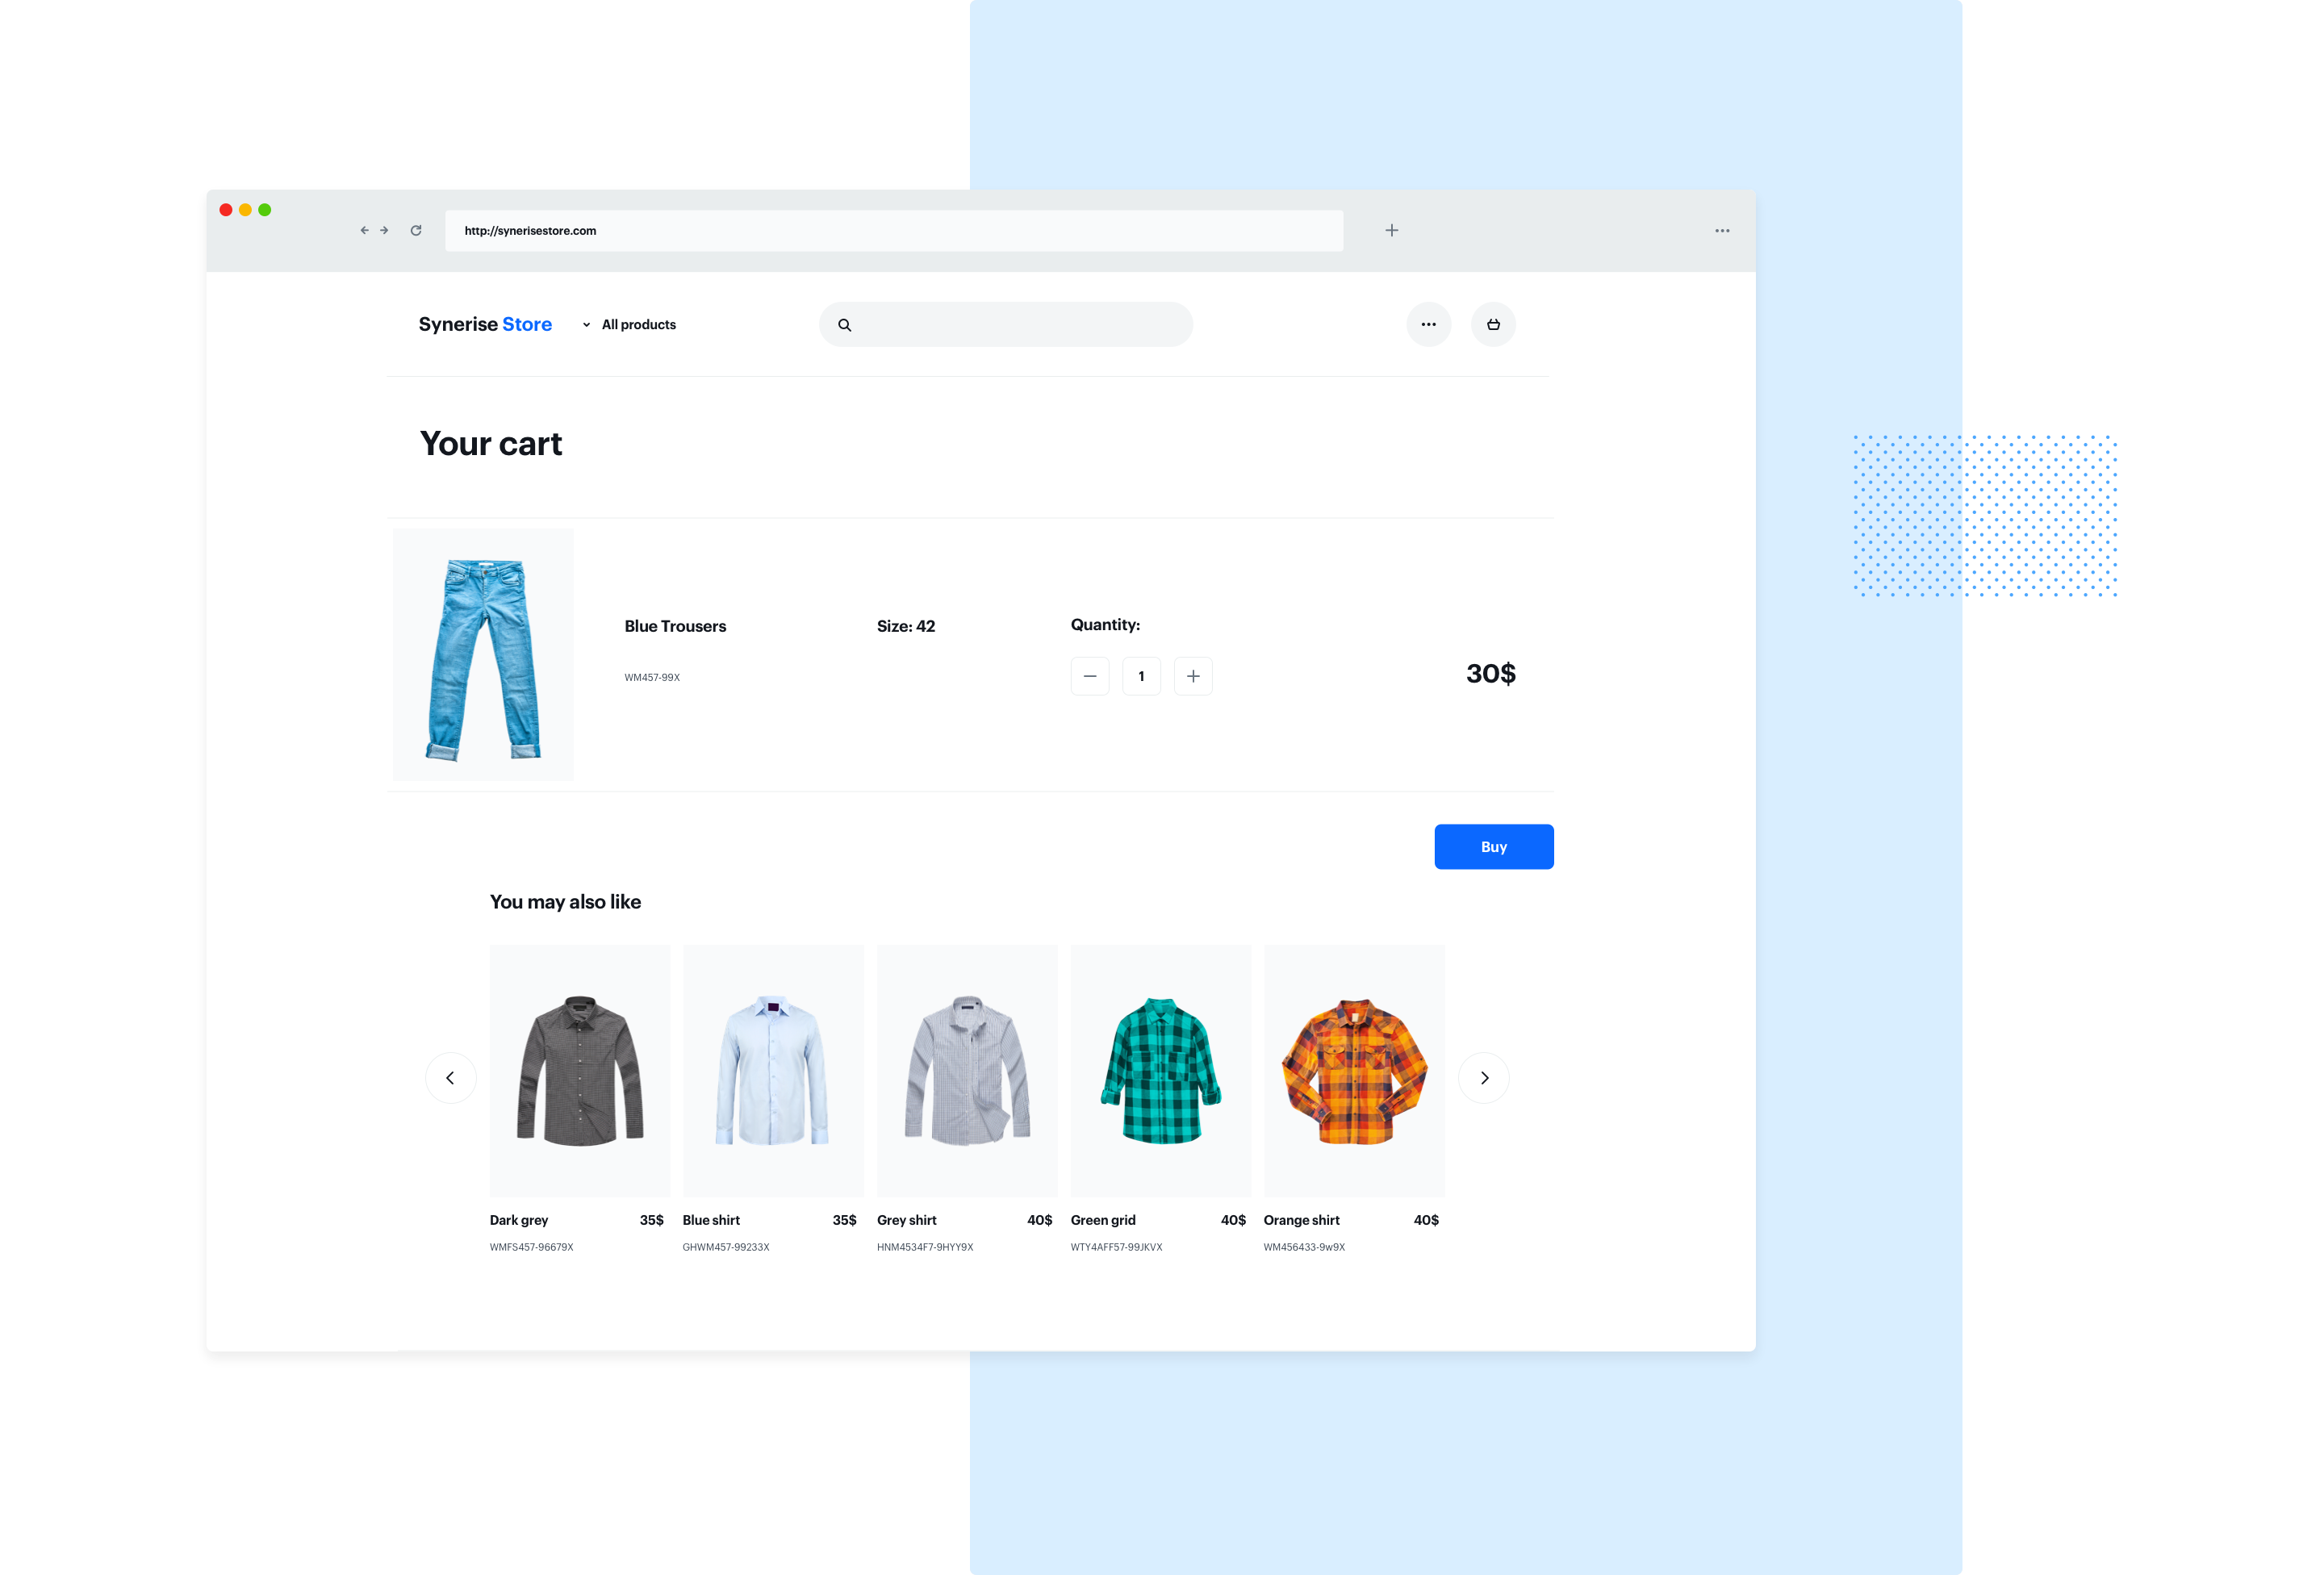
**Results**
- **2%** CTR for sets recommendations (ties to shirts)
- **3%** CTR (shirts to trousers)
- **6%** CTR - personalized basket recommendations
These results show that AI can make better decisions than even someone with lots of industry experience.
After comparing these two campaigns, we learned that:
- **14%** of users bought products based on recommendations on brand A
- **21%** of users bought products based on recommendations on brand B
Personalized recommendations for brand B worked better than mixed types of recommendations on the different steps of the journey.
We also compared two different types of recommendations in the basket:
- **~1%** Conversion rate - in case of sets of products (ties to shirt, shirt to pants)
- **4%** Conversion rate - in case of personalized recommendations
## Requirements
**General:**
- Product feed
- OG:tags
- Transactions
- Page visits (Synerise tracker)
**Additional:**
- Historical transactions
- Historical page visits
- Other activities and user behavior
## How to do it
---
1. At first you must choose what type of recommendation would you like to use on your website.
2. Set up the campaign:
- Declare the quantity of returning products in your recommendation
- Configure the recommendations filter. You can use brand filter, category, price, discounts, gender and a few other additional settings.
- Adjust the additional settings. This part will help you with choosing the optimal set of products and put them in the most favorable order.
3. Copy the campaign ID from its URL.
4. Decide where you want to display your campaign. In this case it was a dynamic content campaign.
5. In the dynamic content creator, adjust the settings:
- Choose one of two types of campaigns. In this case, it should be an inserted object, because we want to place a slider on our website.
- Define the audience – people who should see your campaign.
- Create the content - remember to copy the unique ID code from your recommendations model and put it directly in the code of dynamic content campaign as campaign ID.
- Configure the additional display settings and schedule your campaign time.
## Generated events
This use case generates approximately 5 events per profile that completes the flow:
[`dynamicContent.show`](/docs/assets/events/event-reference/dynamic-content#dynamiccontentshow) (~1), [`dynamicContent.click`](/docs/assets/events/event-reference/dynamic-content#dynamiccontentclick) (~1), [`recommendation.generated`](/docs/assets/events/event-reference/recommendations#recommendationgenerated) (~1), [`recommendation.view`](/docs/assets/events/event-reference/recommendations#recommendationview) (~1), [`recommendation.click`](/docs/assets/events/event-reference/recommendations#recommendationclick) (~1).
## Read more
---
- Learn how to build [AI recommendations](/docs/ai-hub/recommendations-v2)
- Learn more about [dynamic content campaigns](/docs/campaign/dynamiccontent)
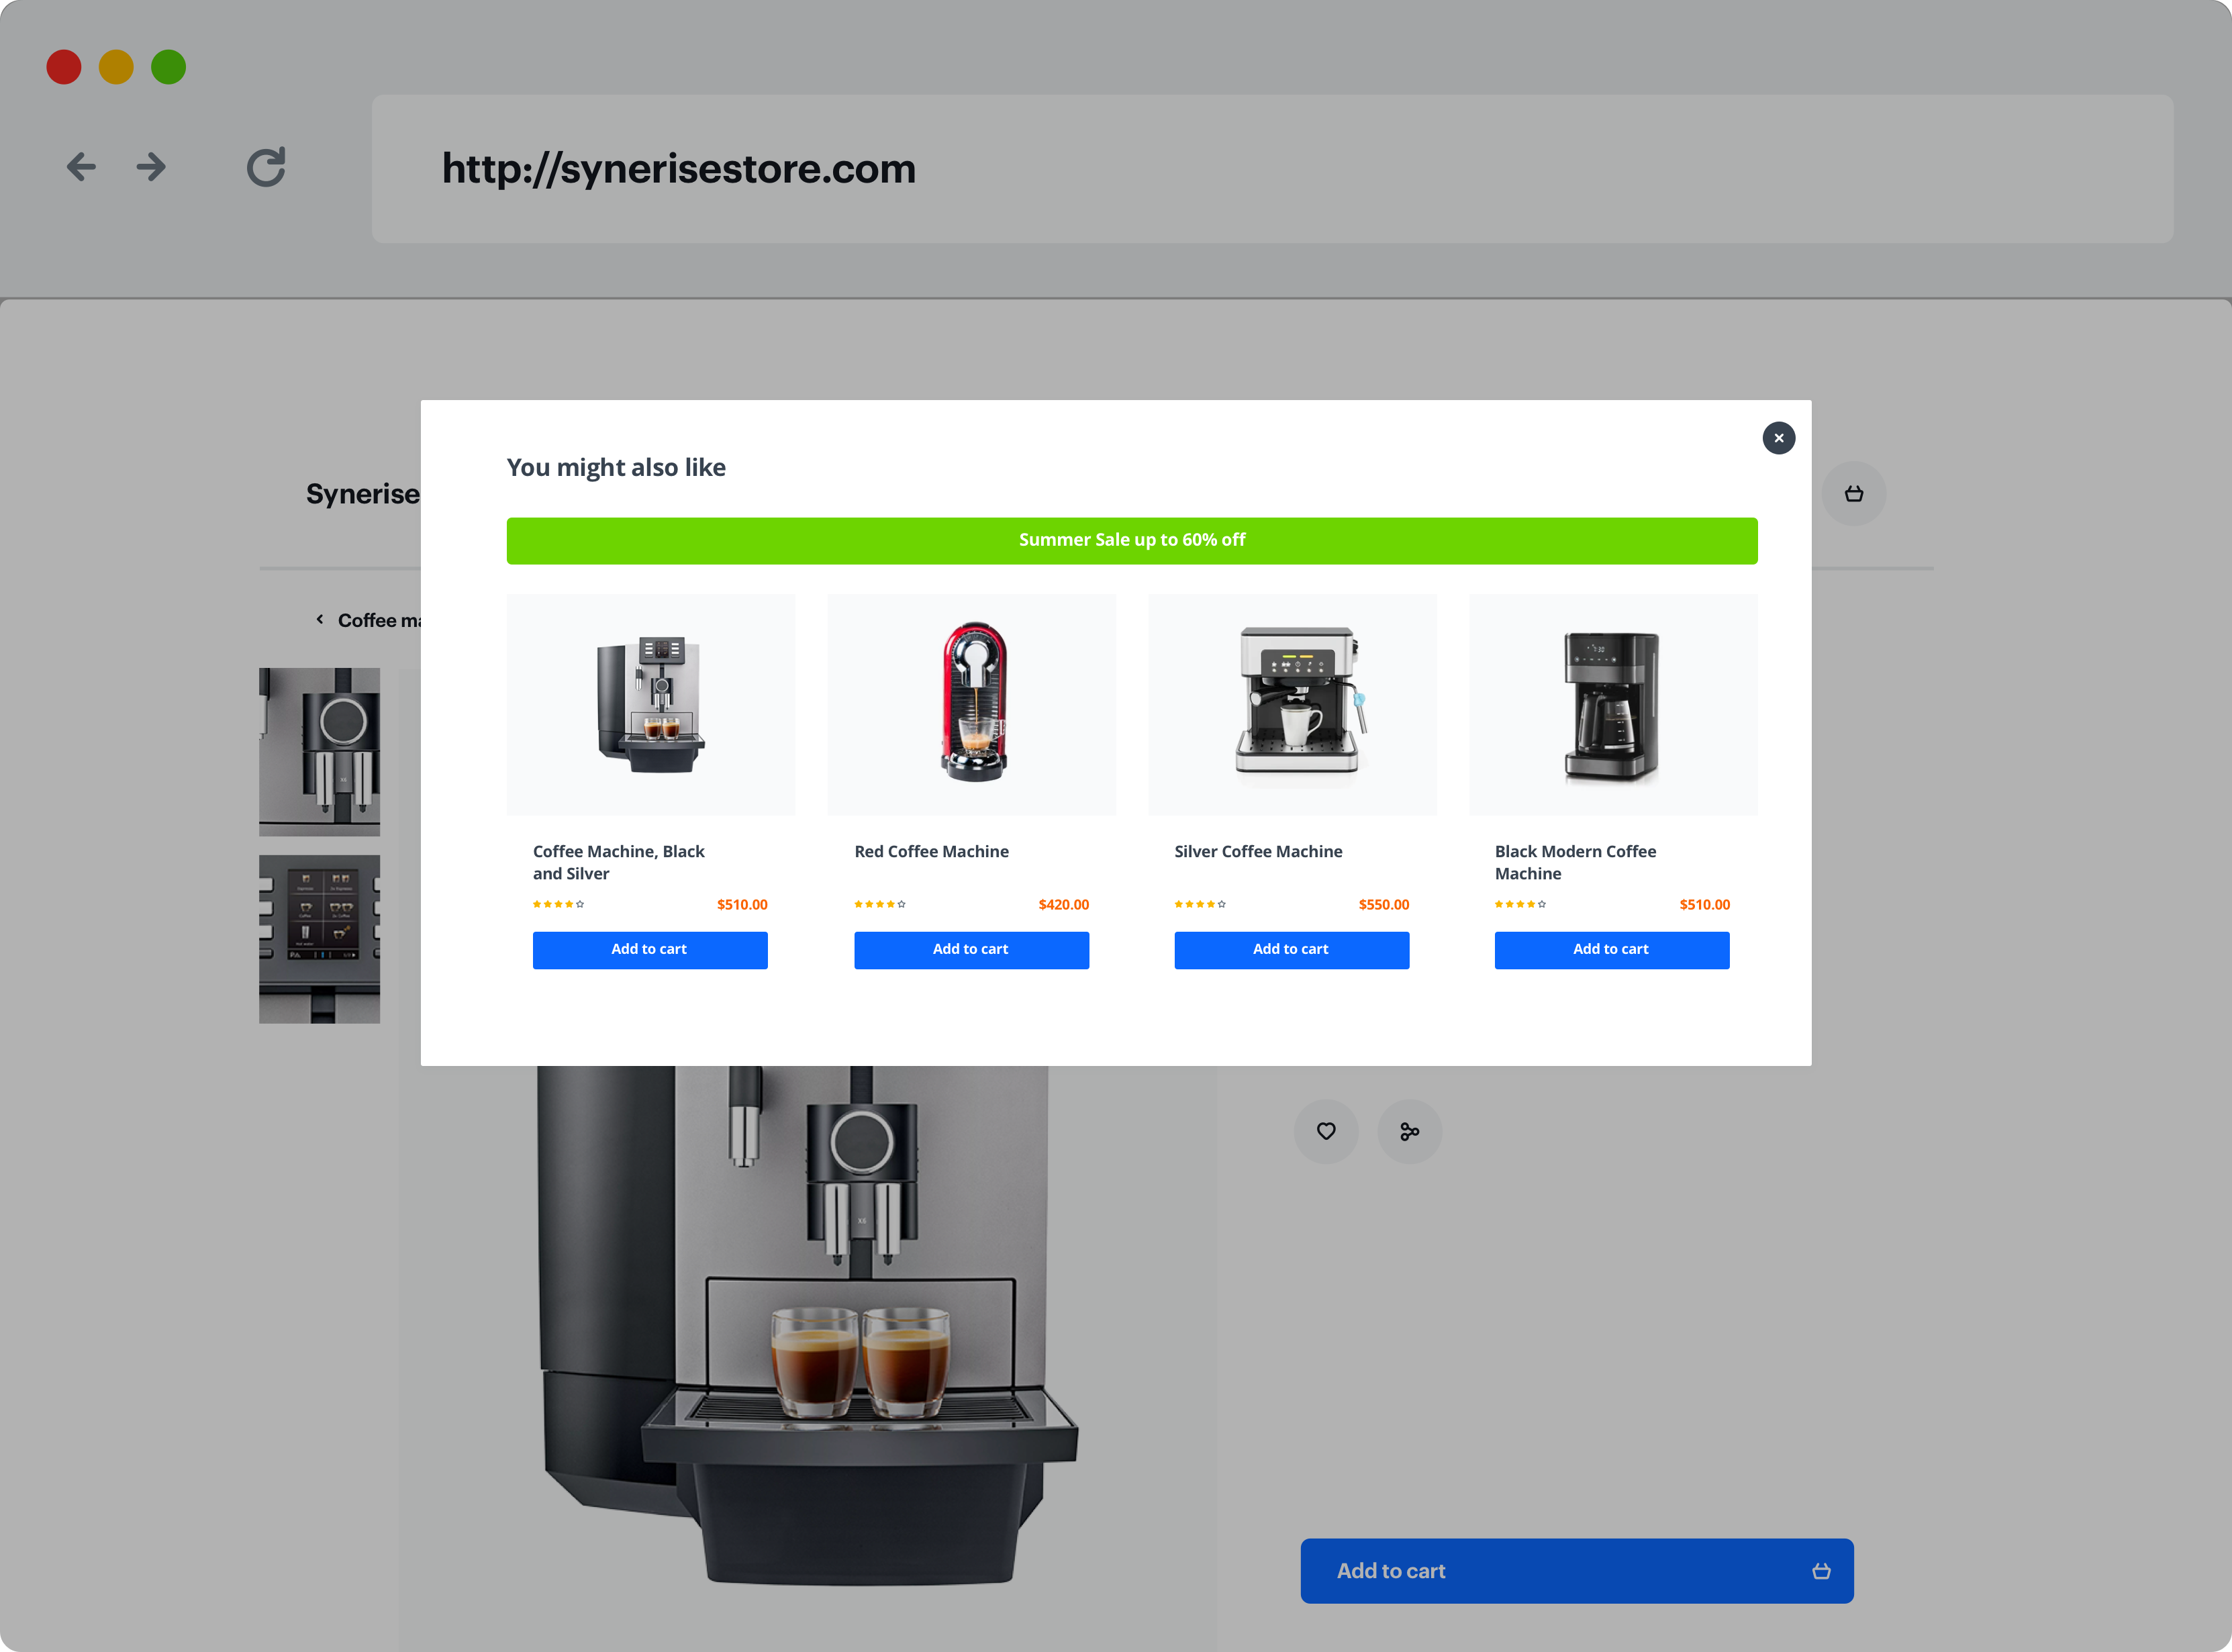
 **AI Hub > (AI Recommendations) Models > Add recommendation**.
2. Enter the name of the recommendation (it is only visible on the list of recommendation).
3. In the **Type & Items feed** section, click **Define**.
4. From the **Items feed** dropdown list, select an item feed.
5. In the **Type** section, choose the **Similar items** recommendation type.
6. Confirm the settings by clicking **Apply**.
7. In the **Items** section, click **Define**.
1. Click **Add slot**.
2. Define the minimum and maximum number of items that will be recommended to the customer in each slot.
3. Optionally, define [Static filters](/docs/ai-hub/recommendations-v2/creating-recommendation-campaign#static-filters) and [Elastic filters](/docs/ai-hub/recommendations-v2/creating-recommendation-campaign#elastic-filters).
4. Confirm by clicking **Apply**.
8. Optionally, you can define the **Boosting** factors and settings in the **Additional settings** section.
9. In the right upper corner, click **Save**.
## Create dynamic content campaign
---
Create a dynamic content campaign with recommendations of similar items using a predefined dynamic content web layer template. This dynamic content will be displayed as a pop-up on your site for the customers who have added products to their shopping cart.
1. Go to
**AI Hub > (AI Recommendations) Models > Add recommendation**.
2. Enter the name of the recommendation (it is only visible on the list of recommendation).
3. In the **Type & Items feed** section, click **Define**.
4. From the **Items feed** dropdown list, select an item feed.
5. In the **Type** section, choose the **Similar items** recommendation type.
6. Confirm the settings by clicking **Apply**.
7. In the **Items** section, click **Define**.
1. Click **Add slot**.
2. Define the minimum and maximum number of items that will be recommended to the customer in each slot.
3. Optionally, define [Static filters](/docs/ai-hub/recommendations-v2/creating-recommendation-campaign#static-filters) and [Elastic filters](/docs/ai-hub/recommendations-v2/creating-recommendation-campaign#elastic-filters).
4. Confirm by clicking **Apply**.
8. Optionally, you can define the **Boosting** factors and settings in the **Additional settings** section.
9. In the right upper corner, click **Save**.
## Create dynamic content campaign
---
Create a dynamic content campaign with recommendations of similar items using a predefined dynamic content web layer template. This dynamic content will be displayed as a pop-up on your site for the customers who have added products to their shopping cart.
1. Go to  **Experience Hub > Dynamic content > Create new**.
2. Enter the name of the dynamic content.
3. Choose the **Web layer** type.
4. As the audience, select **Everyone**.
### Define content
5. In the **Content** section, click **Define**.
6. In the **Content** tab, click **Create Message**.
7. From the list of template folders, select a folder with the predefined **Web layer templates**.
**Result**: You are redirected to the list of predefined templates.
**Experience Hub > Dynamic content > Create new**.
2. Enter the name of the dynamic content.
3. Choose the **Web layer** type.
4. As the audience, select **Everyone**.
### Define content
5. In the **Content** section, click **Define**.
6. In the **Content** tab, click **Create Message**.
7. From the list of template folders, select a folder with the predefined **Web layer templates**.
**Result**: You are redirected to the list of predefined templates.
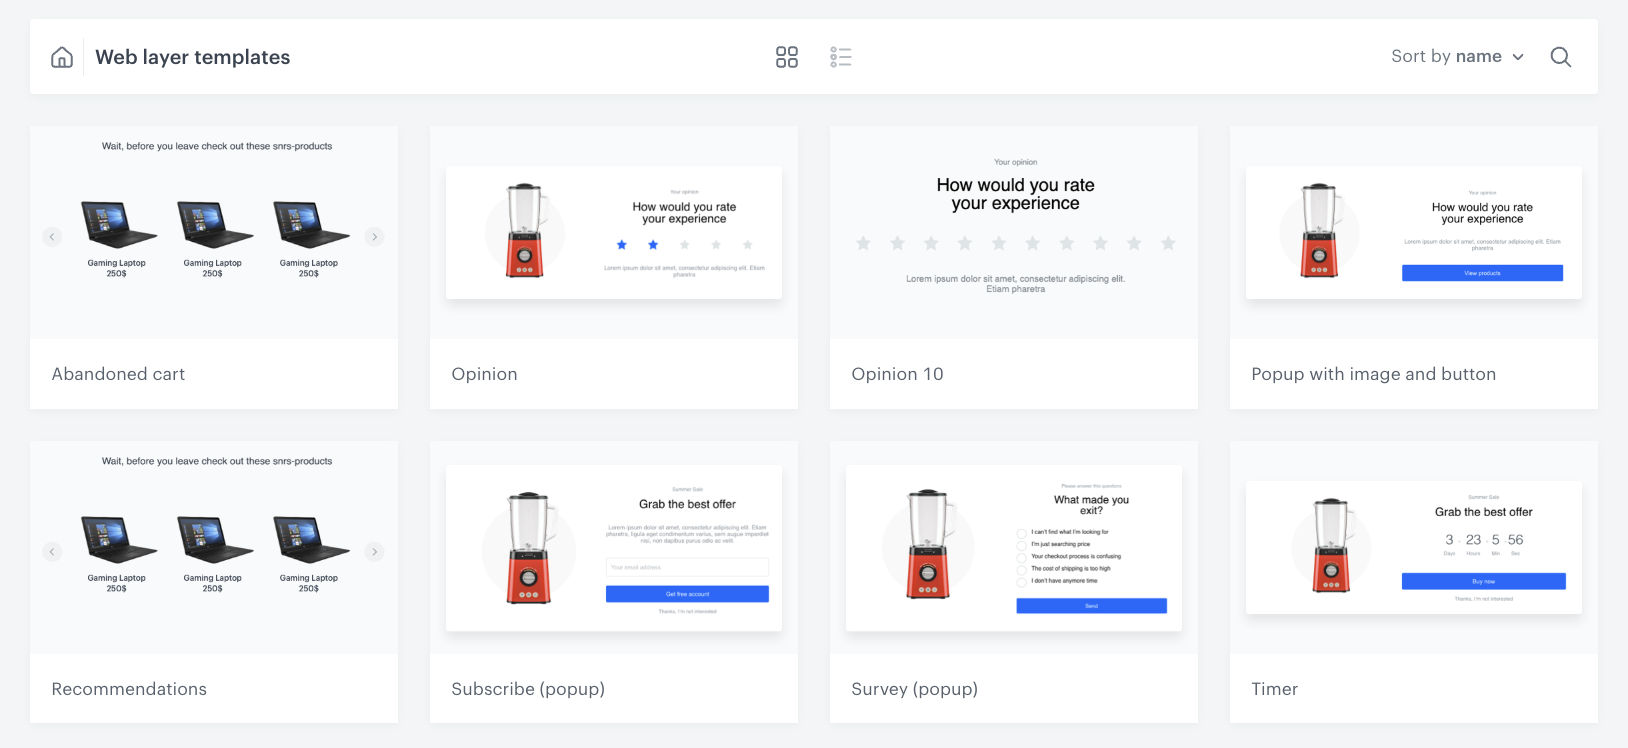
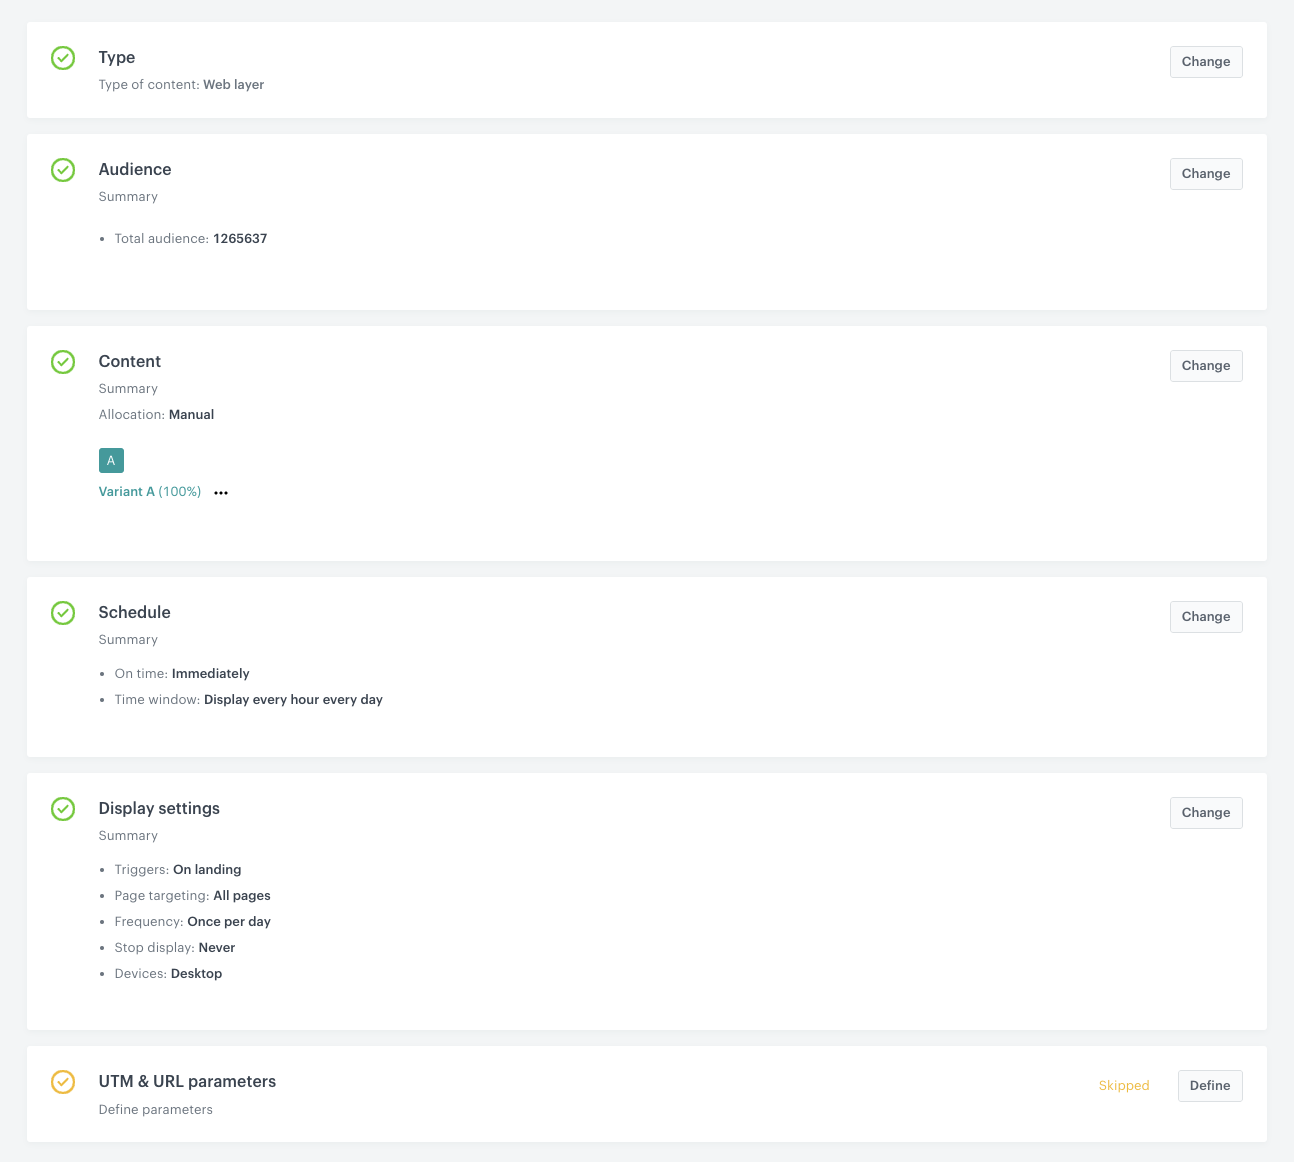
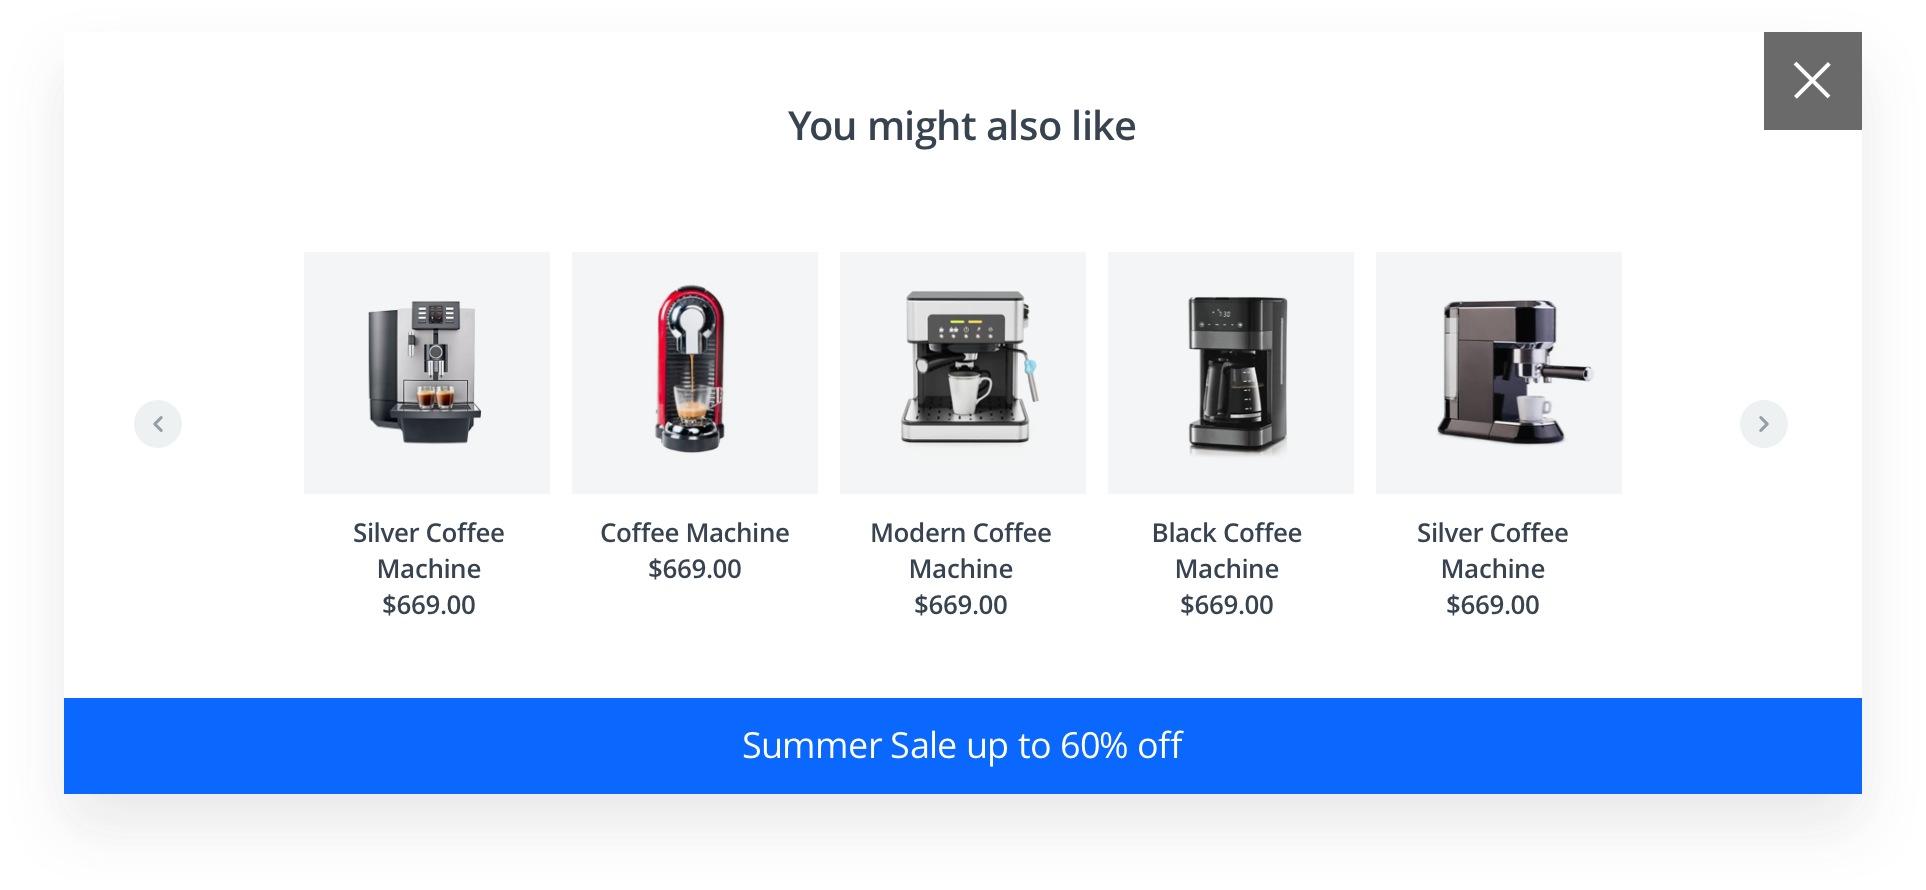
 **Behavioral Data Hub > Expression > New expression**.
2. Enter the name of the expression.
3. Set the Expression for option to **Event**.
4. From the dropdown list, select **product.buy**.
5. Build the expression as shown in the screenshot below:
**Behavioral Data Hub > Expression > New expression**.
2. Enter the name of the expression.
3. Set the Expression for option to **Event**.
4. From the dropdown list, select **product.buy**.
5. Build the expression as shown in the screenshot below:
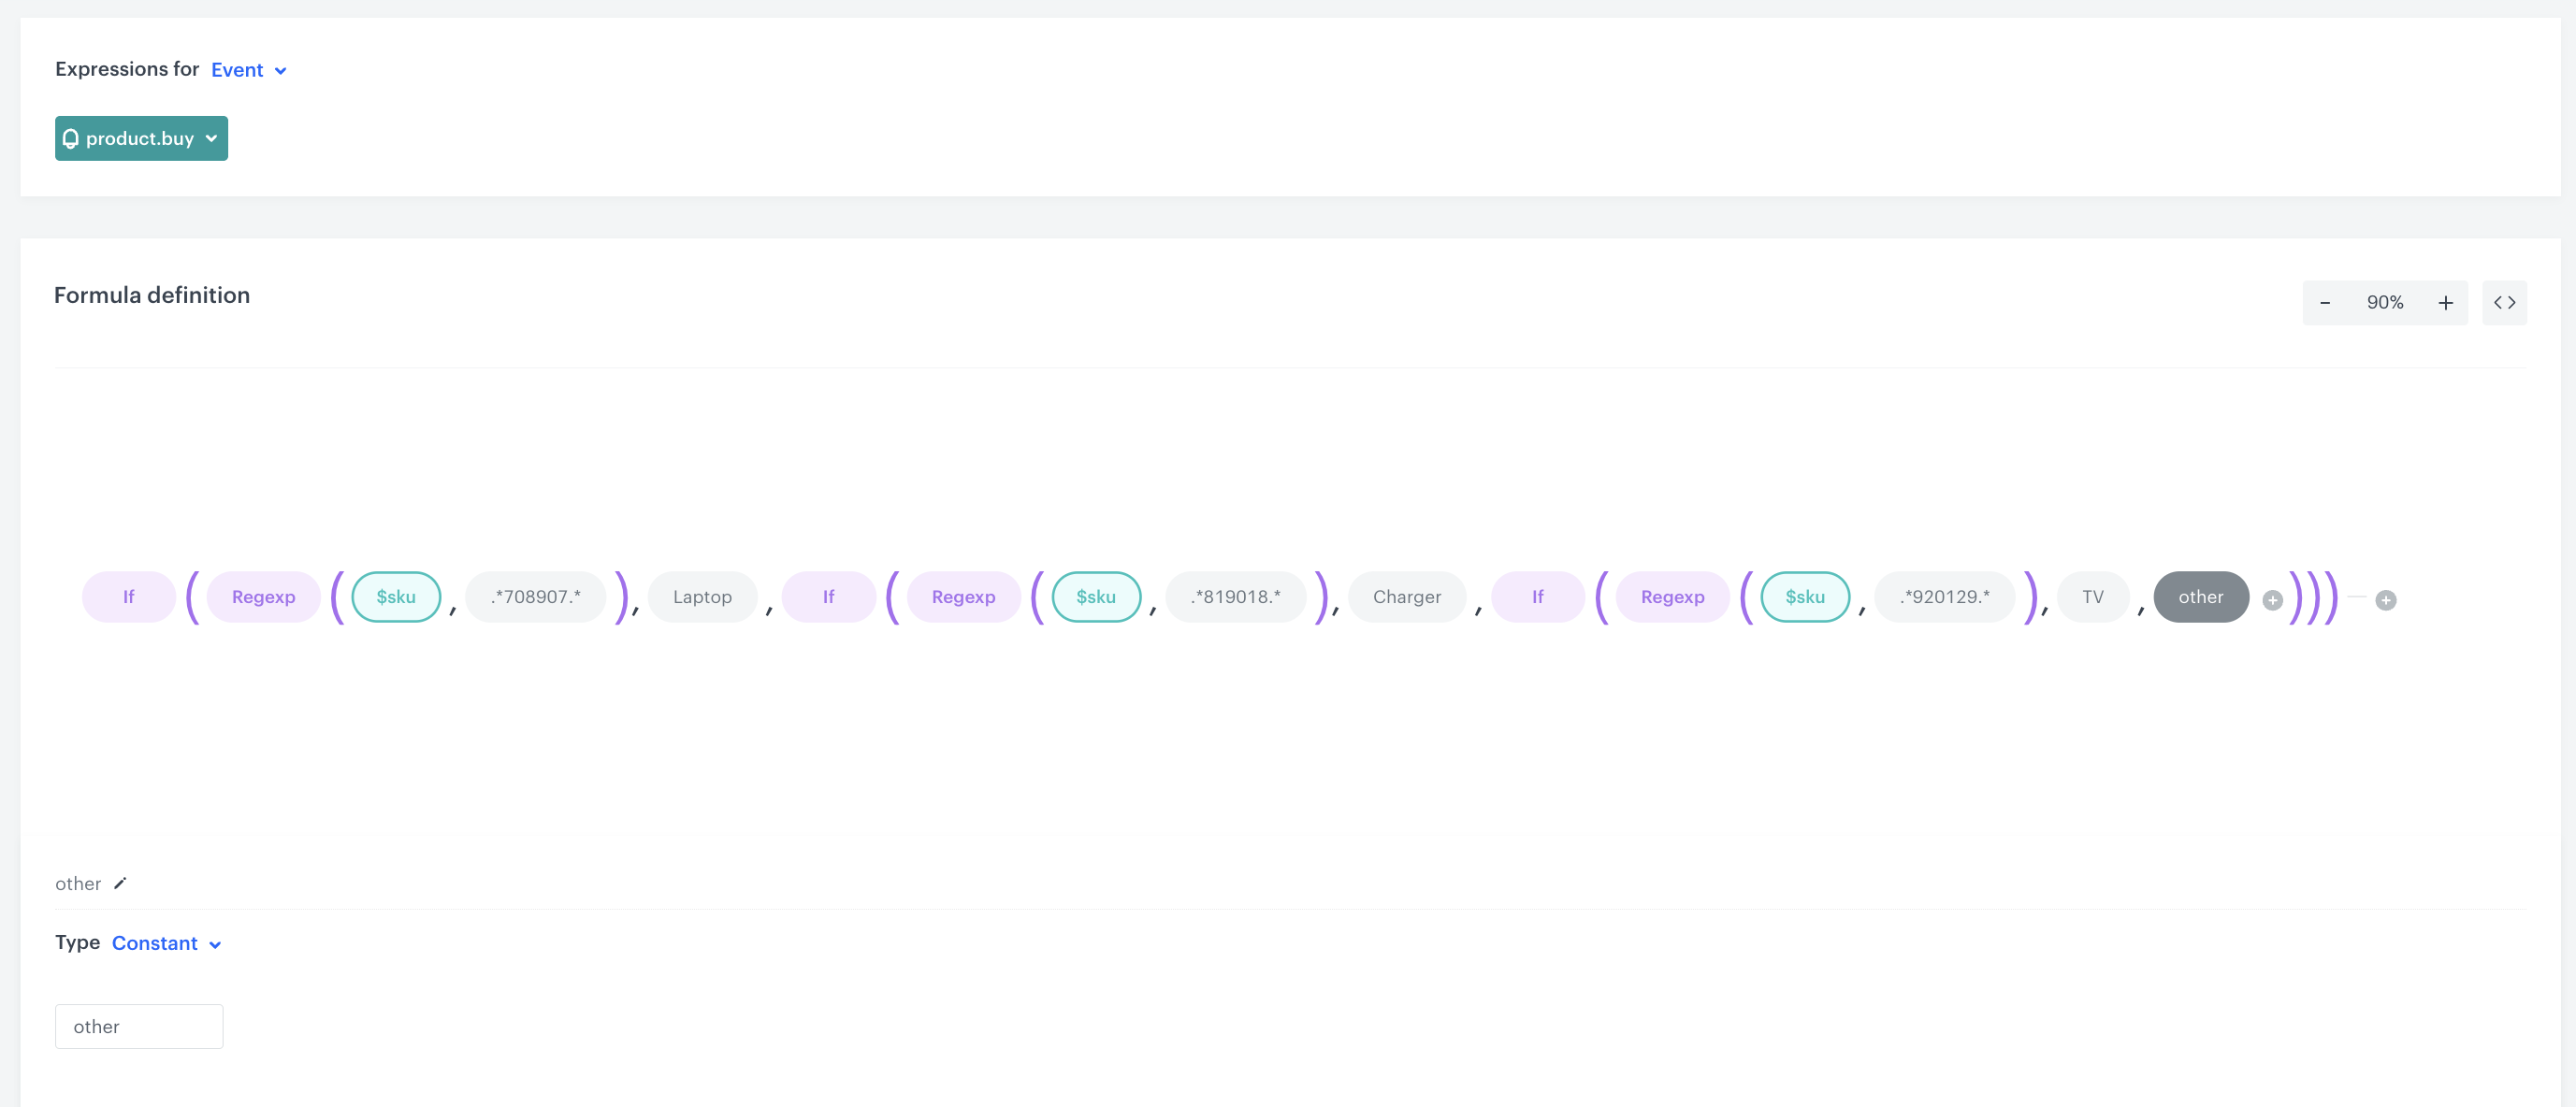
 **Decision Hub > Metrics > New mertic**.
2. Enter the name of the metric.
3. As a metric kind, select **Simple metric**.
4. As the aggregator, set **Count**.
5. As the occurrence type, set **All**.
6. From the Choose event dropdown list, select **product.buy** event.
7. Click **Where** button.
Result: The Choose parameter button appears.
8. Click the **Choose parameter** button.
Result: A pop-up appears.
9. On the pop-up, click the **three-dot** button
Result: A dropdown shows.
10. From the dropdown, select **Expressions**.
11. In the list of expressions, find the event expression you have created [earlier](/use-cases/group_products_by_category#group-sold-products-by-their-category-with-sku).
12. Click the **Choose parameter** button.
13. From the dropdown, select **Not equal**.
14. In the text field, enter `other`.
15. To select a specific time range, click the **calendar** icon.
16. Confirm your choice with the **Apply** button.
17. Save metrics.
**Decision Hub > Metrics > New mertic**.
2. Enter the name of the metric.
3. As a metric kind, select **Simple metric**.
4. As the aggregator, set **Count**.
5. As the occurrence type, set **All**.
6. From the Choose event dropdown list, select **product.buy** event.
7. Click **Where** button.
Result: The Choose parameter button appears.
8. Click the **Choose parameter** button.
Result: A pop-up appears.
9. On the pop-up, click the **three-dot** button
Result: A dropdown shows.
10. From the dropdown, select **Expressions**.
11. In the list of expressions, find the event expression you have created [earlier](/use-cases/group_products_by_category#group-sold-products-by-their-category-with-sku).
12. Click the **Choose parameter** button.
13. From the dropdown, select **Not equal**.
14. In the text field, enter `other`.
15. To select a specific time range, click the **calendar** icon.
16. Confirm your choice with the **Apply** button.
17. Save metrics.
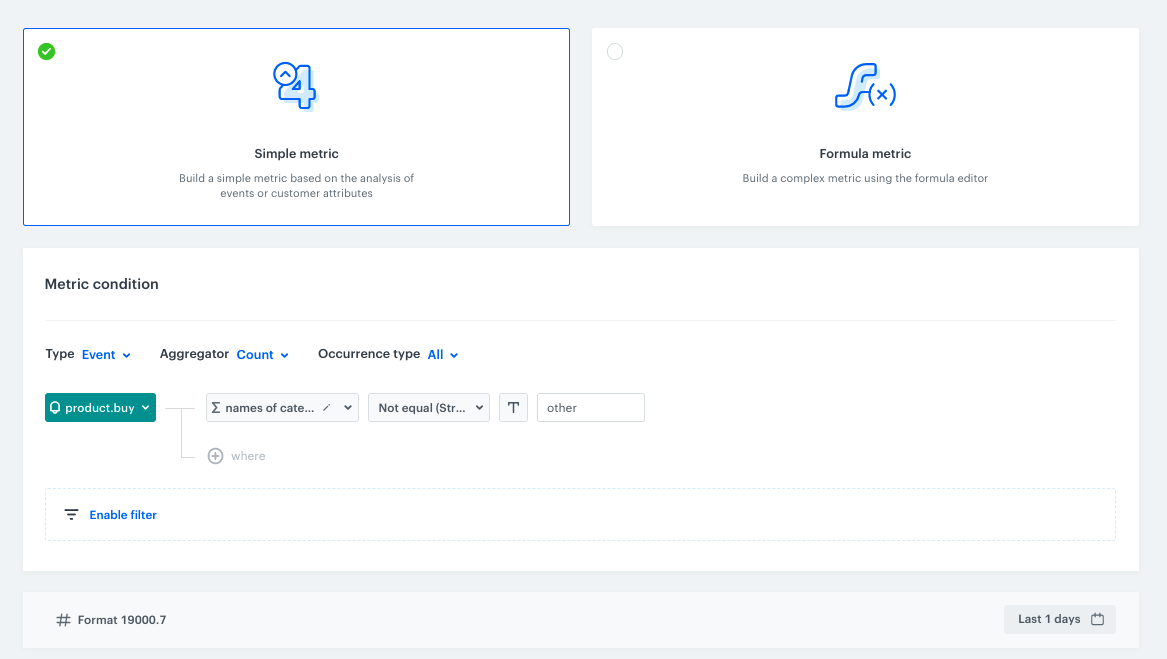
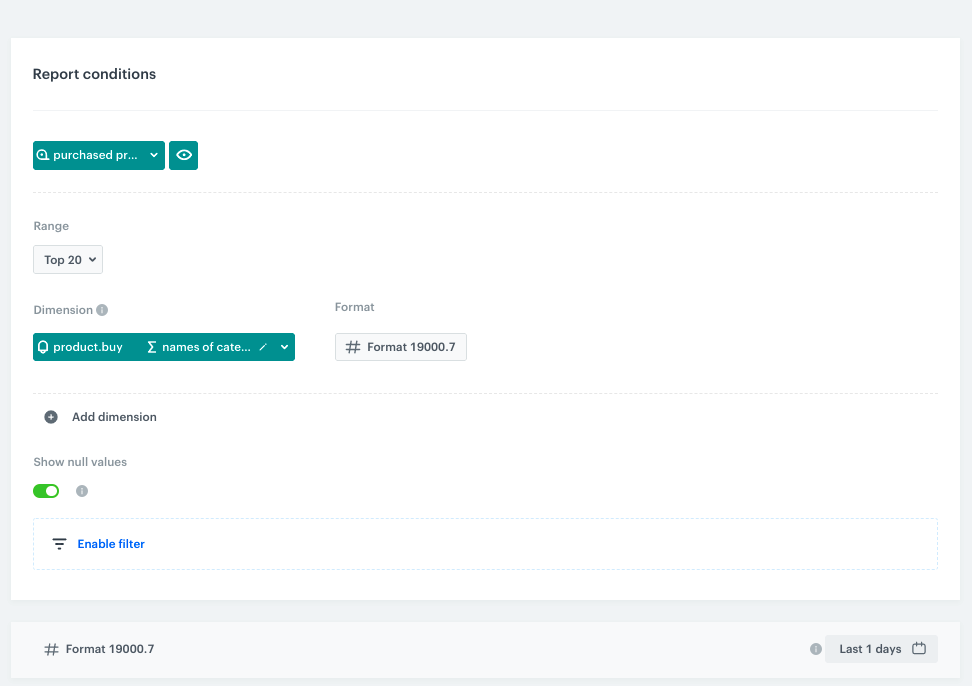
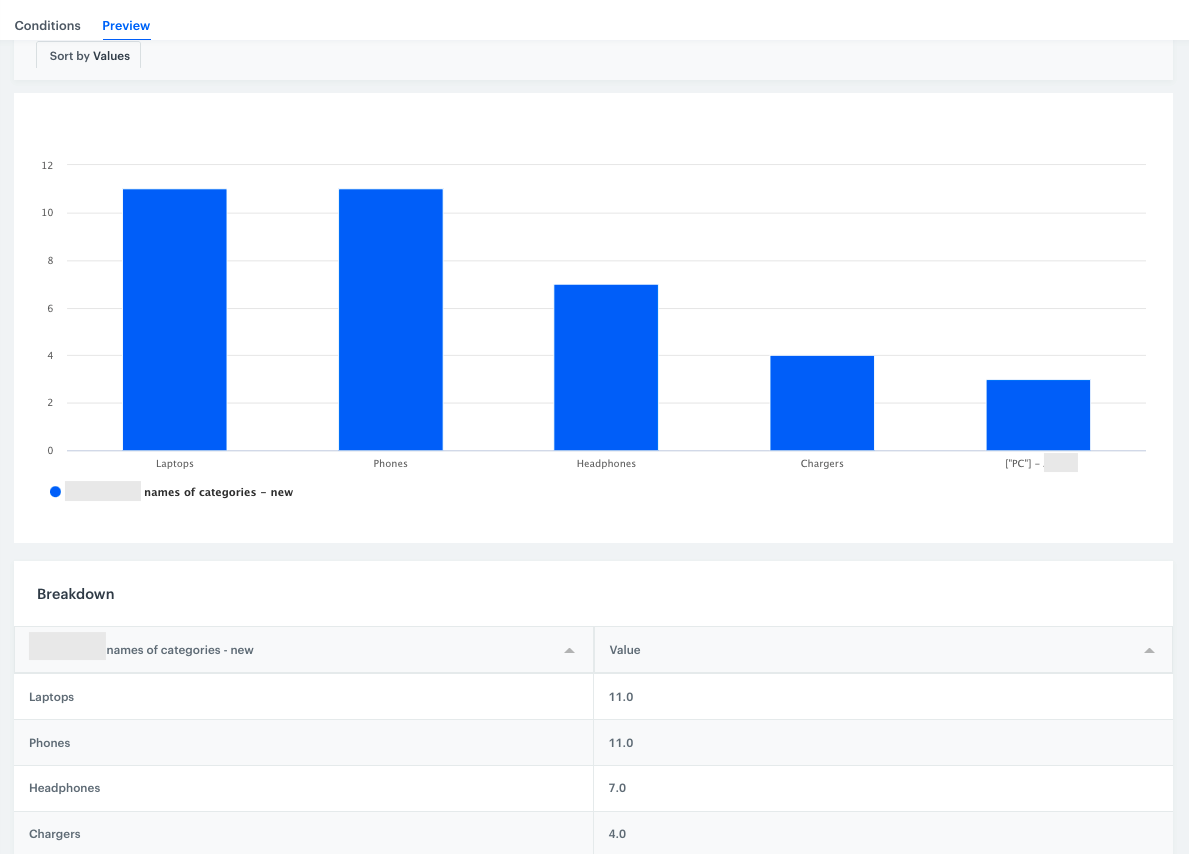
 **Automation Hub > Workflows > New workflow**.
2. Enter the name of the workflow.
### Define the Profile Event trigger node
At this stage, we will configure the conditions that launch the workflow. As a trigger, we will use the `transaction.charge` event.
1. As the first node of the workflow, add **Profile Event**. In the configuration of the node:
1. From **Choose event** dropdown menu, choose the `transaction.charge` event.
2. Click the **+ where** button and from the dropdown list, choose **shopID**.
3. From the **Choose operator** dropdown, select **Equal**.
4. In the text field, type the name of the **shopID**, as `POS4`.
5. Click the **+ where** button and from the dropdown list, choose **revenue**.
6. From the **Choose operator** dropdown, choose **More or equal to**.
7. In the text field enter `10`.
8. Click the **+ where button** and from the dropdown list, choose **TIMESTAMP**.
9. From the **Choose operator** dropdown, choose **Custom (Date)**.
10. Click **Select date range**.
11. Set the time range in which your promotion is active. In this use case, it will be one week.
2. Confirm by clicking **Apply**.
**Automation Hub > Workflows > New workflow**.
2. Enter the name of the workflow.
### Define the Profile Event trigger node
At this stage, we will configure the conditions that launch the workflow. As a trigger, we will use the `transaction.charge` event.
1. As the first node of the workflow, add **Profile Event**. In the configuration of the node:
1. From **Choose event** dropdown menu, choose the `transaction.charge` event.
2. Click the **+ where** button and from the dropdown list, choose **shopID**.
3. From the **Choose operator** dropdown, select **Equal**.
4. In the text field, type the name of the **shopID**, as `POS4`.
5. Click the **+ where** button and from the dropdown list, choose **revenue**.
6. From the **Choose operator** dropdown, choose **More or equal to**.
7. In the text field enter `10`.
8. Click the **+ where button** and from the dropdown list, choose **TIMESTAMP**.
9. From the **Choose operator** dropdown, choose **Custom (Date)**.
10. Click **Select date range**.
11. Set the time range in which your promotion is active. In this use case, it will be one week.
2. Confirm by clicking **Apply**.
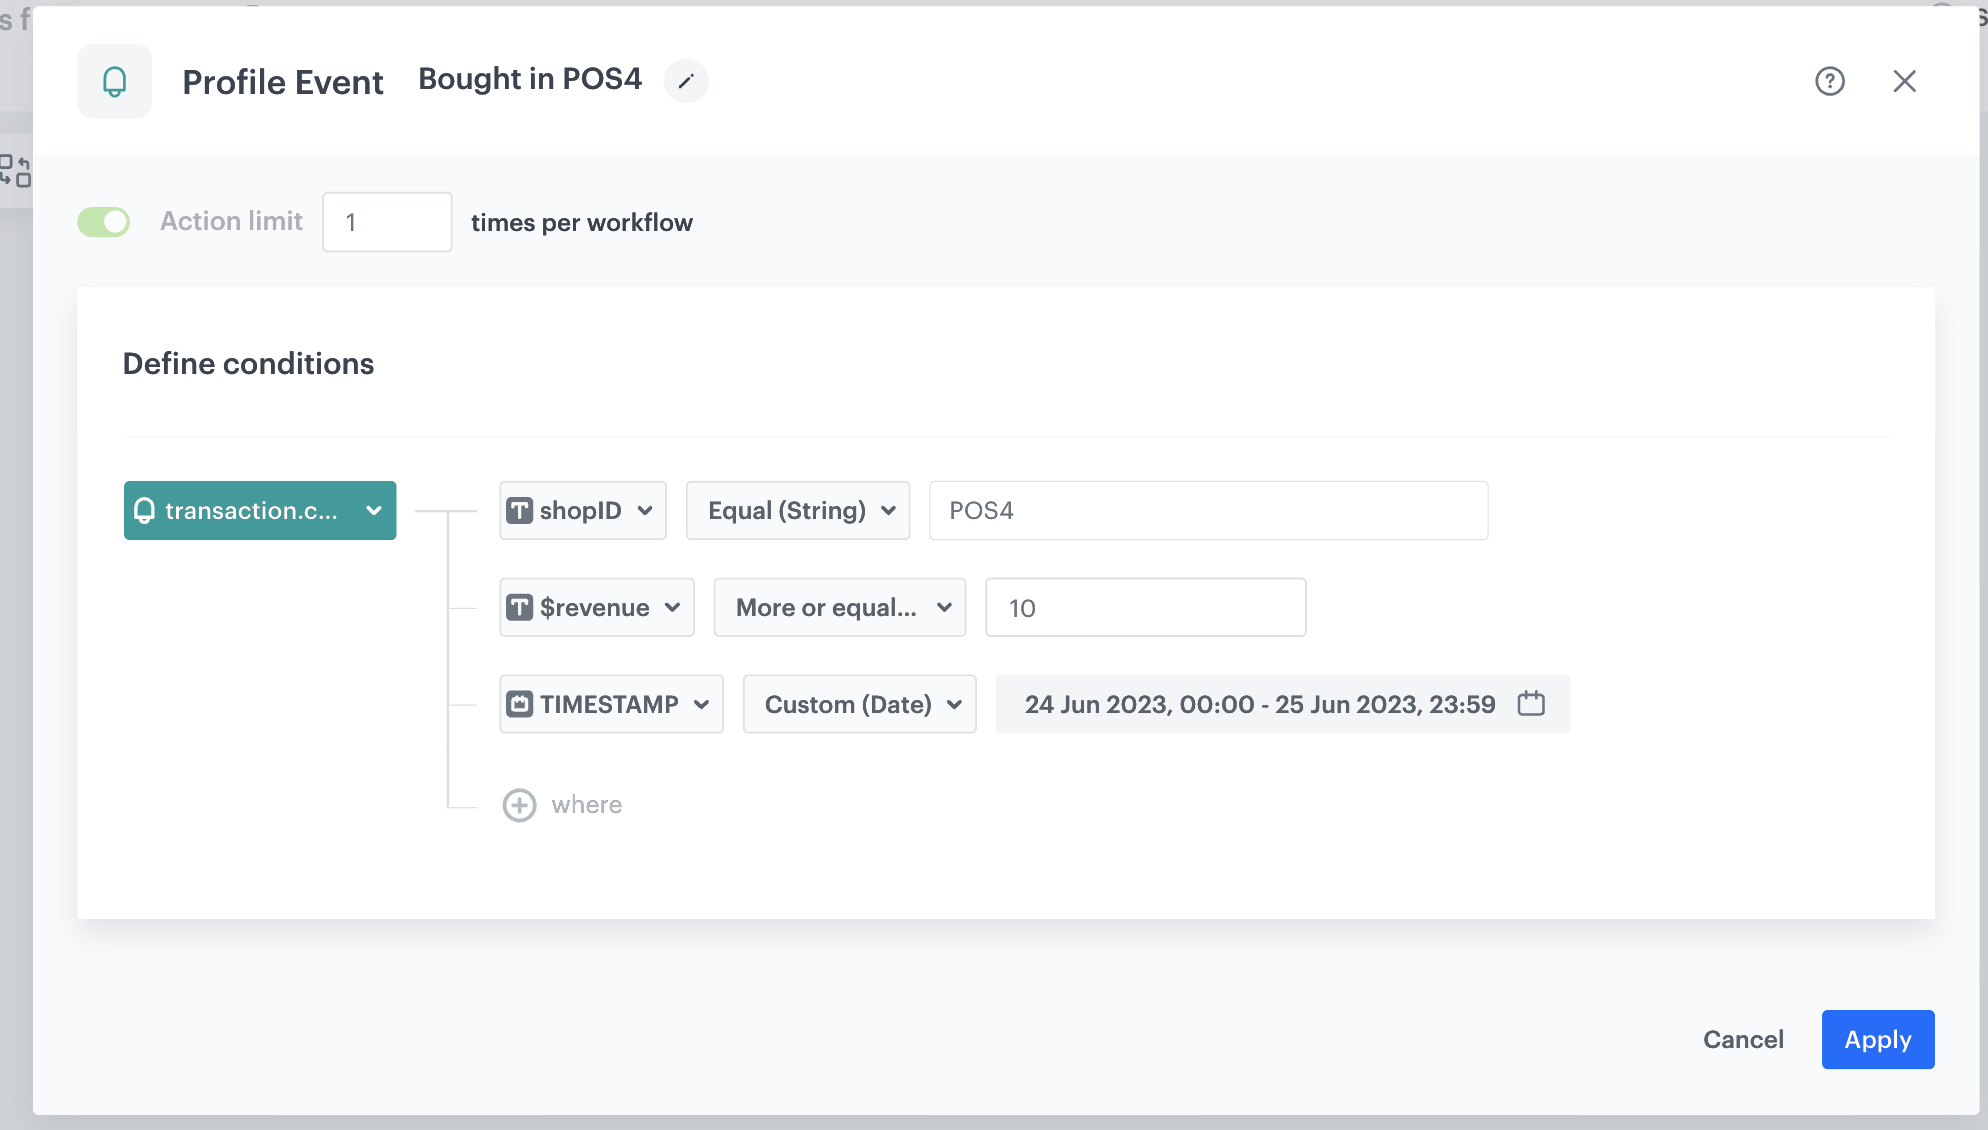
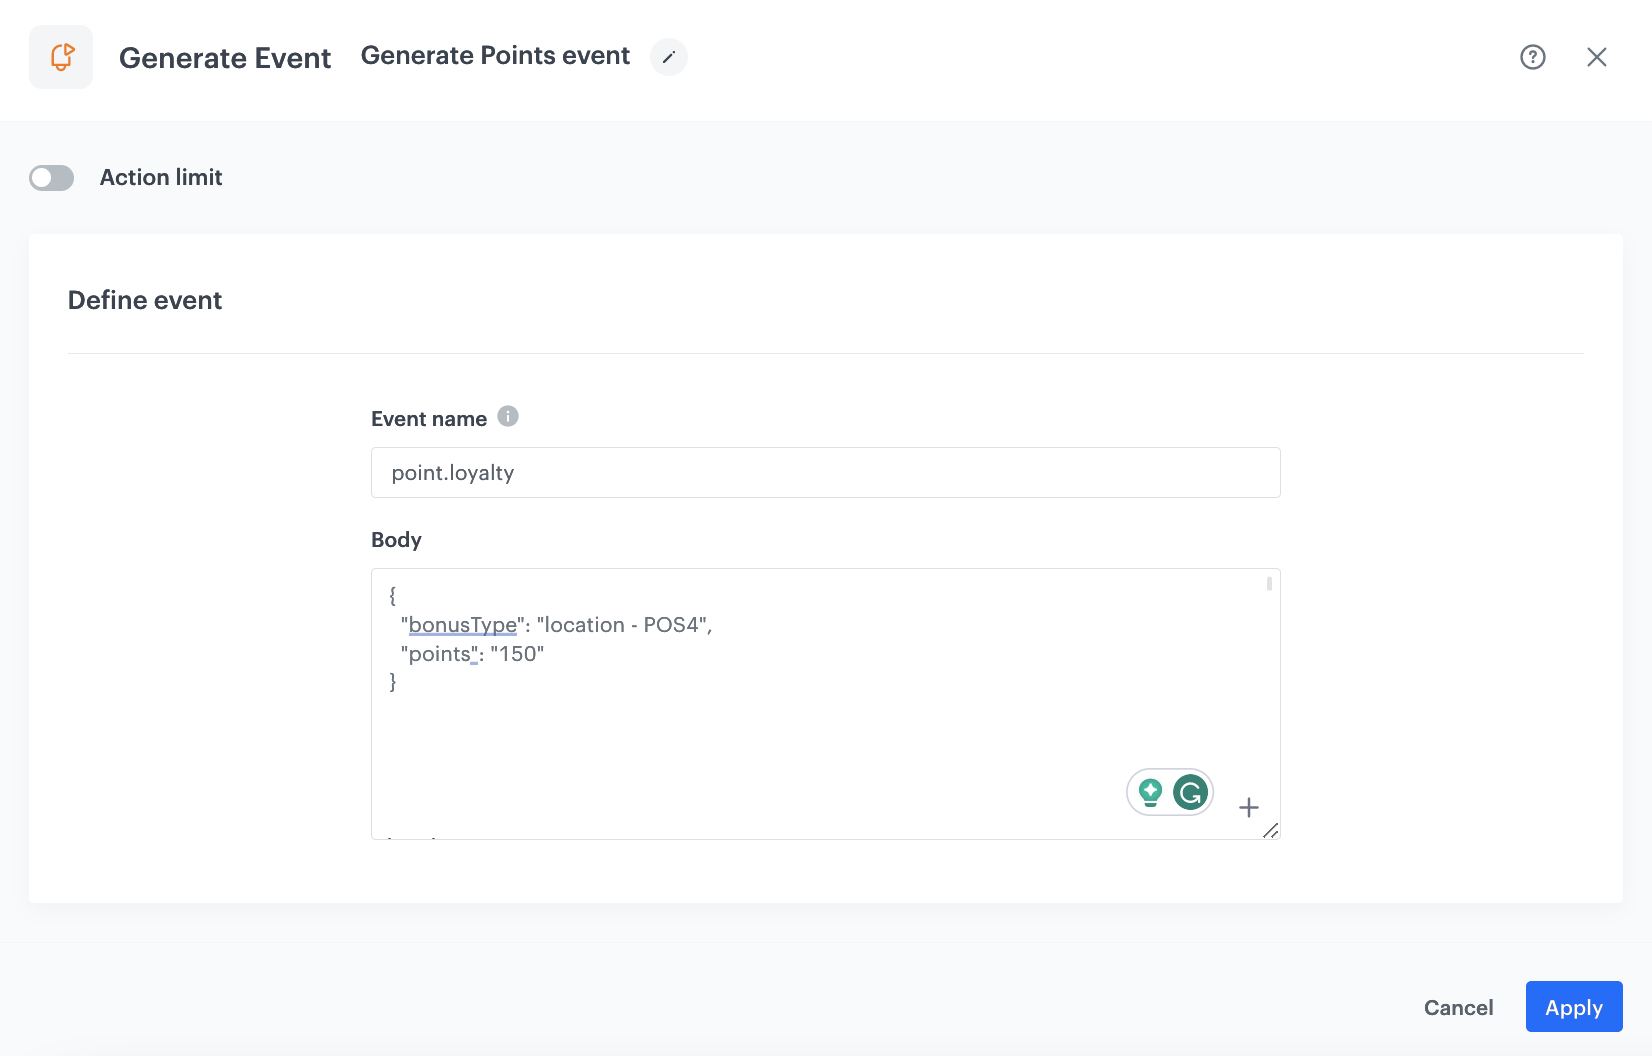
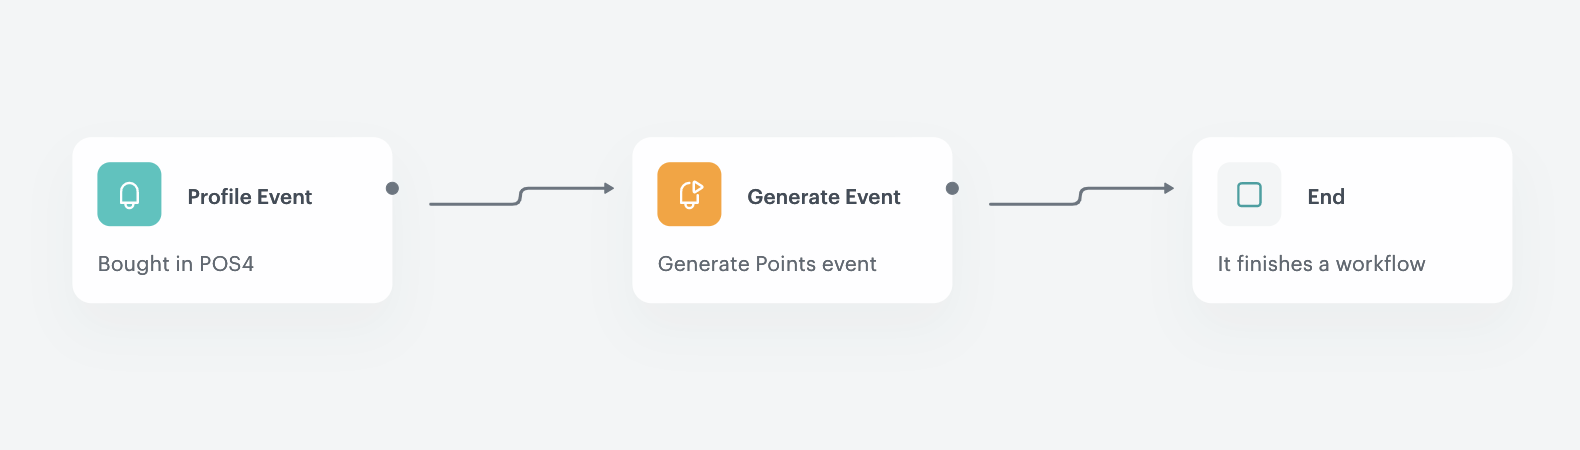
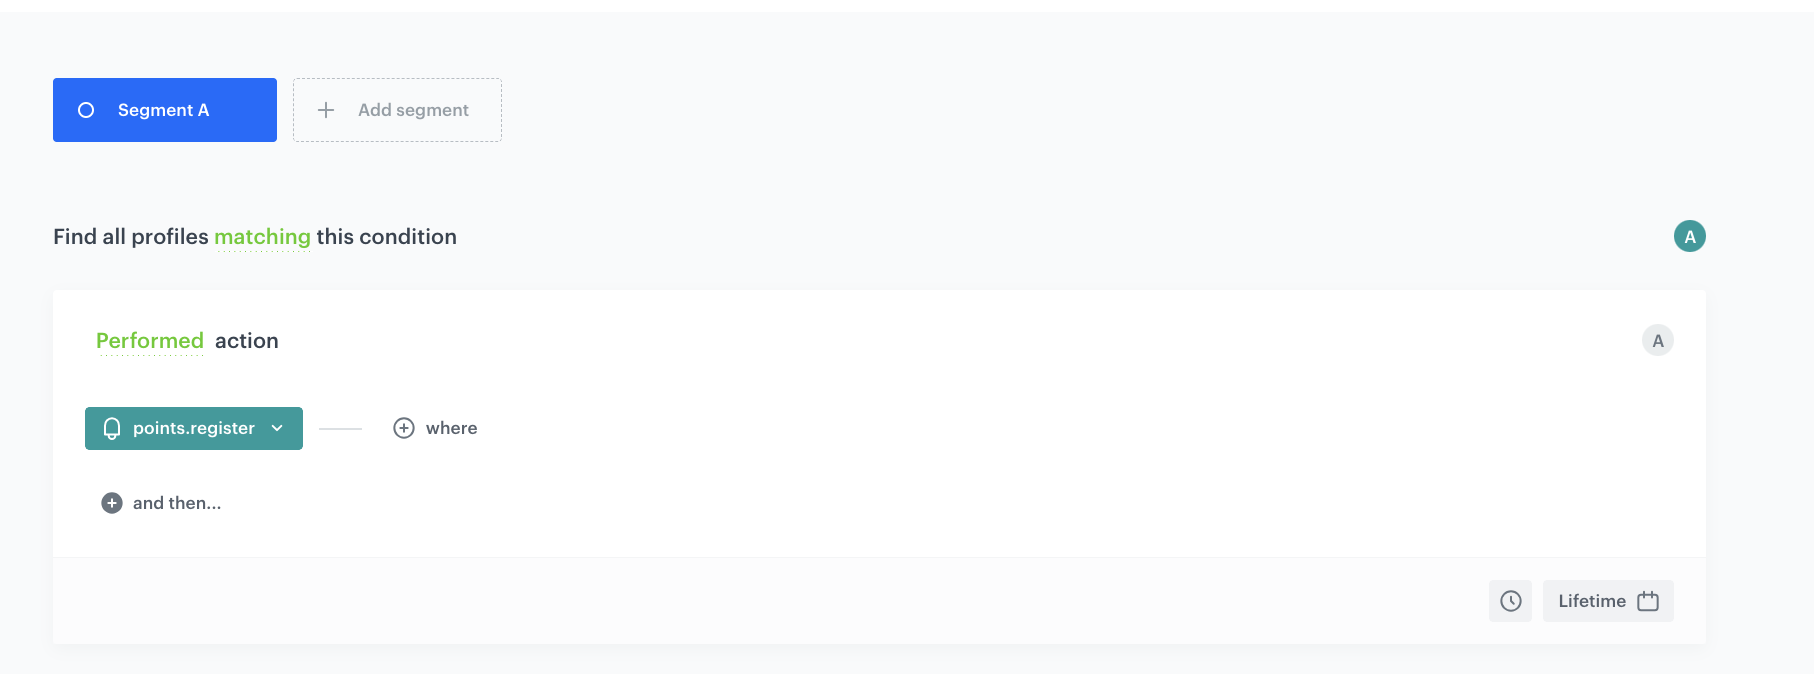
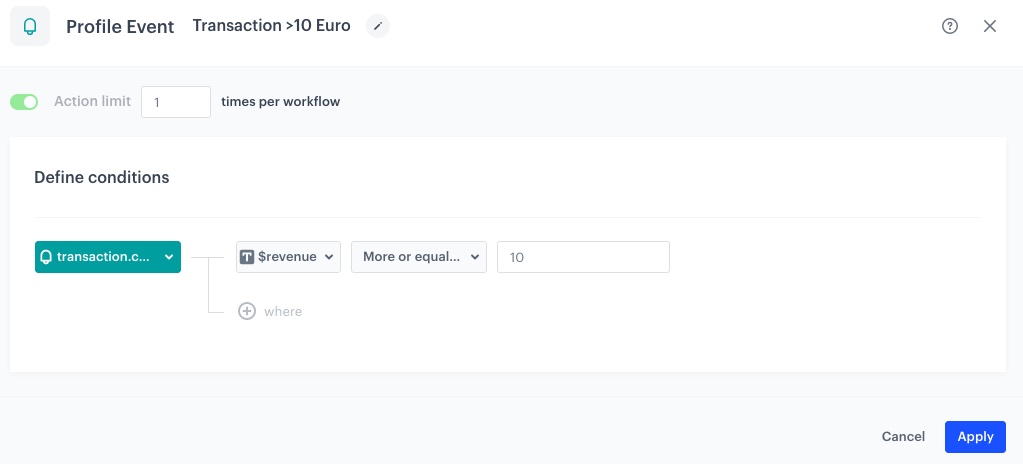
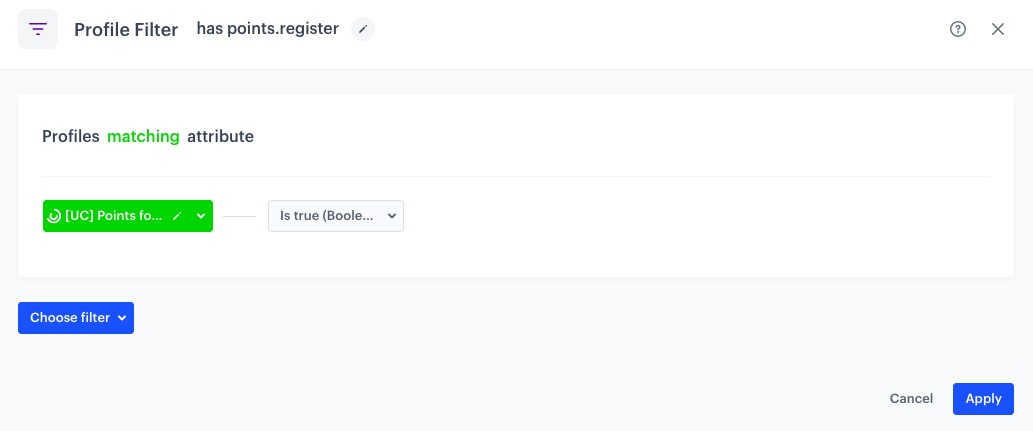
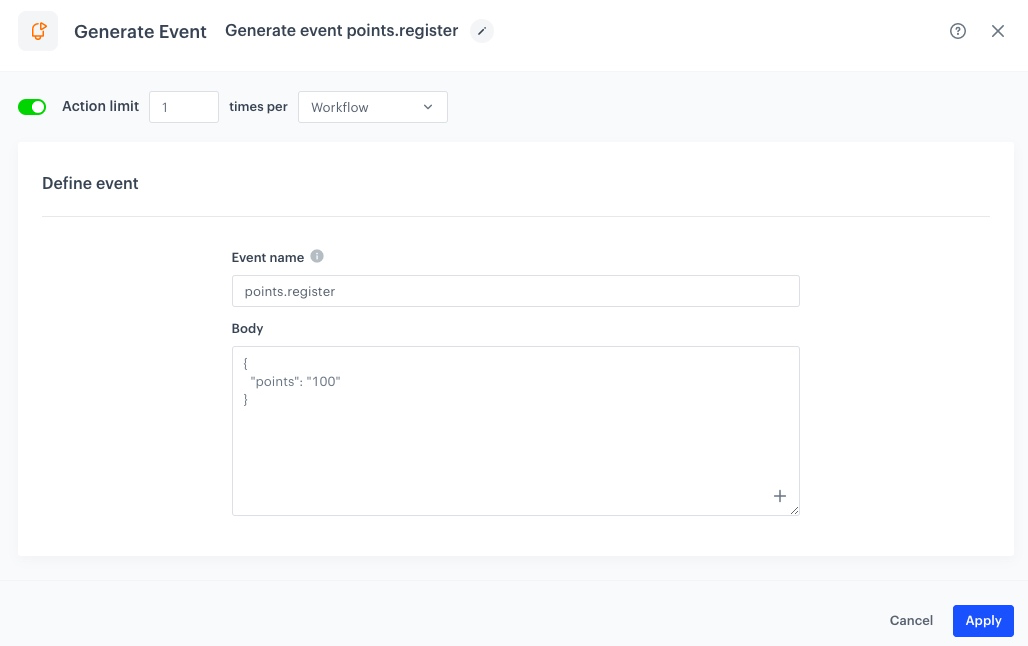
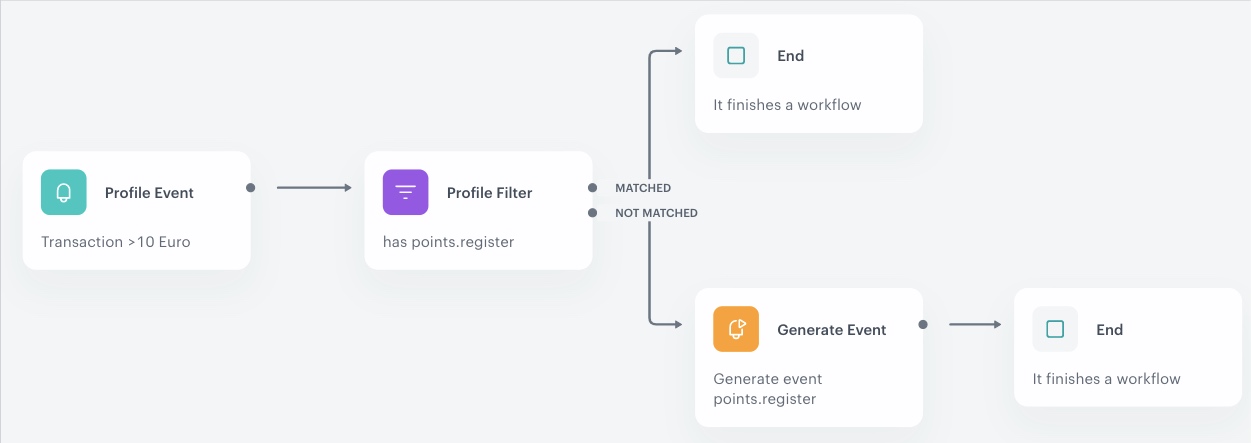
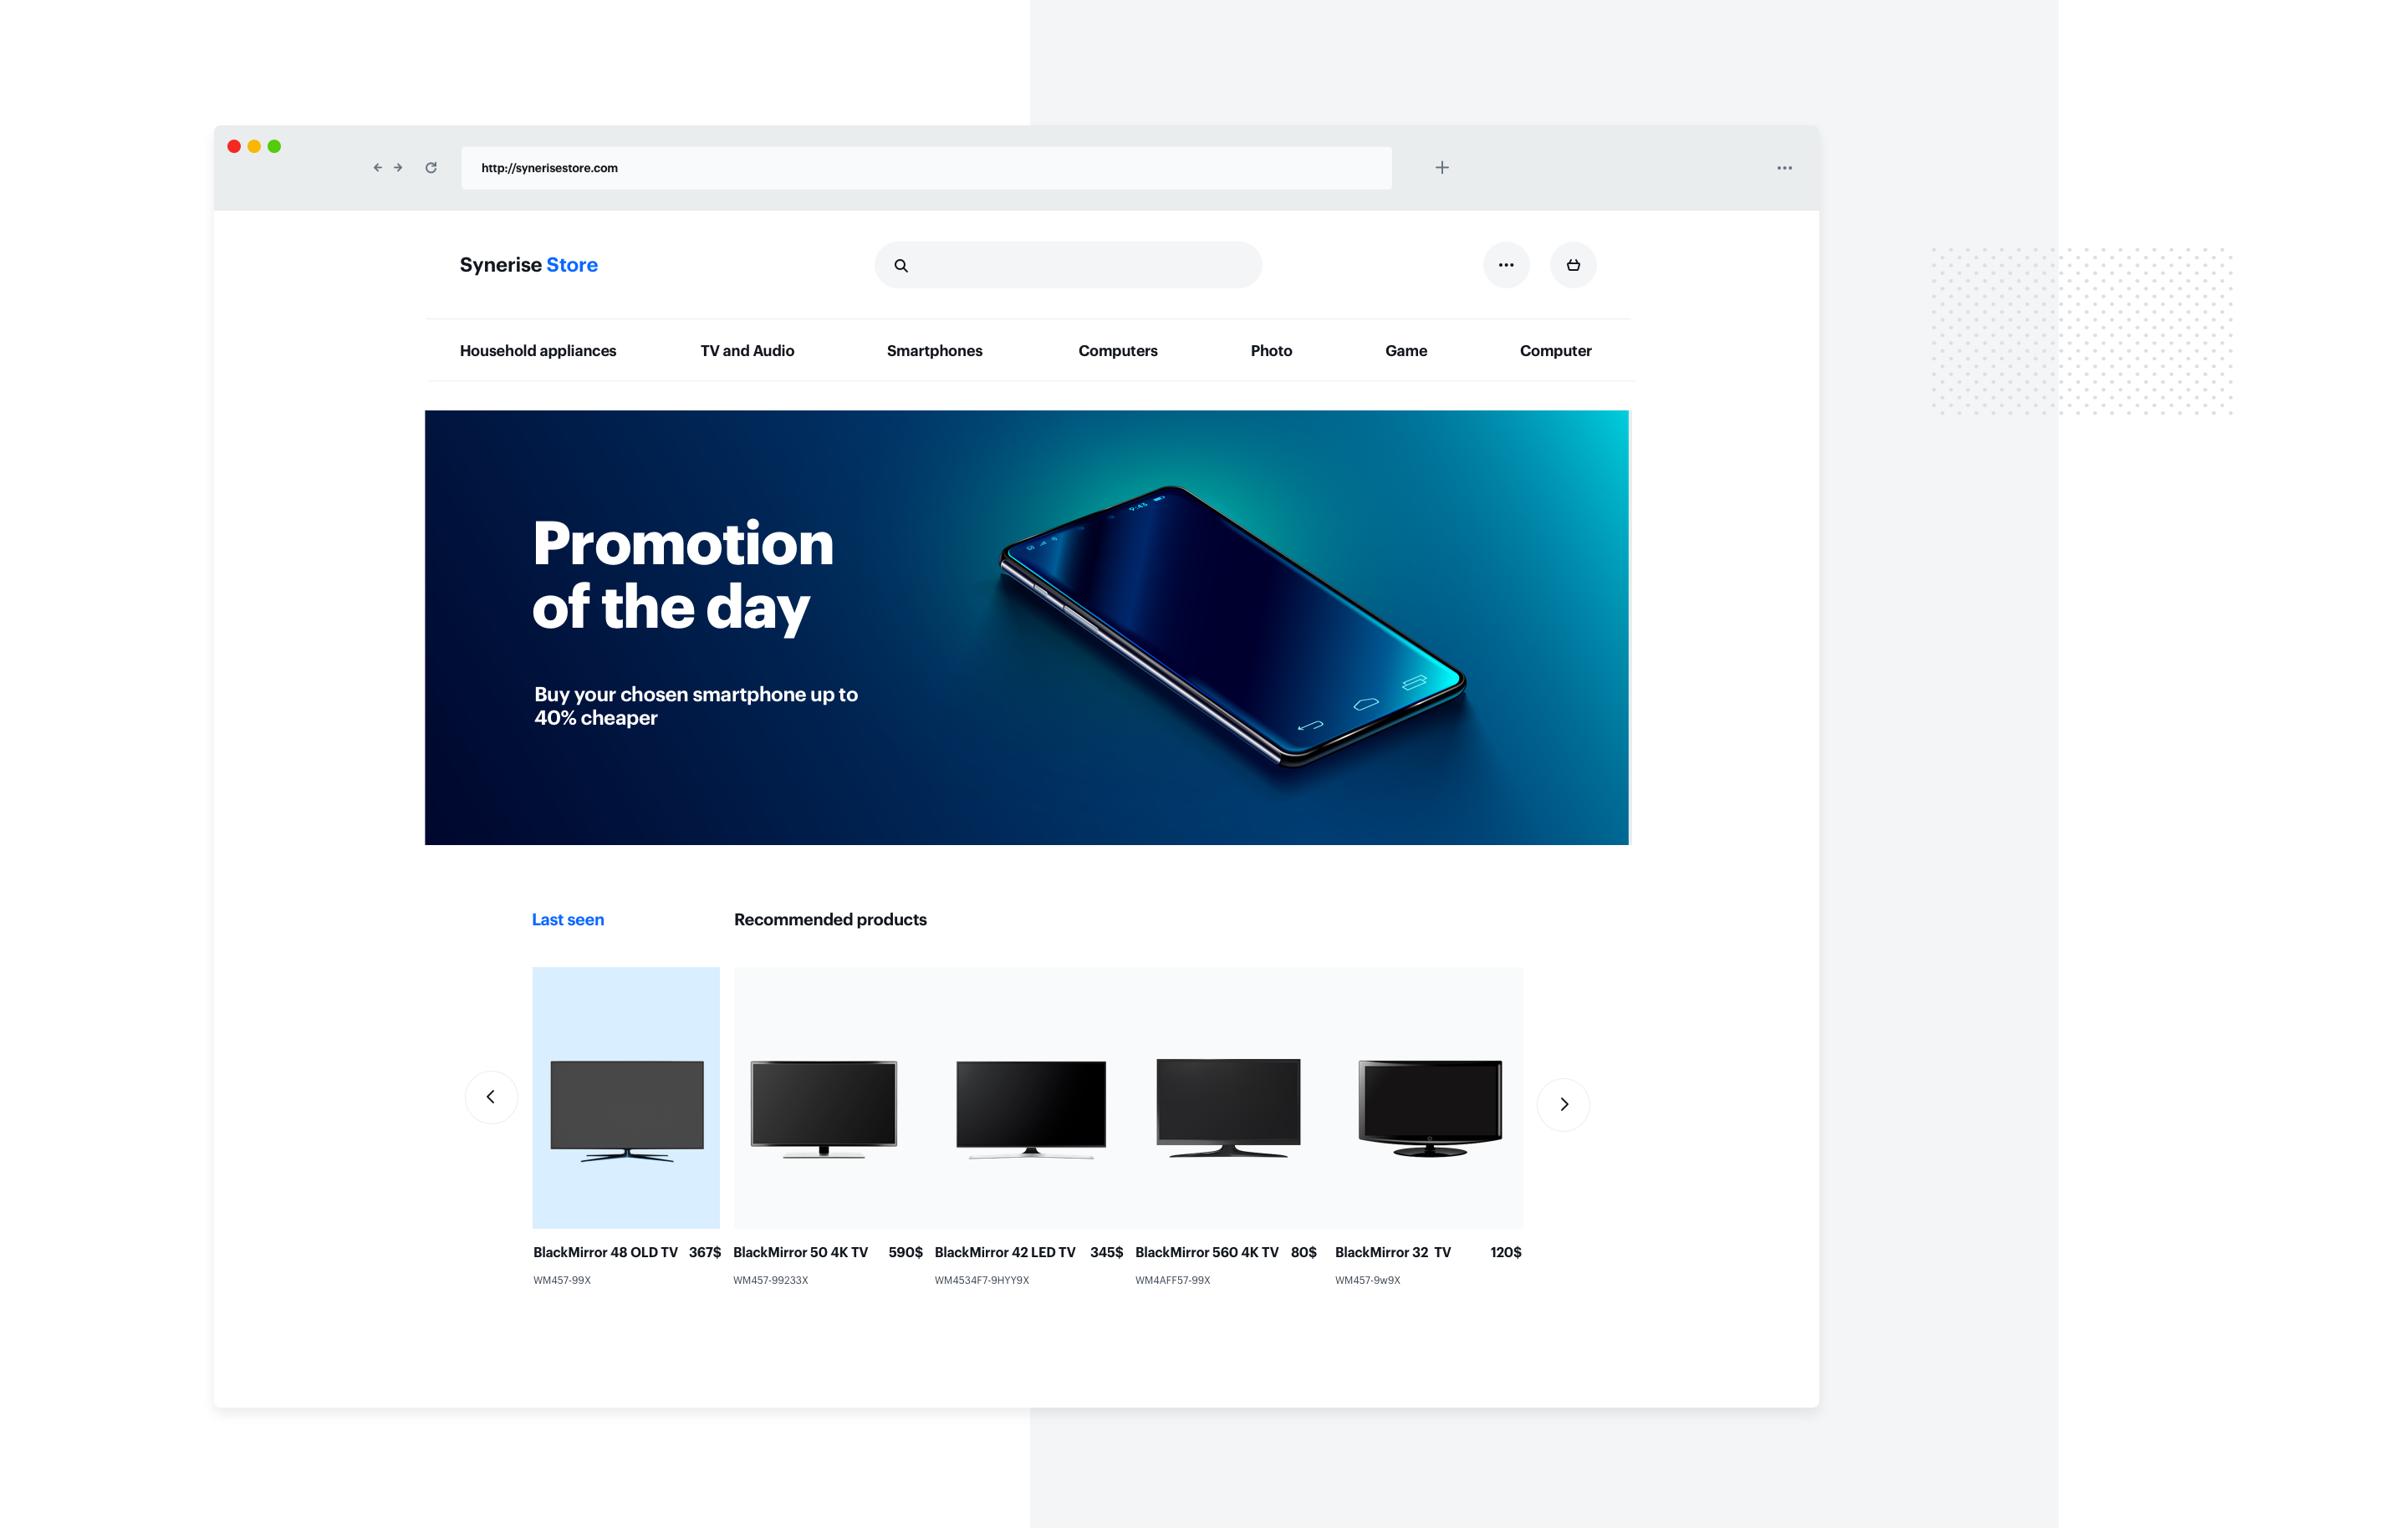
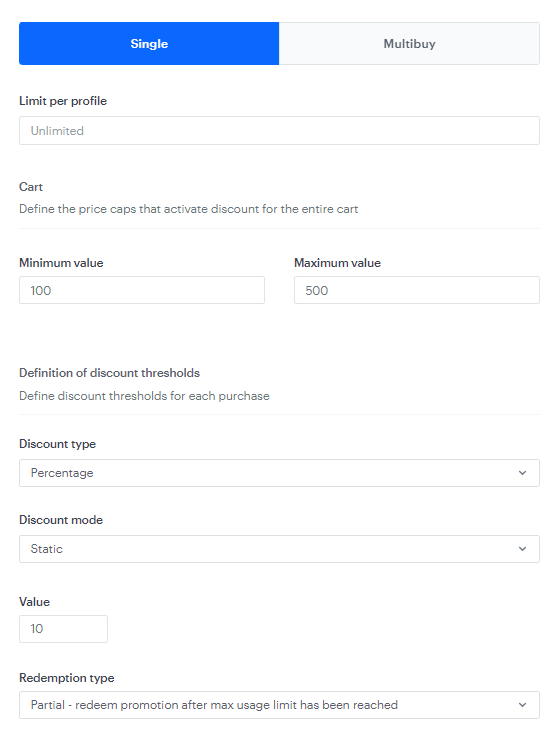
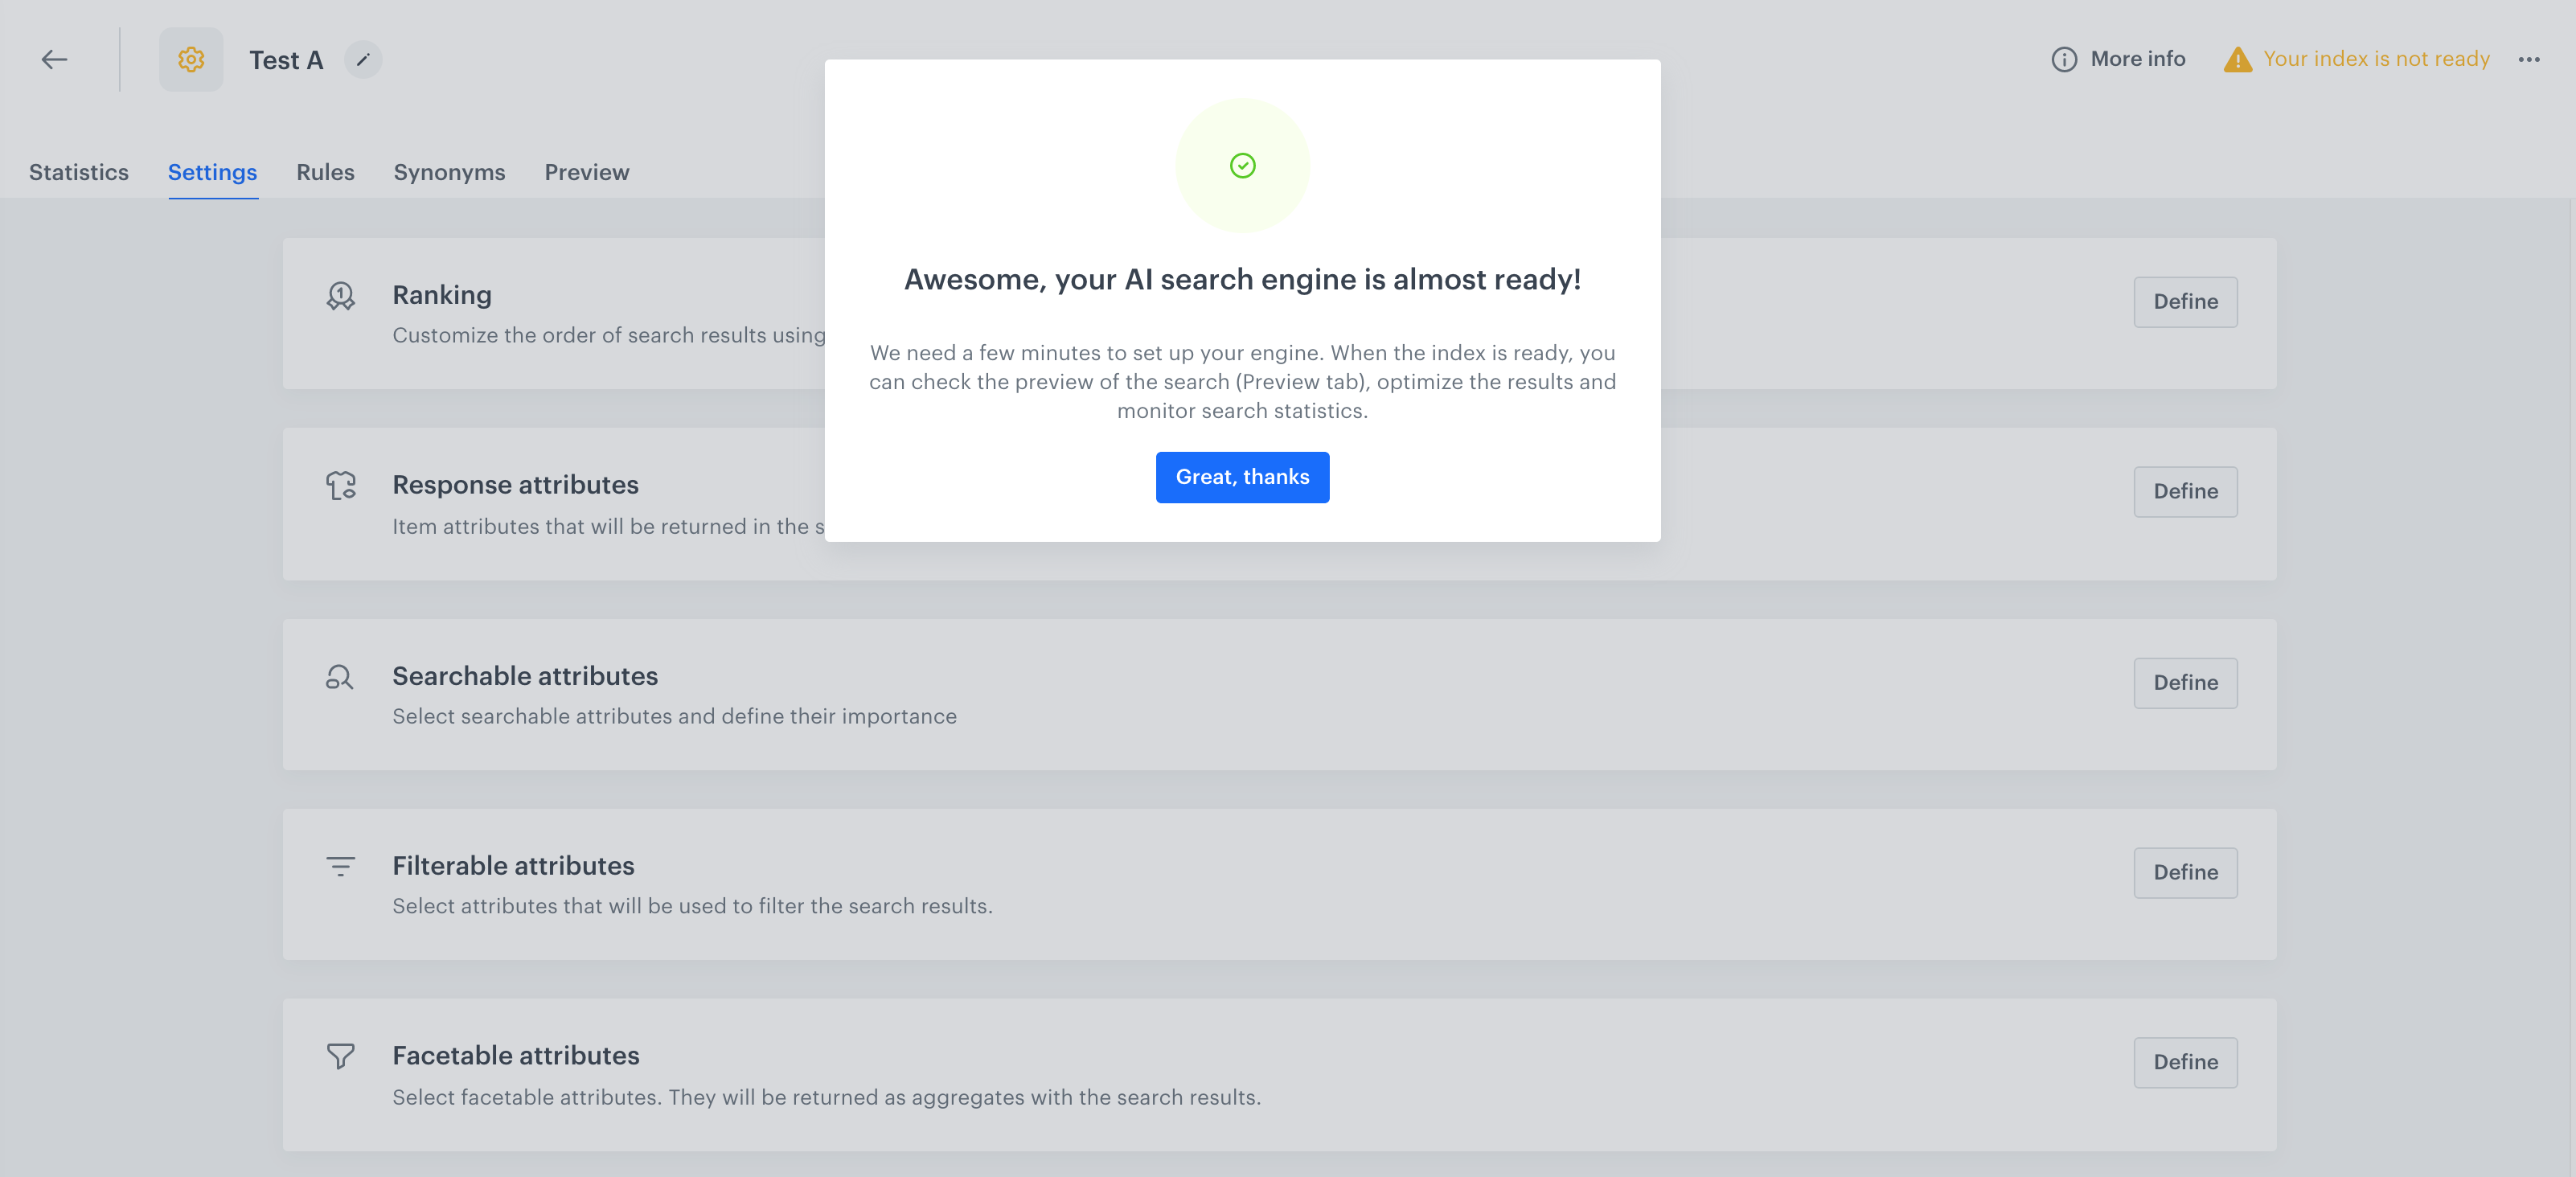
 .
7. From the **Index** dropdown list, select the second index you created in the previous part of the process. You can rename the tab for better management of the versions.
8. In the **Customer allocation** section, assign the percentage of customers to each variant.
9. Confirm the settings by clicking **Apply**.
10. Click **Save&Run**.
After some time you can [check the statistics of the A/B test](/use-cases/ai-search-ab-test#analyze-results).
## Analyze results
---
When the A/B tests has been running for long enough, you can analyze the statistics for each variant.
1. Go to
.
7. From the **Index** dropdown list, select the second index you created in the previous part of the process. You can rename the tab for better management of the versions.
8. In the **Customer allocation** section, assign the percentage of customers to each variant.
9. Confirm the settings by clicking **Apply**.
10. Click **Save&Run**.
After some time you can [check the statistics of the A/B test](/use-cases/ai-search-ab-test#analyze-results).
## Analyze results
---
When the A/B tests has been running for long enough, you can analyze the statistics for each variant.
1. Go to