Different data between analytics modules (trend)
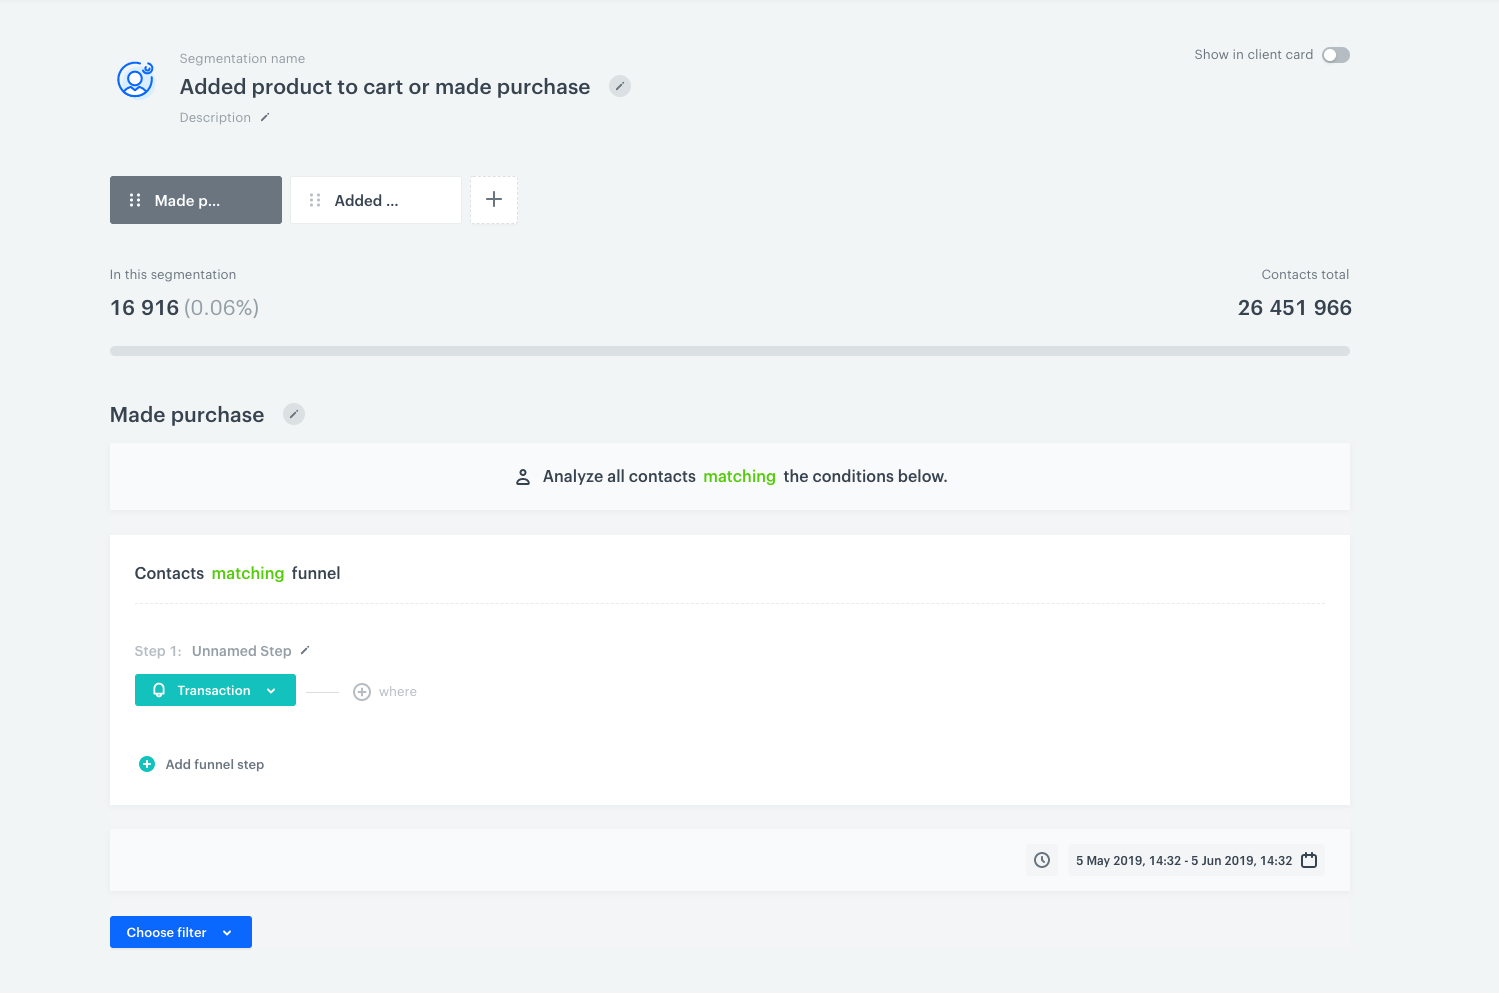
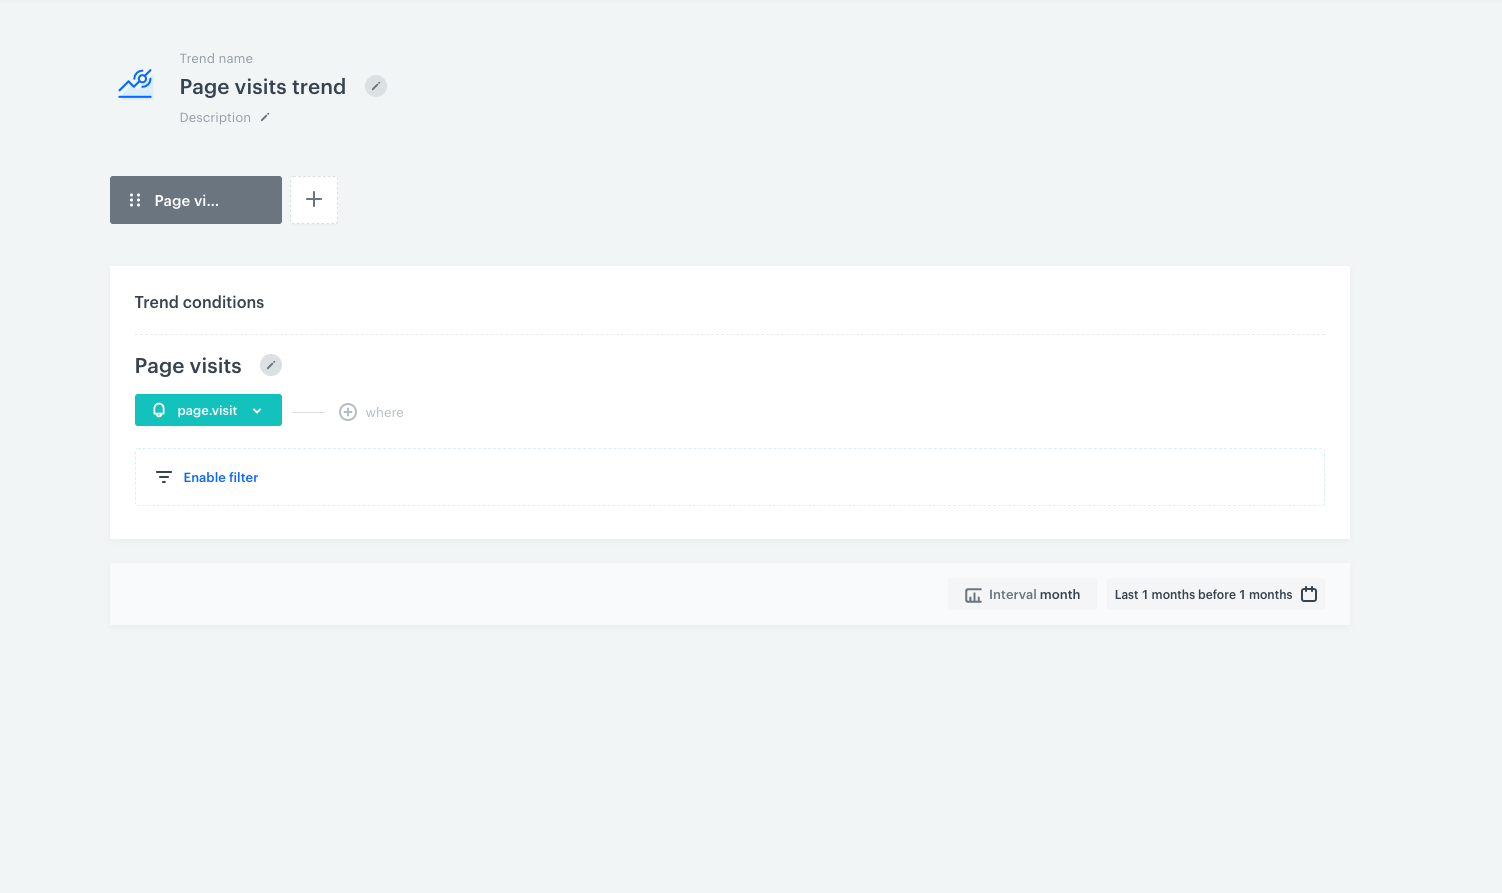
To better understand this difference, look at the example below. We're creating a simple query which shows us page visit events and customers who performed this action.
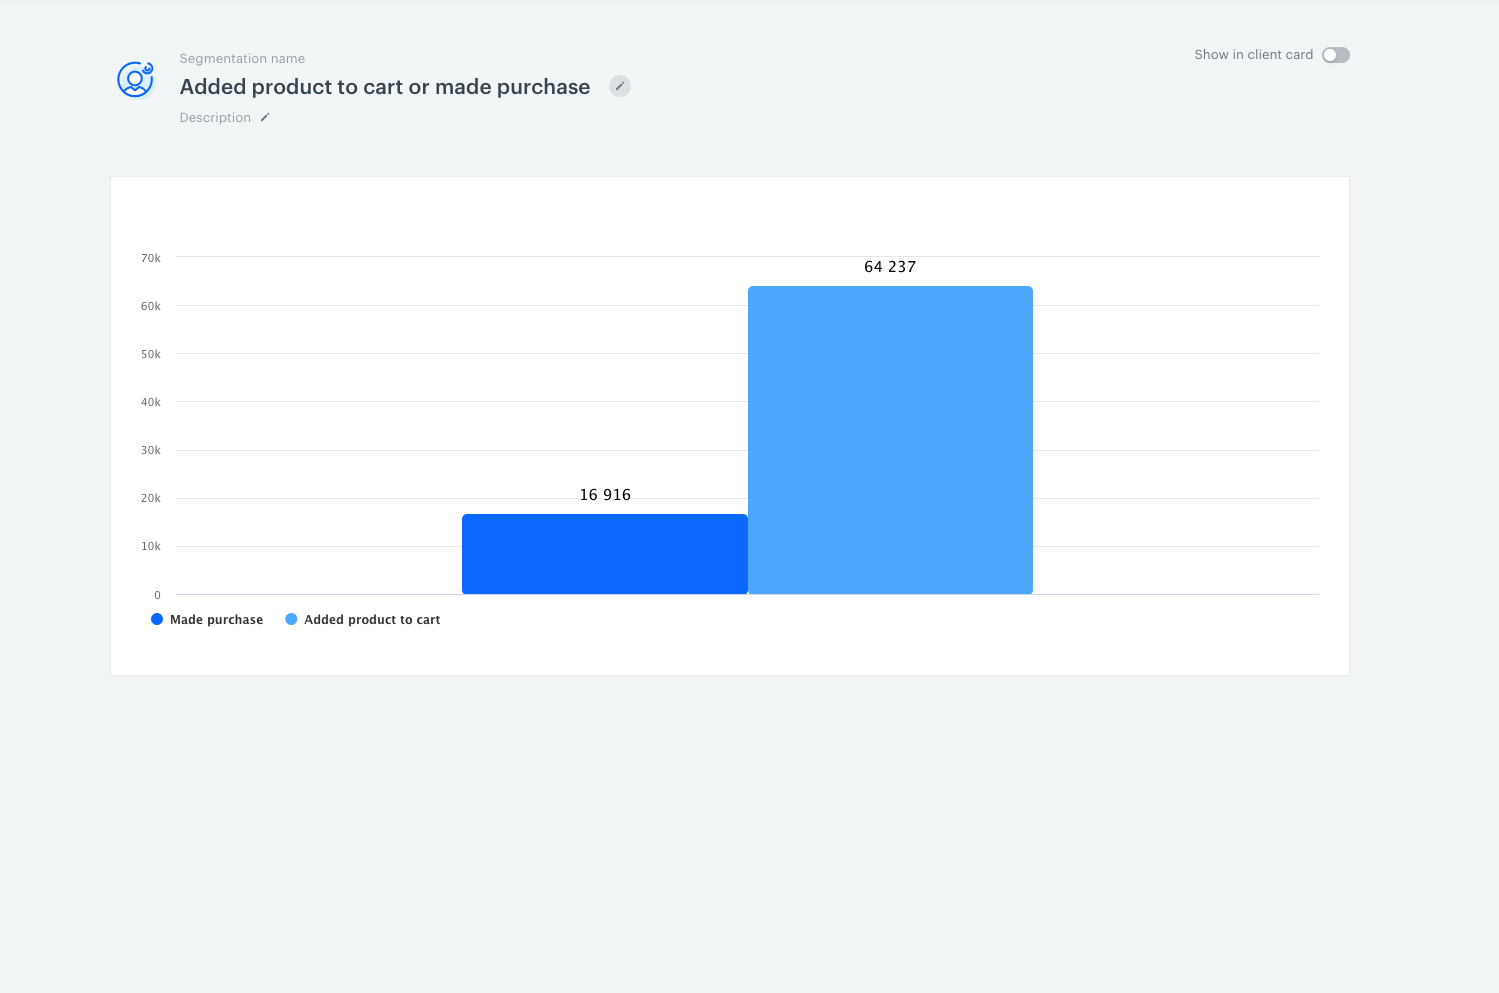
- Click the Preview button. You will see the trend presenting customers who have visited the page (in monthly intervals). In this case, we've got 284,119 customers with page visit events in May.
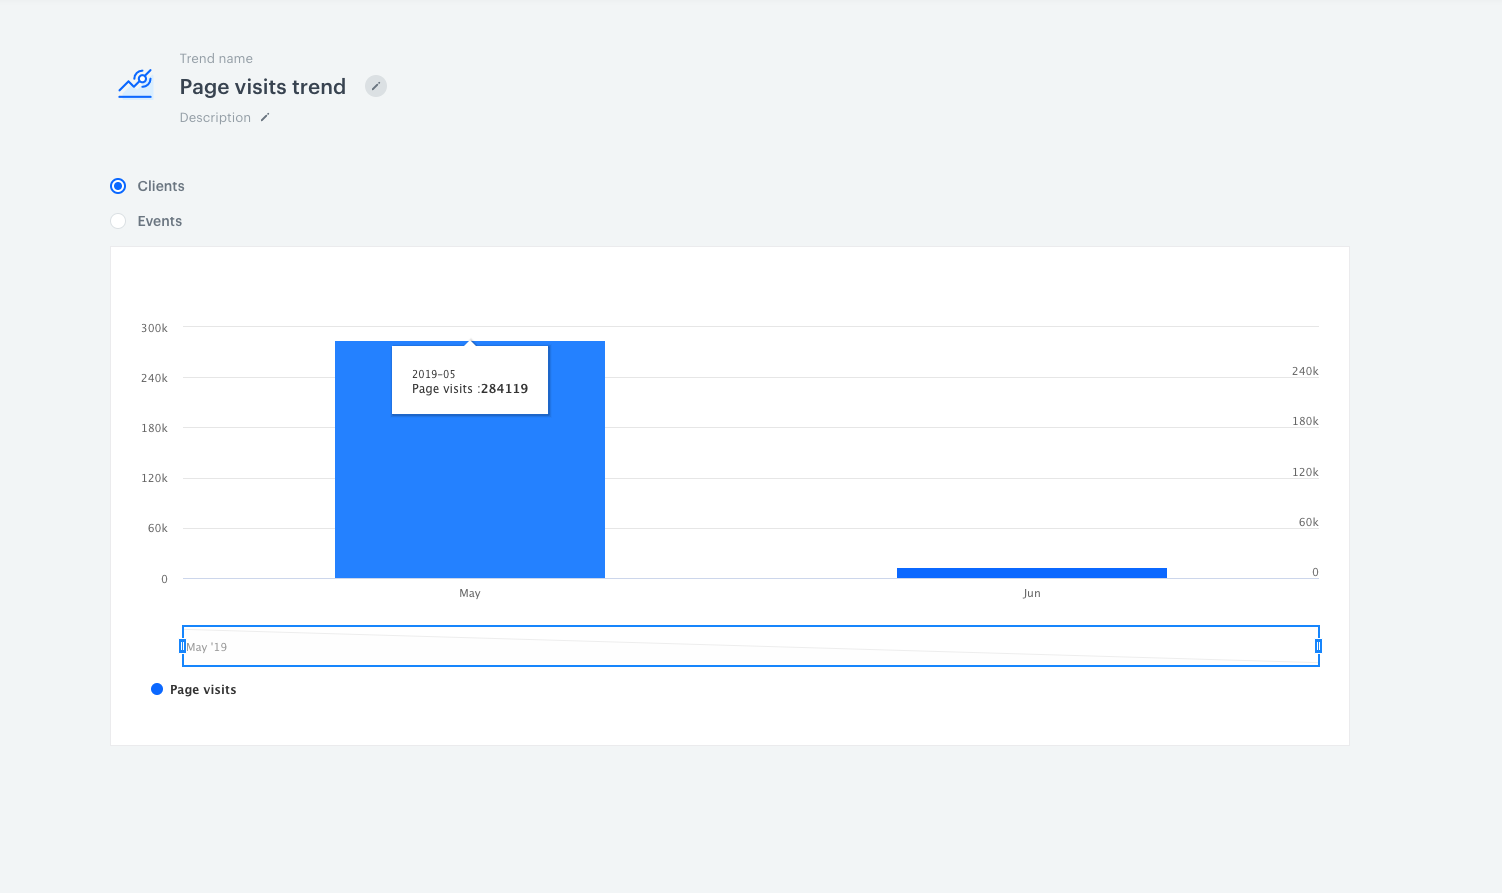
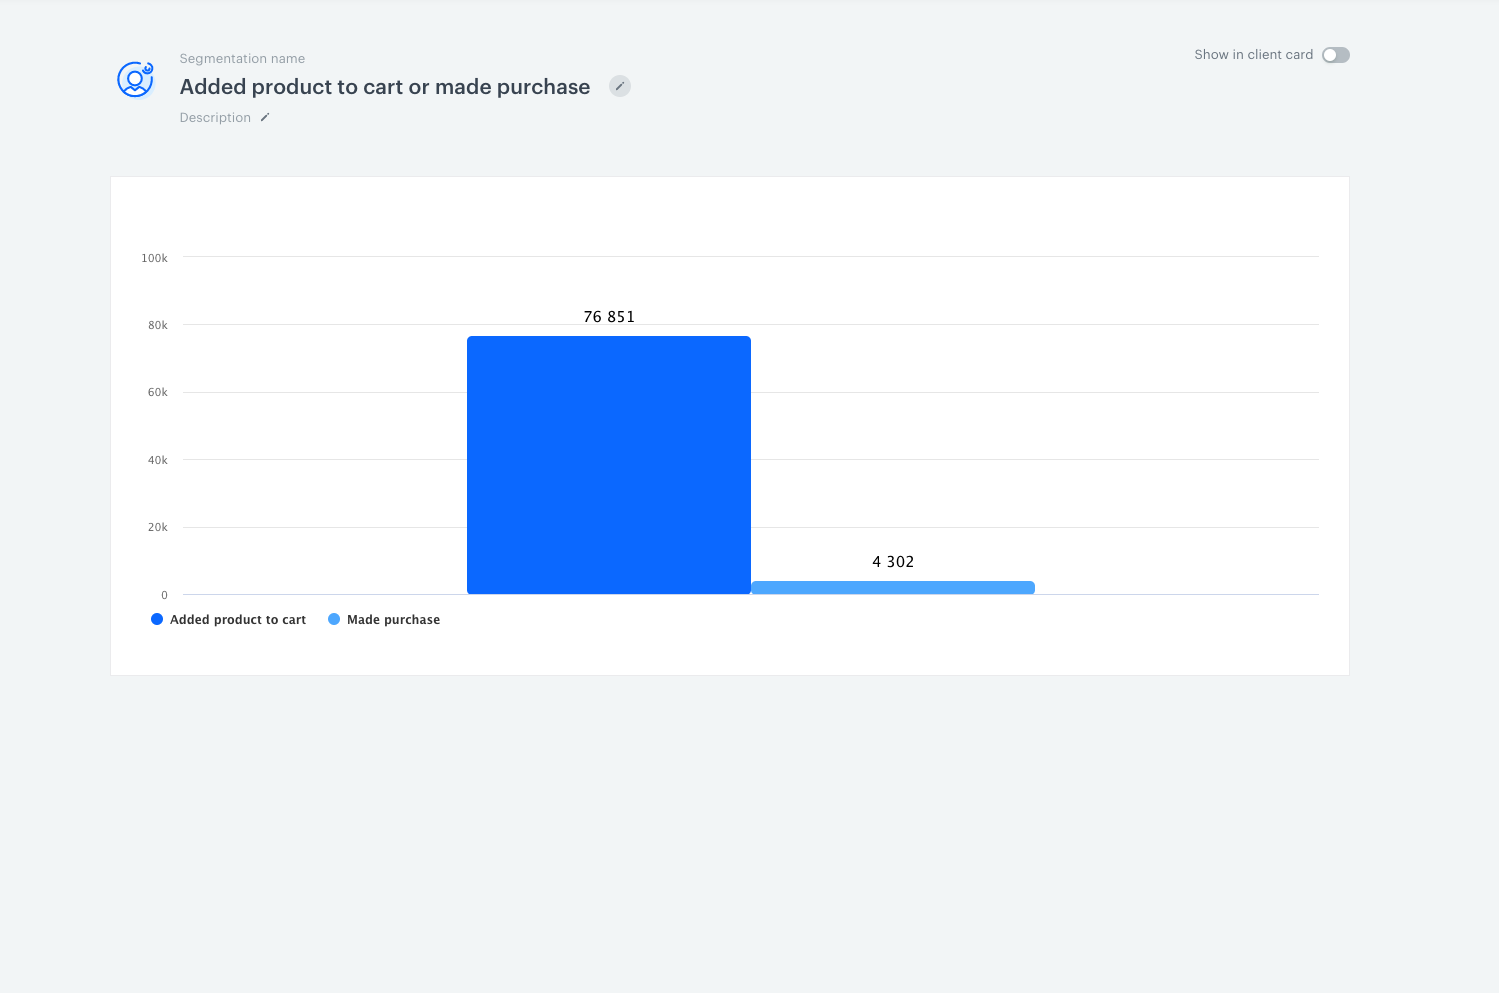
- To change the context tick the Events radio button.

In response to the same query, the chart shows that 737,545 page visit events have been recorded in May. This means that 284,119 clients generated 737,545 actions (page visits).
Yoi will find more information about segmentations at the link.