You can calculate the duration of the last session of a customer on a website by creating aggregates and expressions.
## Prerequisites
---
- Implement [tracking code](/developers/web/installation-and-configuration#creating-a-tracking-code) on your website.
## Process
---
In this use case, you will go through the following steps:
1. [Create an aggregate](/use-cases/calculate-time-spent-on-website#create-aggregates) that return the timestamps of the session start and session end events.
2. [Create an expression](/use-cases/calculate-time-spent-on-website#create-an-expression) that deducts the time of session start from the session end.
## Create aggregates
---
As the first part of the process, create aggregates that return the timestamps of the session start and session end events.
### Session start time
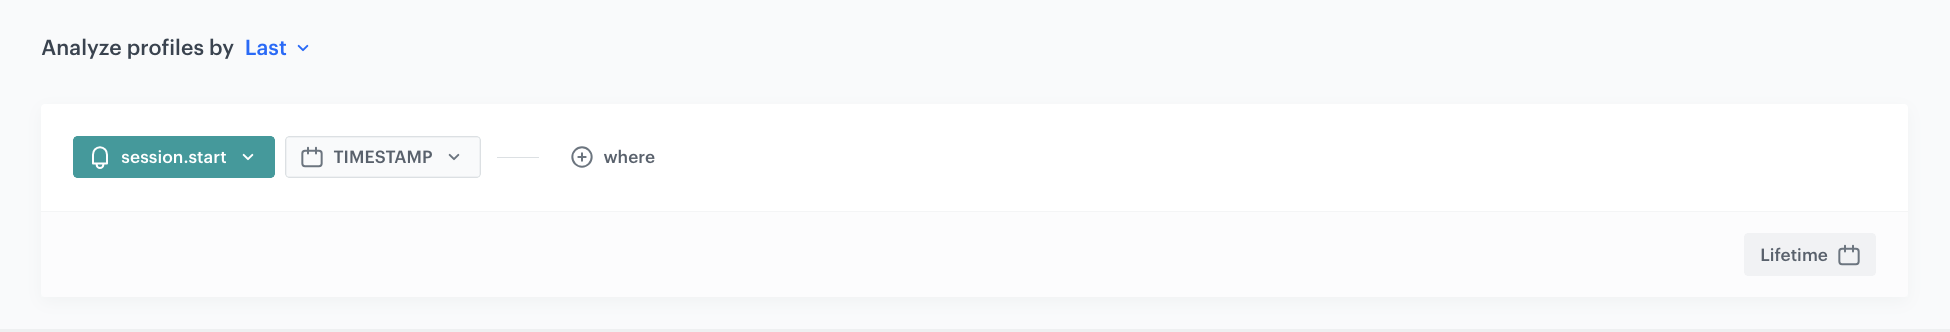
In this part of the process, create an aggregate that collects session start times.
1. Go to **Behavioral Data Hub > Live Aggregates > Create aggregate**.
2. As the aggregate type, select **Profile**.
2. Enter the name of the aggregate.
3. Set **Aggregate** to **Last**.
4. From the **Choose event** dropdown list, select **session.start**.
5. Click **+ where**.
6. On the modal, click and select **Specials**.
7. From the dropdown list, select **TIMESTAMP**.
8. In the date range, select **Lifetime**.
9. Save the aggregate.
The configuration of the start session aggregate
### Session end time
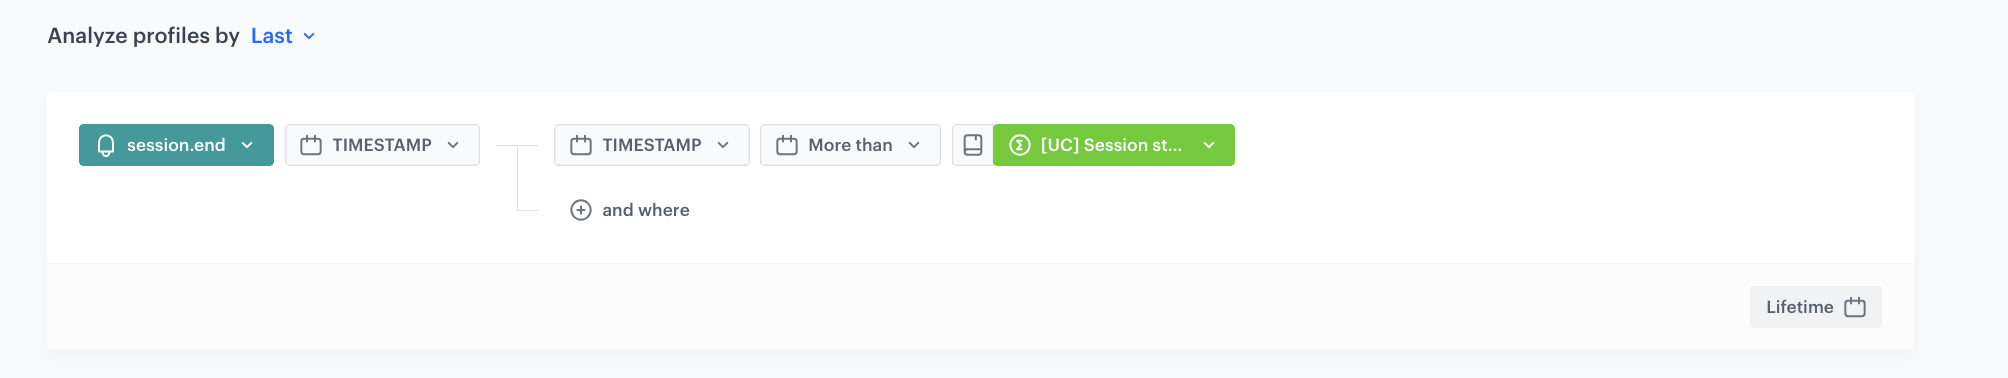
In this part of the process, create an aggregate that collects session end times with a condition that the end time is later than the start time.
1. Go to **Behavioral Data Hub > Live Aggregates > Create aggregate**.
2. As the aggregate type, select **Profile**.
2. Enter the name of the aggregate.
3. Set the **Aggregate** to **Last**.
4. From the **Choose event** dropdown list, select **session.end**.
5. Click **+ where**.
6. On the modal, click and select **Specials**.
7. From the dropdown list, select **TIMESTAMP**.
8. Click **+ where**.
9. On the modal, click and select **Specials**.
10. From the dropdown list, select **TIMESTAMP**.
11. As the logical operator, select **Date**, and then select **More than**.
12. Click the icon next to the logic operator and keep clicking until you get .
13. Click **Choose values**.
14. Use the search box to find the **Session start** aggregate you created in the previous part of the process.
8. In the date range, select **Lifetime**.
9. Save the aggregate.
The configuration of the end session aggregate
## Create an expression
---
In this part of the process, create an expression that deducts the time of session start from the session end.
1. Go to **Behavioral Data Hub > Expression > New expression**.
2. Enter the name of the expression.
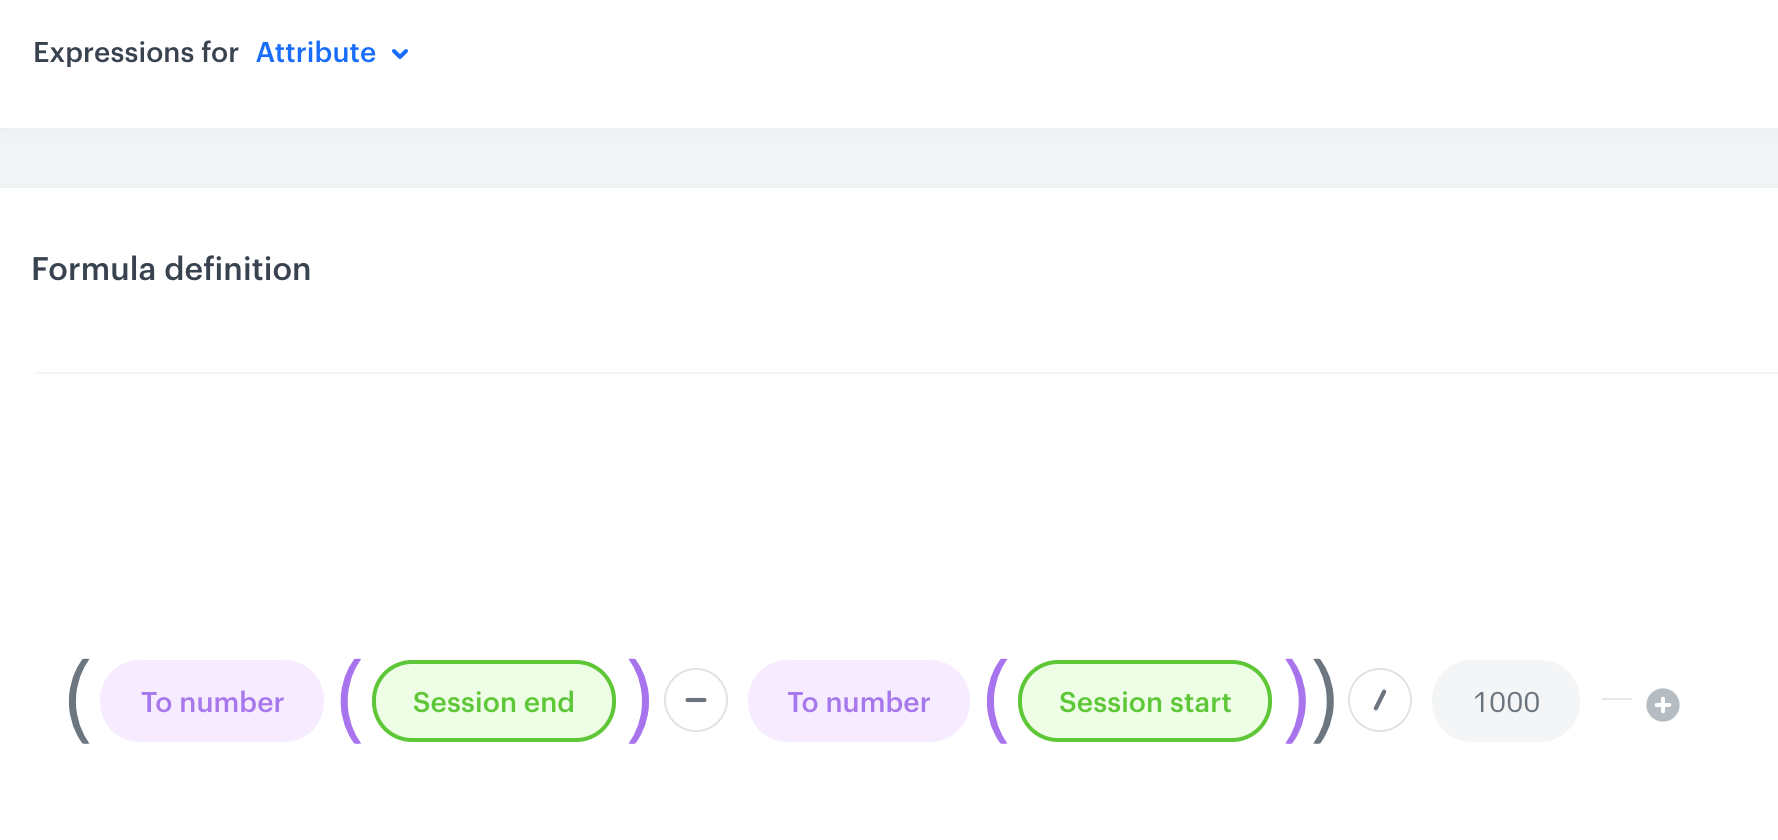
3. Leave the **Expression** option at default (**Attribute**).
4. Build the following formula of the expression:
Formula of the expression Formula explanation
The results of the aggregates used in the expression are converted to numbers. The time of session start is deducted from the session end and the result is divided by 1000 to show the session length in seconds.
5. Save the expression.
## What's next
---
You can preview the results of the expression for individual customers in two ways:
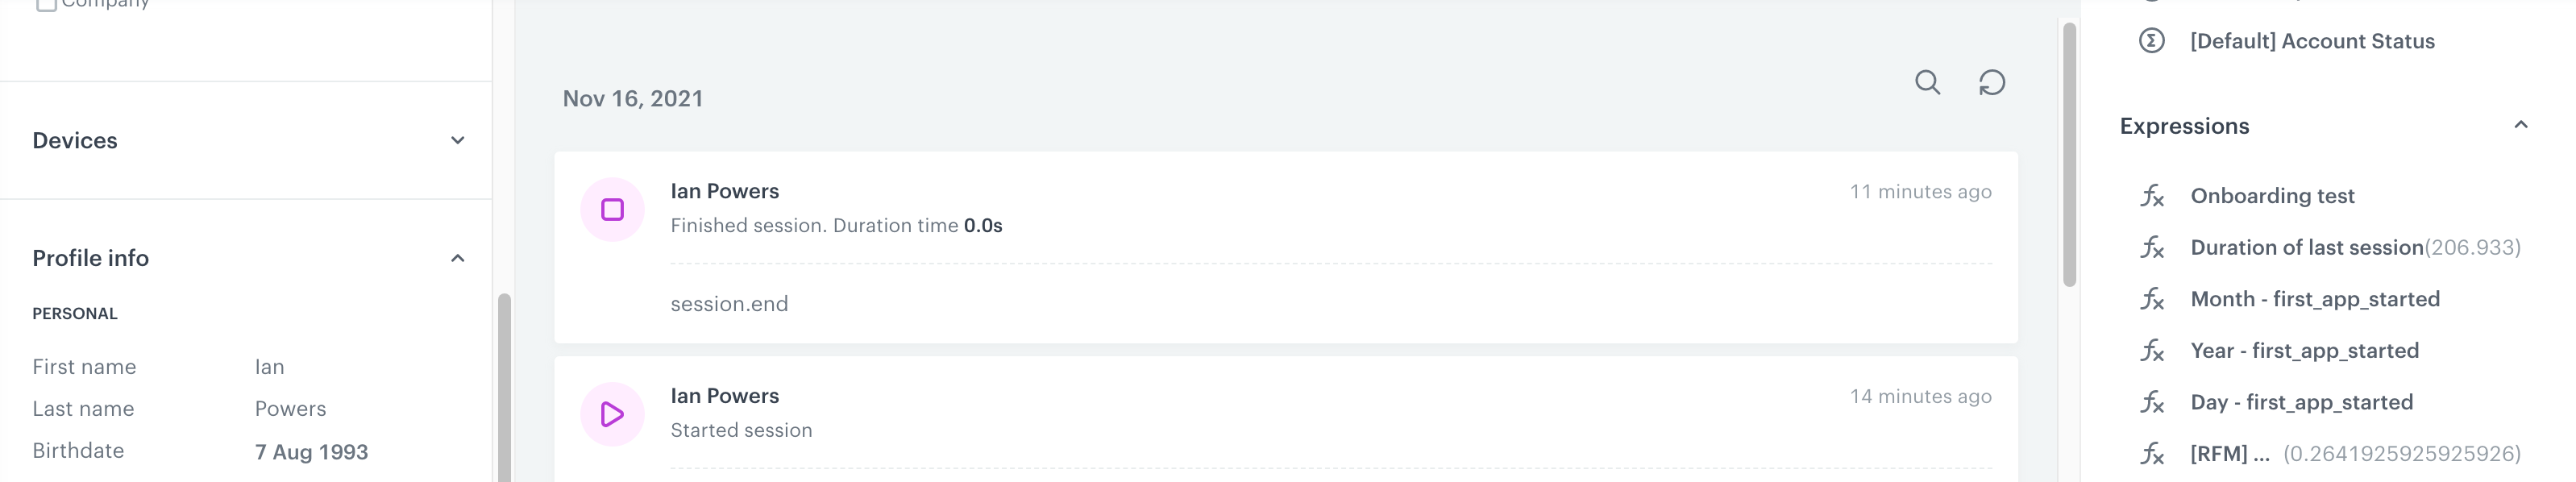
- **Customer's profile**
In a profile of a customer, if you enabled the **Show in Profiles** option in the expression.
Expression on a profile of a customer
- **Analytical dashboard**
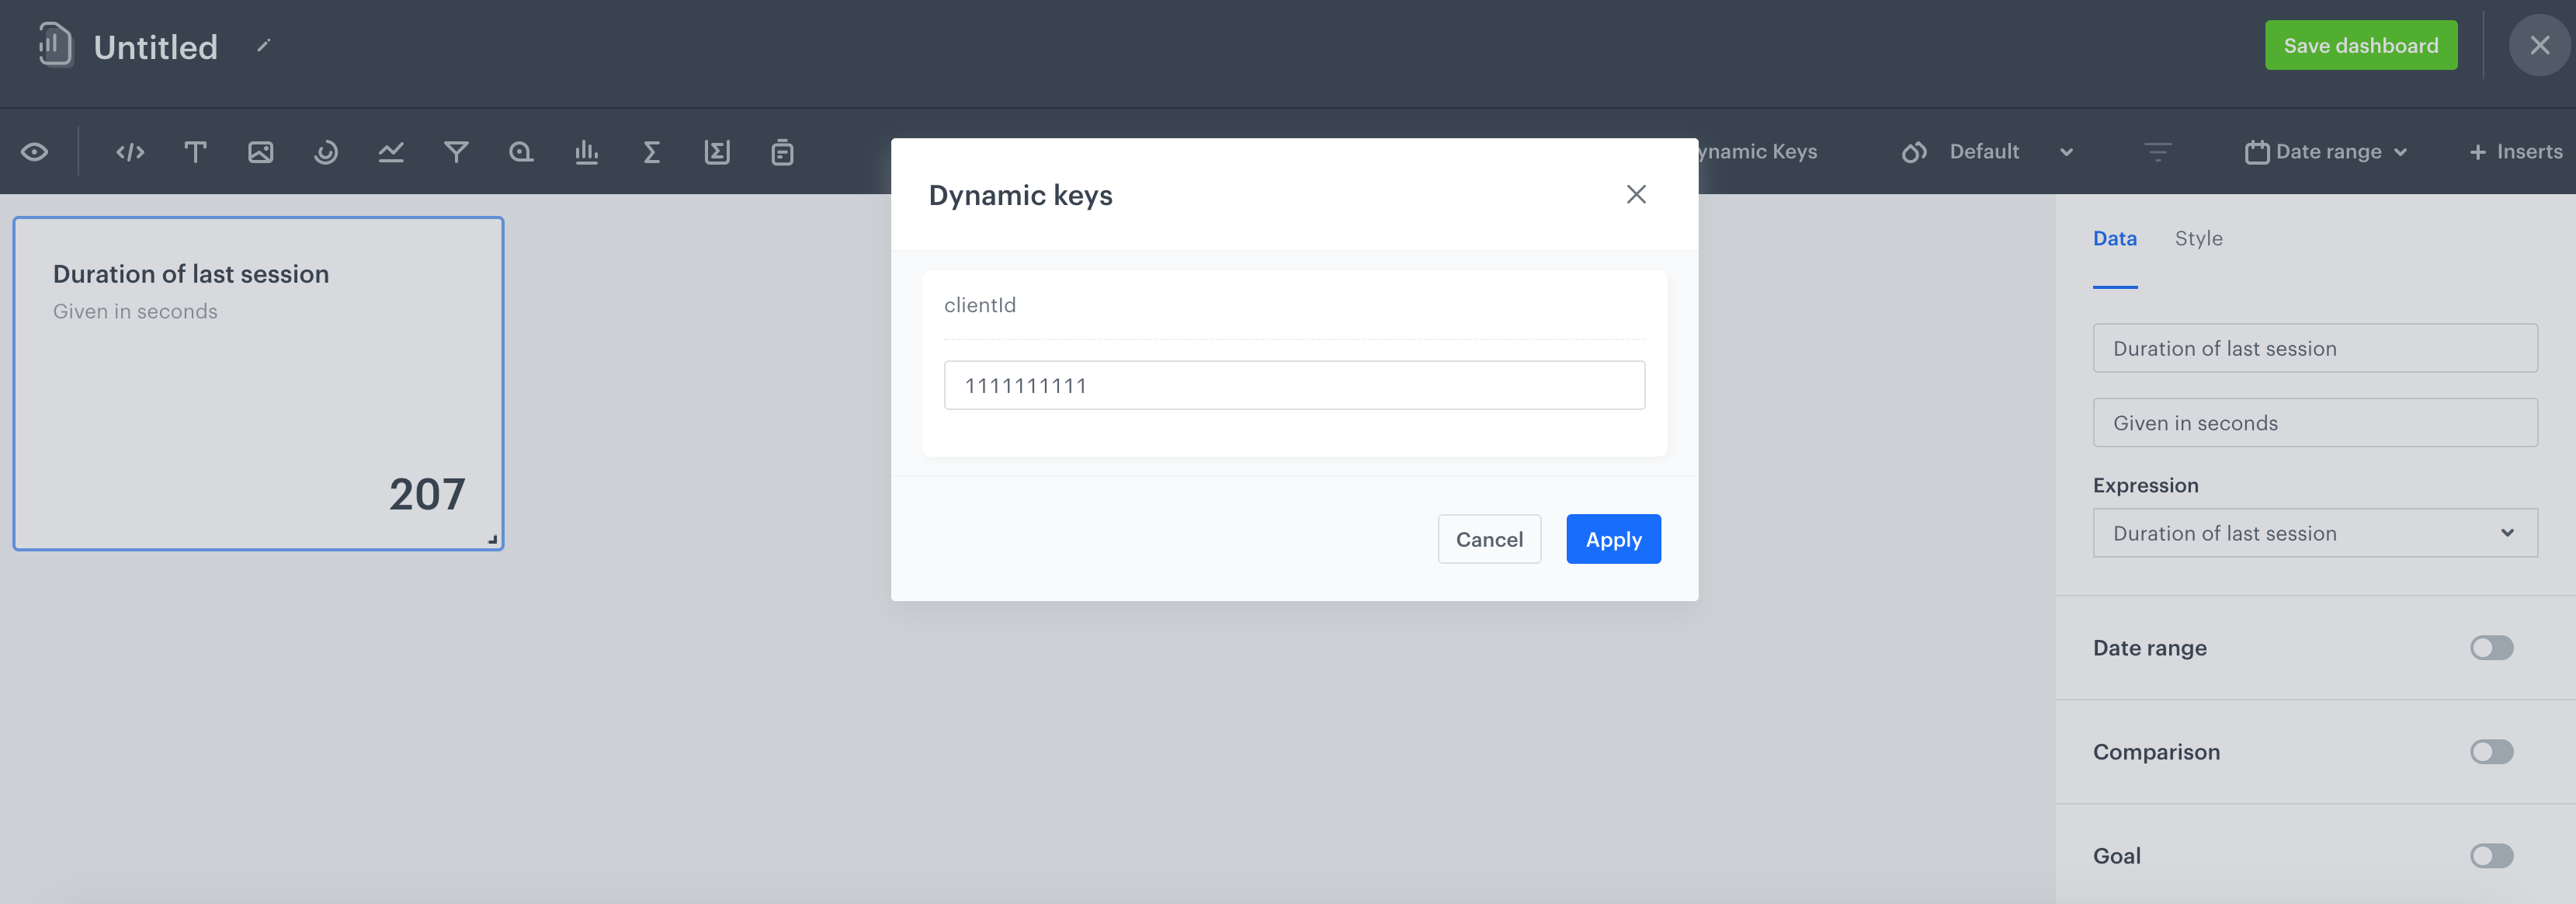
By creating an analytical dashboard and adding this expression to the dashboard.
Expression used in the dashboard
## Check the use case set up on the Synerise Demo workspace
---
Check the [session start aggregate](https://app.synerise.com/analytics/aggregates/7e15f3ba-49e7-37ac-bd63-b7702e18e301) and [session end aggregate](https://app.synerise.com/analytics/aggregates/af9bb0f4-96fb-3fa1-a4fc-4fa82f533052) configuration in Synerise Demo workspace.
You can check also the configuration of the [expression](https://app.synerise.com/analytics/expressions/5f0a9b76-000c-4368-858d-253ea23a08d8).
If you’re our partner or client, you already have automatic access to the **Synerise Demo workspace (1590)**, where you can explore all the configured elements of this use case and copy them to your workspace.
If you’re not a partner or client yet, we encourage you to fill out the contact [form](https://demo.synerise.com/request) to schedule a meeting with our representatives. They’ll be happy to show you how our demo works and discuss how you can apply this use case in your business.
## Read more
---
- [Aggregates](/docs/analytics/aggregates)
- [Expressions](/docs/analytics/expressions)