
An accurate analysis of the transaction is a must for businesses. By using the Synerise Decision Hub, you can calculate the number of transactions for a specific period. To make sure you receive a reliable result, use an aggregator which lets you exclude duplicated transactions in case some occur in your workspace, for example due to duplicate data from an external source used in an import.

Additionally, you may calculate the ratio of the unique transactions to all transactions to find out the scale of duplicated transactions in your workspace. 

This use case describes a process of creating metrics on the basis of the `transaction.charge` event and the `$orderId` event parameter. One of them counts only the number of all unique transactions with the use of the Count Distinct aggregator. The other calculates the percentage of unique transactions through a mathematical formula.

## Prerequisites
---
Implement transaction events either through [SDK](/developers/web/transactions-sdk) or [API](https://developers.synerise.com/DataManagement/DataManagement.html#operation/CreateATransaction).

## Process
---
1. [Create a metric that calculates the number of unique transactions](/use-cases/calculate-unique-transactions#calculate-the-number-of-unique-transactions).
2. [Create a metric that calculates the ratio of unique transactions to all transactions](/use-cases/calculate-unique-transactions#calculate-the-percentage-of-unique-transactions).

## Calculate the number of unique transactions
---
Create a metric on the basis of the `transaction.charge` event to count the unique occurrences of the event with an `$orderId` parameter. 


<div class="admonition admonition-note"><div class="admonition-icon"><svg xmlns="http://www.w3.org/2000/svg" fill="none" viewBox="0 0 24 24" stroke="currentColor" stroke-width="2.5"><path stroke-linecap="round" stroke-linejoin="round" d="M13 16h-1v-4h-1m1-4h.01M21 12a9 9 0 11-18 0 9 9 0 0118 0z" /></svg></div><div class="admonition-body"><div class="admonition-content">

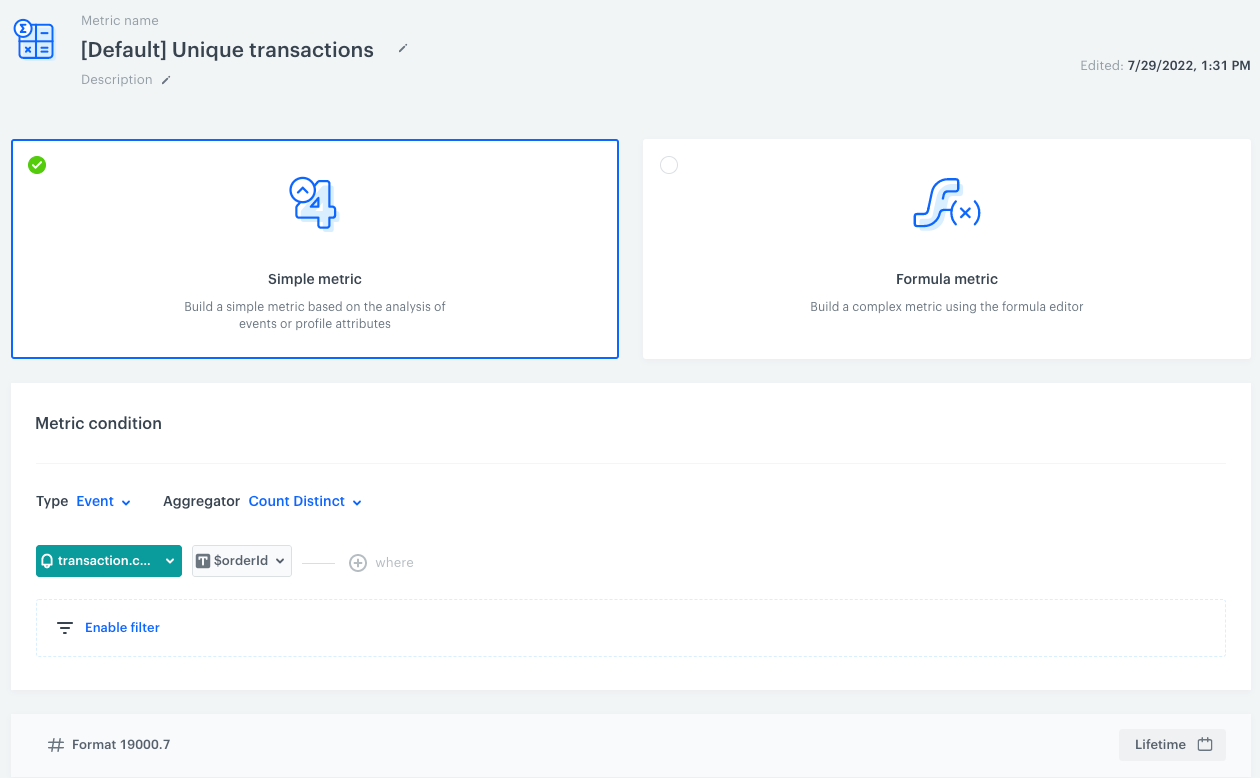
This analysis uses a `transaction.charge` event, which is generated after a purchase as a summary of an order (as opposed to `product.buy` which is generated separately for each item from a specific order). The names of the events may be different in your workspace.

</div></div></div>


1. Go to <img src="/api/docs/image/54176ad07f146575310749eba44b7c2f42c1b327/icons/decision-hub-icon.svg" alt="Decision Hub icon" class="icon"> **Decision Hub > Metrics > New metric**.  
2. Leave the metric kind at default (**Simple**).  
3. Leave the type at default (**Event**).  
4. As the aggregator, select **Count Distinct**.  
5. From th **Choose event** dropdown list, select **transaction.charge**.  
6. As the event parameter, select **$orderId**.  
7. In the lower right corner, select the data range for which you want to analyze the data.  
8. Save the metric.  
    **Result**: 
    <figure><img src="/api/docs/image/54176ad07f146575310749eba44b7c2f42c1b327/use-cases/all-cases/_gfx/calculate-unique-transactions.png" class="full" alt="The configuration of the metric"><figcaption>The configuration of the metric</figcaption></figure>

## Calculate the percentage of unique transactions
---
Create a metric with a mathematical formula which calculates the ratio of unique transactions to all transactions in your workspace.

1. Go to <img src="/api/docs/image/54176ad07f146575310749eba44b7c2f42c1b327/icons/decision-hub-icon.svg" alt="Decision Hub icon" class="icon"> **Decision Hub > Metrics > New metric**. 
2. As the metric kind, select **Formula metric**.  
3. On the dashboard, click **Select**.  
4. From the dropdown list, select **Event**.  
5. Click the **unnamed** node.  
6. From the **Choose event** dropdown list, select **transaction.charge**.  
7. As the aggregator, select **Count Distinct**.  
8. In the lower right corner, set the date range to **Lifetime**.  
9. Click the <img src="/api/docs/image/54176ad07f146575310749eba44b7c2f42c1b327/icons/plus-icon-expressions.png" alt="Plus icon" class="icon"> button.  
10. From the dropdown list, select **Event**.  
11. Click the **unnamed** node.  
12. From the **Choose event** dropdown list, select **transaction.charge**.
13. Leave the aggregator type at default (**Count**).  
14. In the lower right corner, set the date range to **Lifetime**. 
15. Click the <img src="/api/docs/image/54176ad07f146575310749eba44b7c2f42c1b327/icons/plus-icon-expressions.png" alt="Plus icon" class="icon"> button.  
16. From the dropdown list, select **Number**.  
17. Replace `0` with `100`.  
18. Change the mathematical operators:  
    1. Between the nodes with events, change the plus sign to the division sign.  
    2. Between the transaction.charge node and `100`, change the plus sign to the multiplication sign.  
19. Save the metric.  
    **Result**:  
    <figure><img src="/api/docs/image/54176ad07f146575310749eba44b7c2f42c1b327/use-cases/all-cases/_gfx/percentage-unique-transactions.png" class="full" alt="The configuration of the metric"><figcaption>The configuration of the metric</figcaption></figure>

## What's next
---
You can display the metrics you created on a [dashboard](/docs/analytics/analytics-dashboard), which will help you present them in a convenient and readable form.  

Additionally, you may use one of the metrics in an alert system that notifies you when the metric result deviates from the norm. To create such an alert, you can use Automation Hub, create a workflow and include a [Metric Filter](/docs/automation/conditions/metric-filter-node) node. If the metric results exceeds a specific number, you can send an email alert, SMS alert, or a message to a third party tool by using [Outgoing Integration](/docs/automation/integration/outgoing-webhook).


<div class="admonition admonition-note"><div class="admonition-icon"><svg xmlns="http://www.w3.org/2000/svg" fill="none" viewBox="0 0 24 24" stroke="currentColor" stroke-width="2.5"><path stroke-linecap="round" stroke-linejoin="round" d="M13 16h-1v-4h-1m1-4h.01M21 12a9 9 0 11-18 0 9 9 0 0118 0z" /></svg></div><div class="admonition-body"><div class="admonition-content">

You can get inspired by one of our [use cases which presents a workflow that sends a message to a Slack channel with the metric results](/use-cases/slack-integration).

</div></div></div>


## Check the use case set up on the Synerise Demo workspace
---
You can check the configuration of both metrics on our Synerise Demo workspace:
-  [The number of unique transactions](https://app.synerise.com/analytics/metrics/1c56a0aa-0331-47c7-8d5f-f56bbb32d1e9) 
- [Ratio of unique transactions to all transactions](https://app.synerise.com/analytics/metrics/09ddb511-83f3-4d1e-a423-0d234fab9286)

If you’re our partner or client, you already have automatic access to the **Synerise Demo workspace (1590)**, where you can explore all the configured elements of this use case and copy them to your workspace.  

If you’re not a partner or client yet, we encourage you to fill out the contact [form](https://demo.synerise.com/request) to schedule a meeting with our representatives. They’ll be happy to show you how our demo works and discuss how you can apply this use case in your business. 


## Read more
---
- [Metrics](/docs/analytics/metrics)
- [Metric use cases](/use-cases/?ordering=DESC&sortBy=publishDate&filters=tags%3D%3D"metrics")


