In an expression, you can include segmentations that consist of several subgroups and conditions to receive the subsegmentation a customer belongs to. You can later use this expression in the dynamic content to display the specific content depending on the expression result.
## Prerequisites
---
- Implement [tracking code](/developers/web/installation-and-configuration#creating-a-tracking-code) on your website.
## Process
---
In this use case, you will go through the following steps:
1. [Create an aggregate](/use-cases/check-if-client-in-segmentation#create-an-aggregate) that calculates the number of all transactions each customer has made.
2. [Create a segmentation](/use-cases/check-if-client-in-segmentation#create-a-segmentation) that will divide the customers into three groups.
3. [Create an expression](/use-cases/check-if-client-in-segmentation#create-an-expression) that includes in its formula only the segmentation you created in the previous part of the process.
## Create an aggregate
---
As the first part of the process, create an aggregate that calculates the number of all transactions each customer has made.
1. Go to **Behavioral Data Hub > Live Aggregates > Create aggregate**.
2. As the aggregate type, select **Profile**.
2. Enter the title of the aggregate.
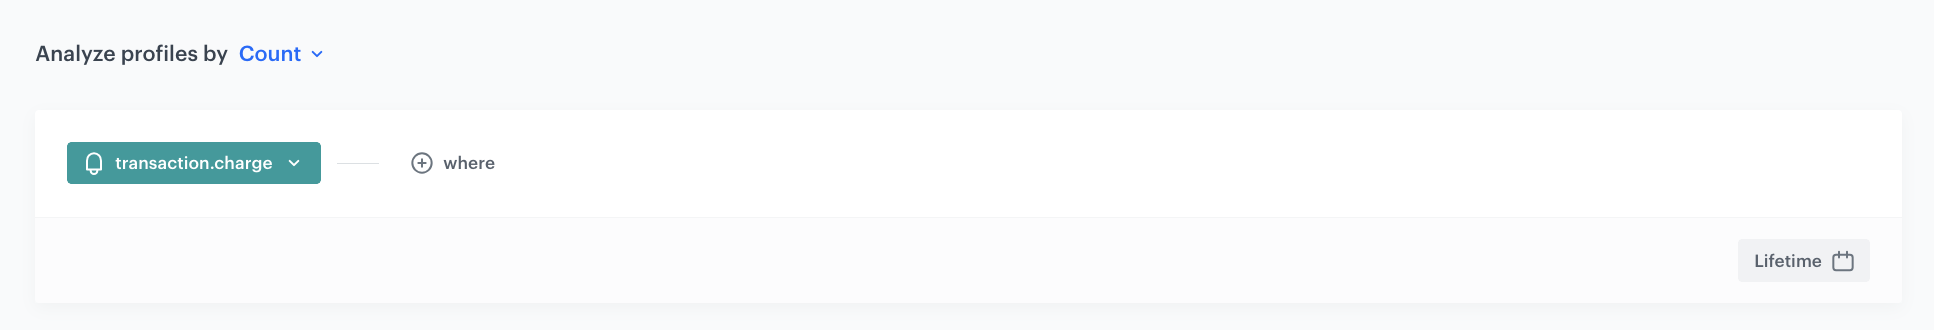
3. Click **Analyze profiles by** and select **Count**.
4. From the **Add condition** dropdown list, select **transaction.charge**.
5. In the date range, select **Lifetime**.
6. Save the aggregate.
Configuration of the aggregate
## Create a segmentation
---
In this part of the process, create a segmentation that will divide the customers into three groups:
1. Customers who have made more than 5 transactions.
2. Customers who have made between 3 and 5 transactions.
3. Customers who have made less than 3 transactions.
The subsegments (groups) are built on the basis of the aggregate you created in the [first part](/use-cases/check-if-client-in-segmentation#create-an-aggregate) of the procedure.
### Create the first subsegmentation
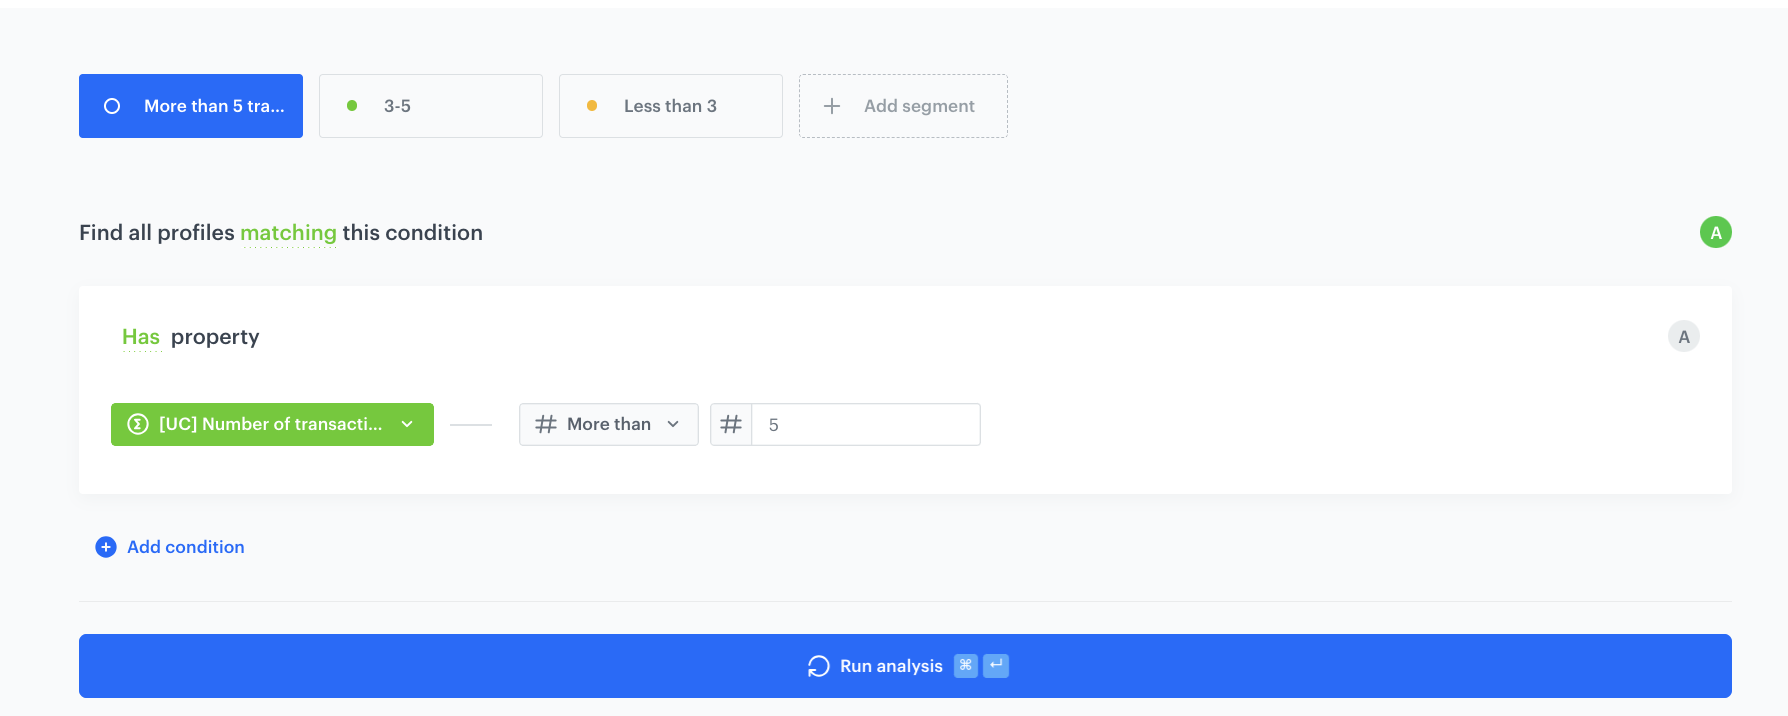
Create a subsegmentation that includes only customers who have made more than 5 transactions.
1. Go to **Decision Hub > Segmentations > New segmentation**.
2. Enter the name of the segmentation.
3. Optionally, switch the **Show in profile card** toggle on.
3. Enter the name of the subsegmentation.
3. From the **Choose filter** dropdown list, select the aggregate you created.
4. As the logical operator, select **More than**.
5. Next to the logical operator, in the text field enter `5`.
Configuration of the aggregate
### Create the second subsegmentation
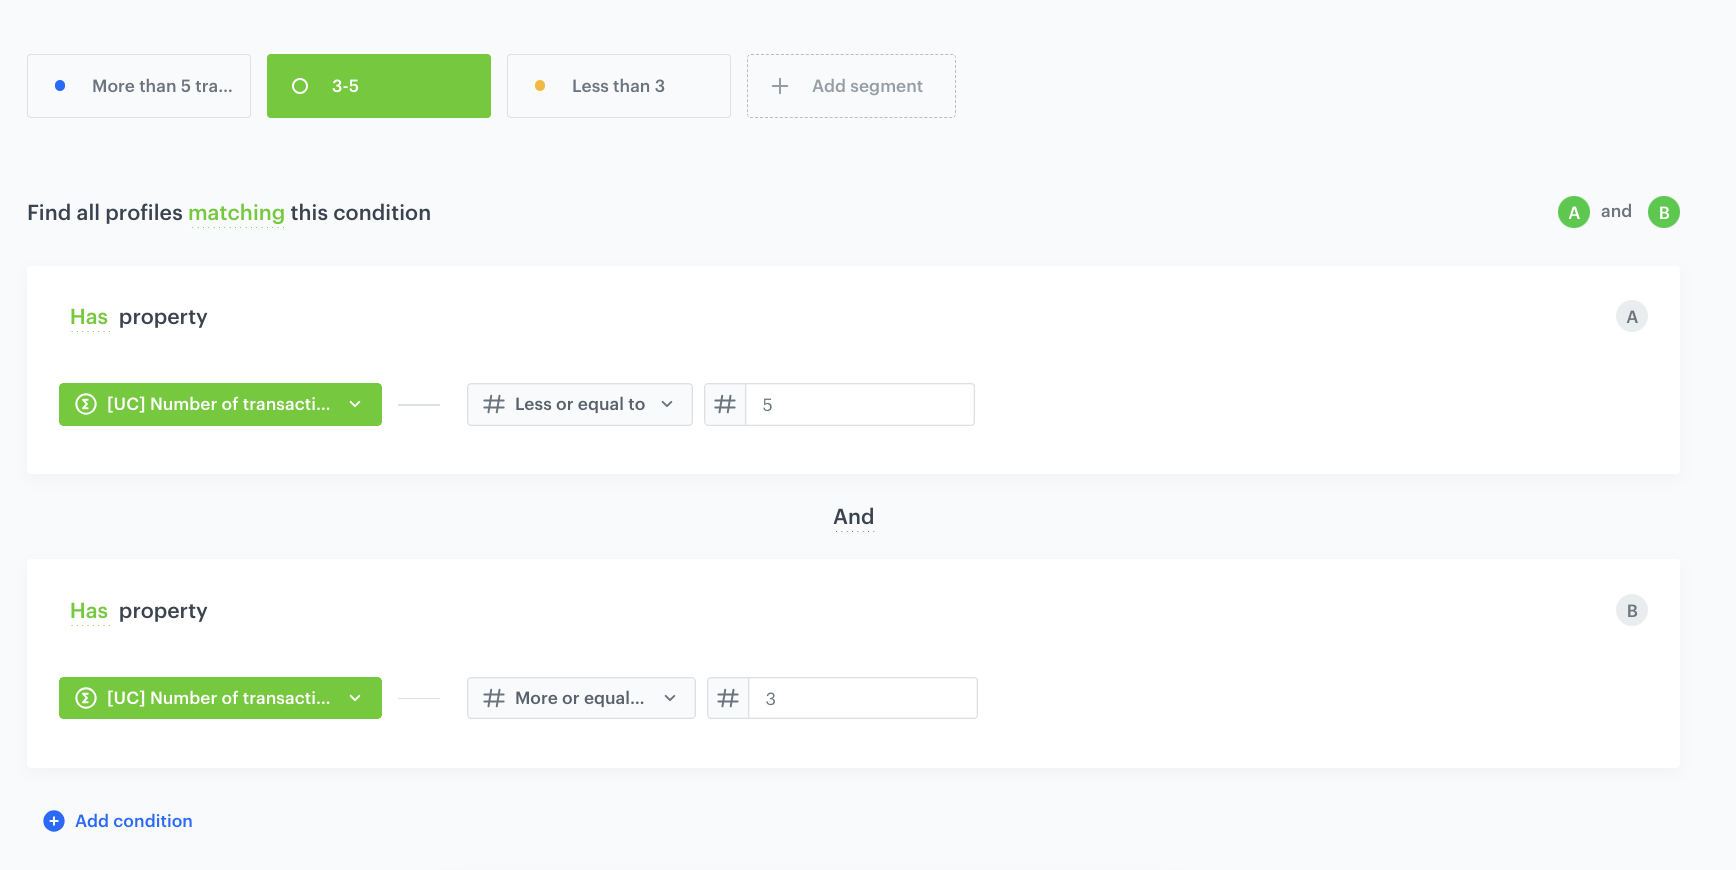
Create a subsegmentation that includes only customers who have made between 3 and 5 transactions.
6. Under the main title of the segmentation, click the icon.
7. Enter the name of the subsegmentation.
8. From the **Choose filter** dropdown list, select the aggregate you created.
9. As the logical operator, select **Less or equal to**.
10. Next to the logical operator, in the text field, enter `5`.
11. Click **Choose filter**.
12. From the dropdown list, select the aggregate you created.
13. As the logical operator, select **More or equal to**.
14. Next to the logical operator, in the text field, enter `3`.
15. Join the two conditions by selecting **AND**.
Configuration of the aggregate
### Create the third subsegmentation
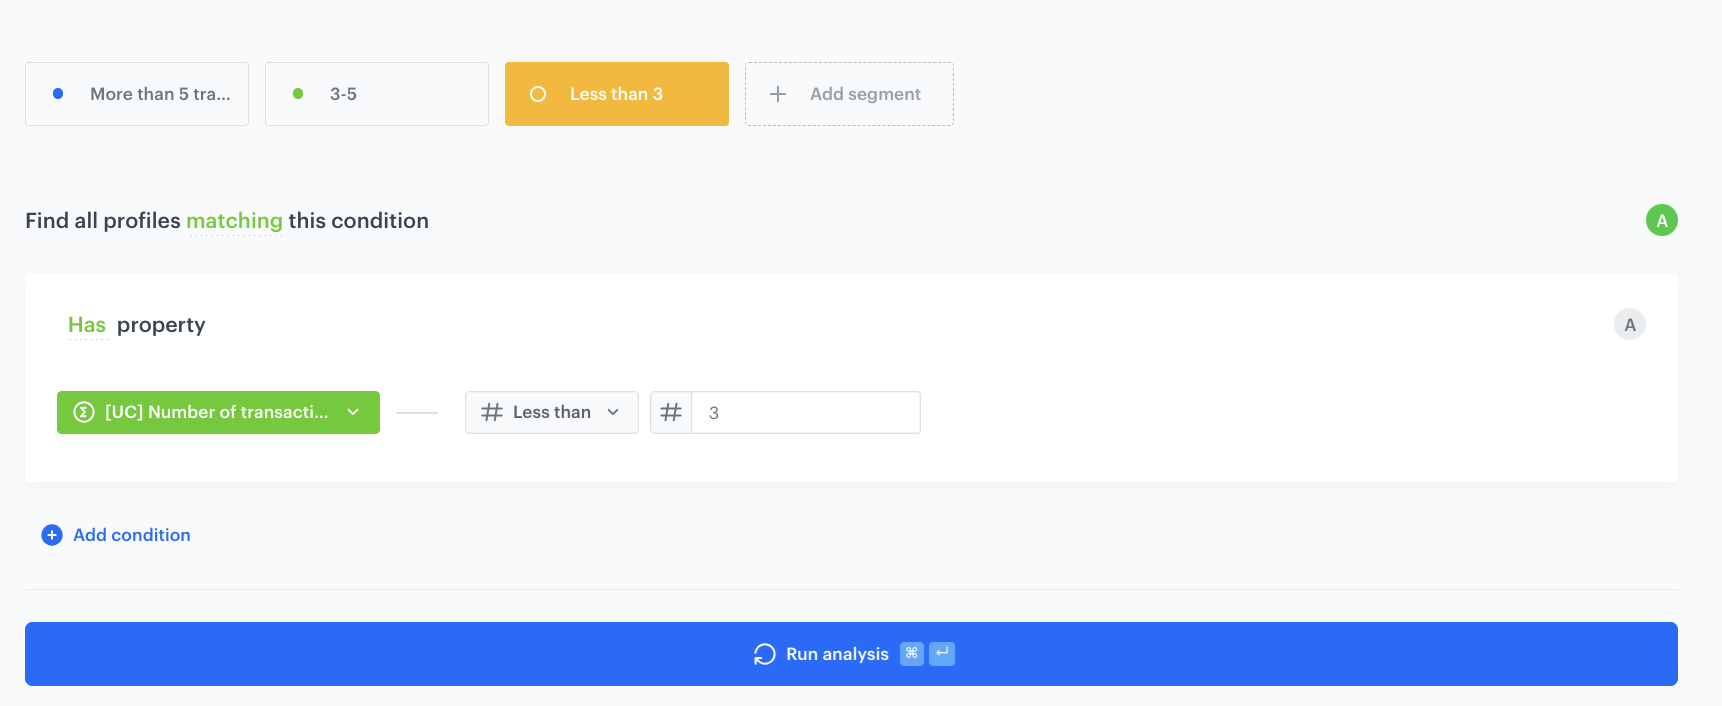
Create a subsegmentation that includes only customers who have made less than 3 transactions.
6. Under the main title of the segmentation, click the icon.
7. Enter the name of the subsegmentation.
8. From the **Choose filter** dropdown list, select the aggregate you created.
9. As the logical operator, select **Less than**.
10. Next to the logical operator, in the text field enter `3`.
Configuration of the aggregate
12. Save the segmentation.
## Create an expression
---
In this part of the process, create an expression that includes in its formula only the [segmentation](/use-cases/check-if-client-in-segmentation#create-a-segmentation) you created in the previous part of the process.
1. Go to **Behavioral Data Hub > Expressions > New expression**.
2. Enter the name of the expression.
3. Leave the **Expression** option at default (**Attribute**).
4. Optionally, switch the **Show in profile card** toggle on.
4. Click the **Select** button.
5. From the dropdown list, select **Profile**.
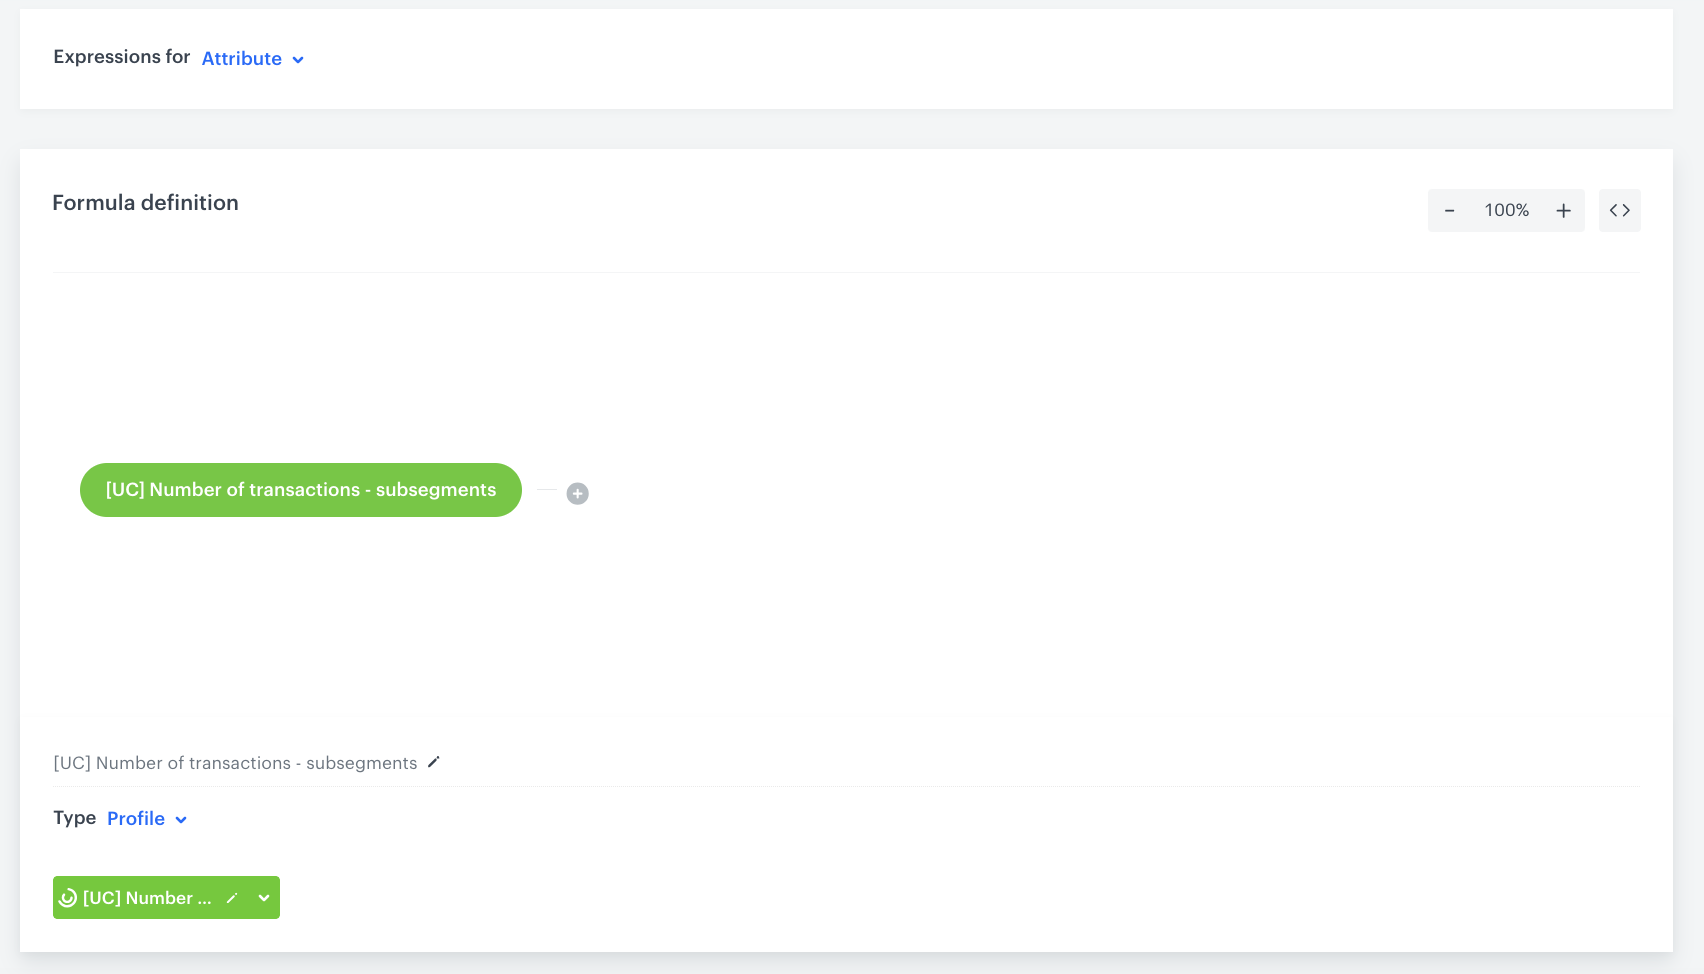
6. Click the button that appeared on the dashboard.
7. On the **Choose attribute** dropdown list, use the search box to find the segmentation you created.
8. Save the expression.
Configuration of the expression
## What's next
---
You can preview the results in several ways:
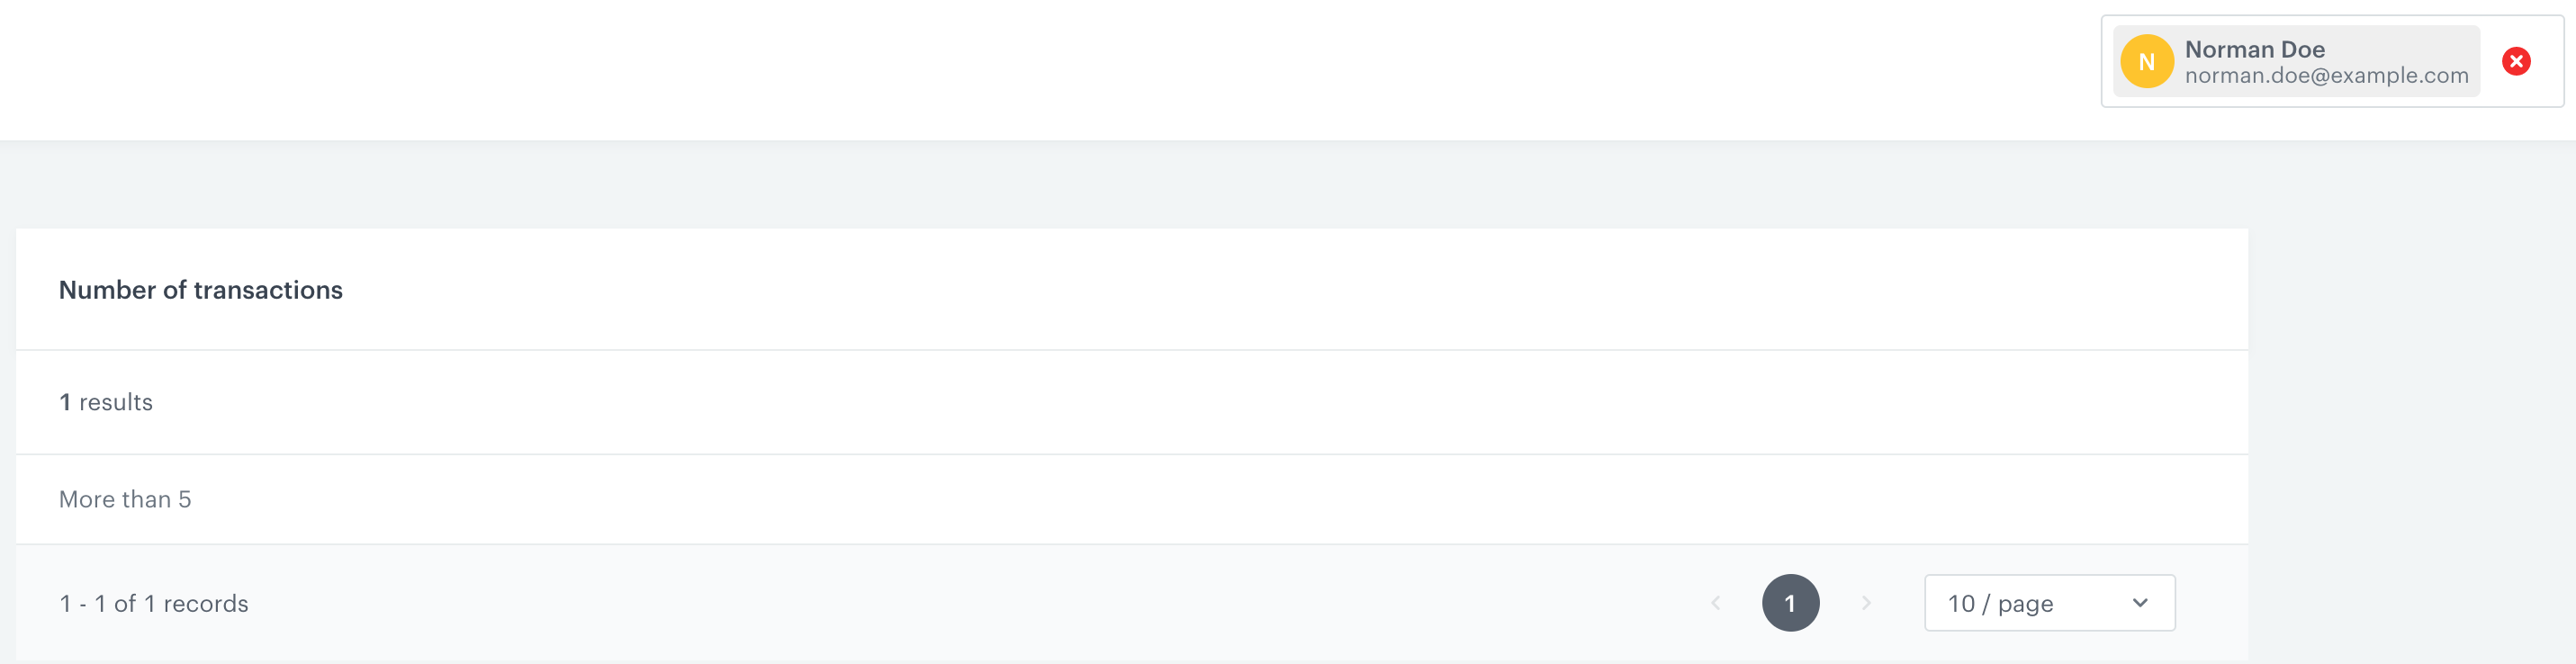
- **Expression preview**
The first way to check the results of the expression is the preview of the expression. In the search box, type the ID of the customer (for example, an email address), and you will get the results of the expression for the individual customer.
Expression preview
- **Customer's profile**
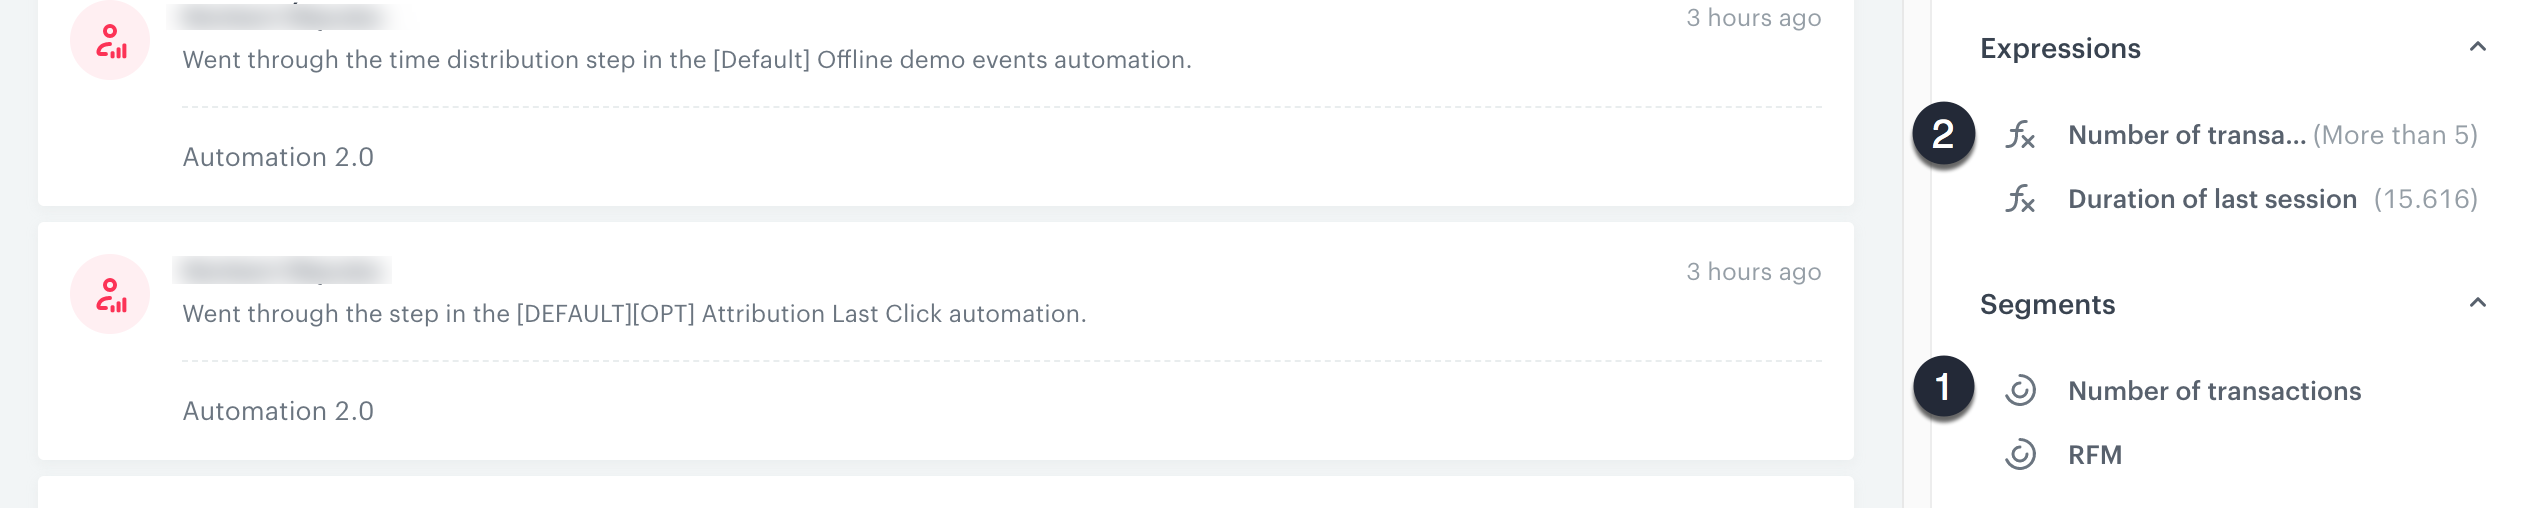
If you enabled **Show in profile card** option for the segmentation and expression, you can see them listed on a customer's profile.
Preview of customer's profile
1. If the customer belongs to the segmentation, its name is listed on the segmentation list.
2. The expression shows the subsegmentation to which the customer belongs.
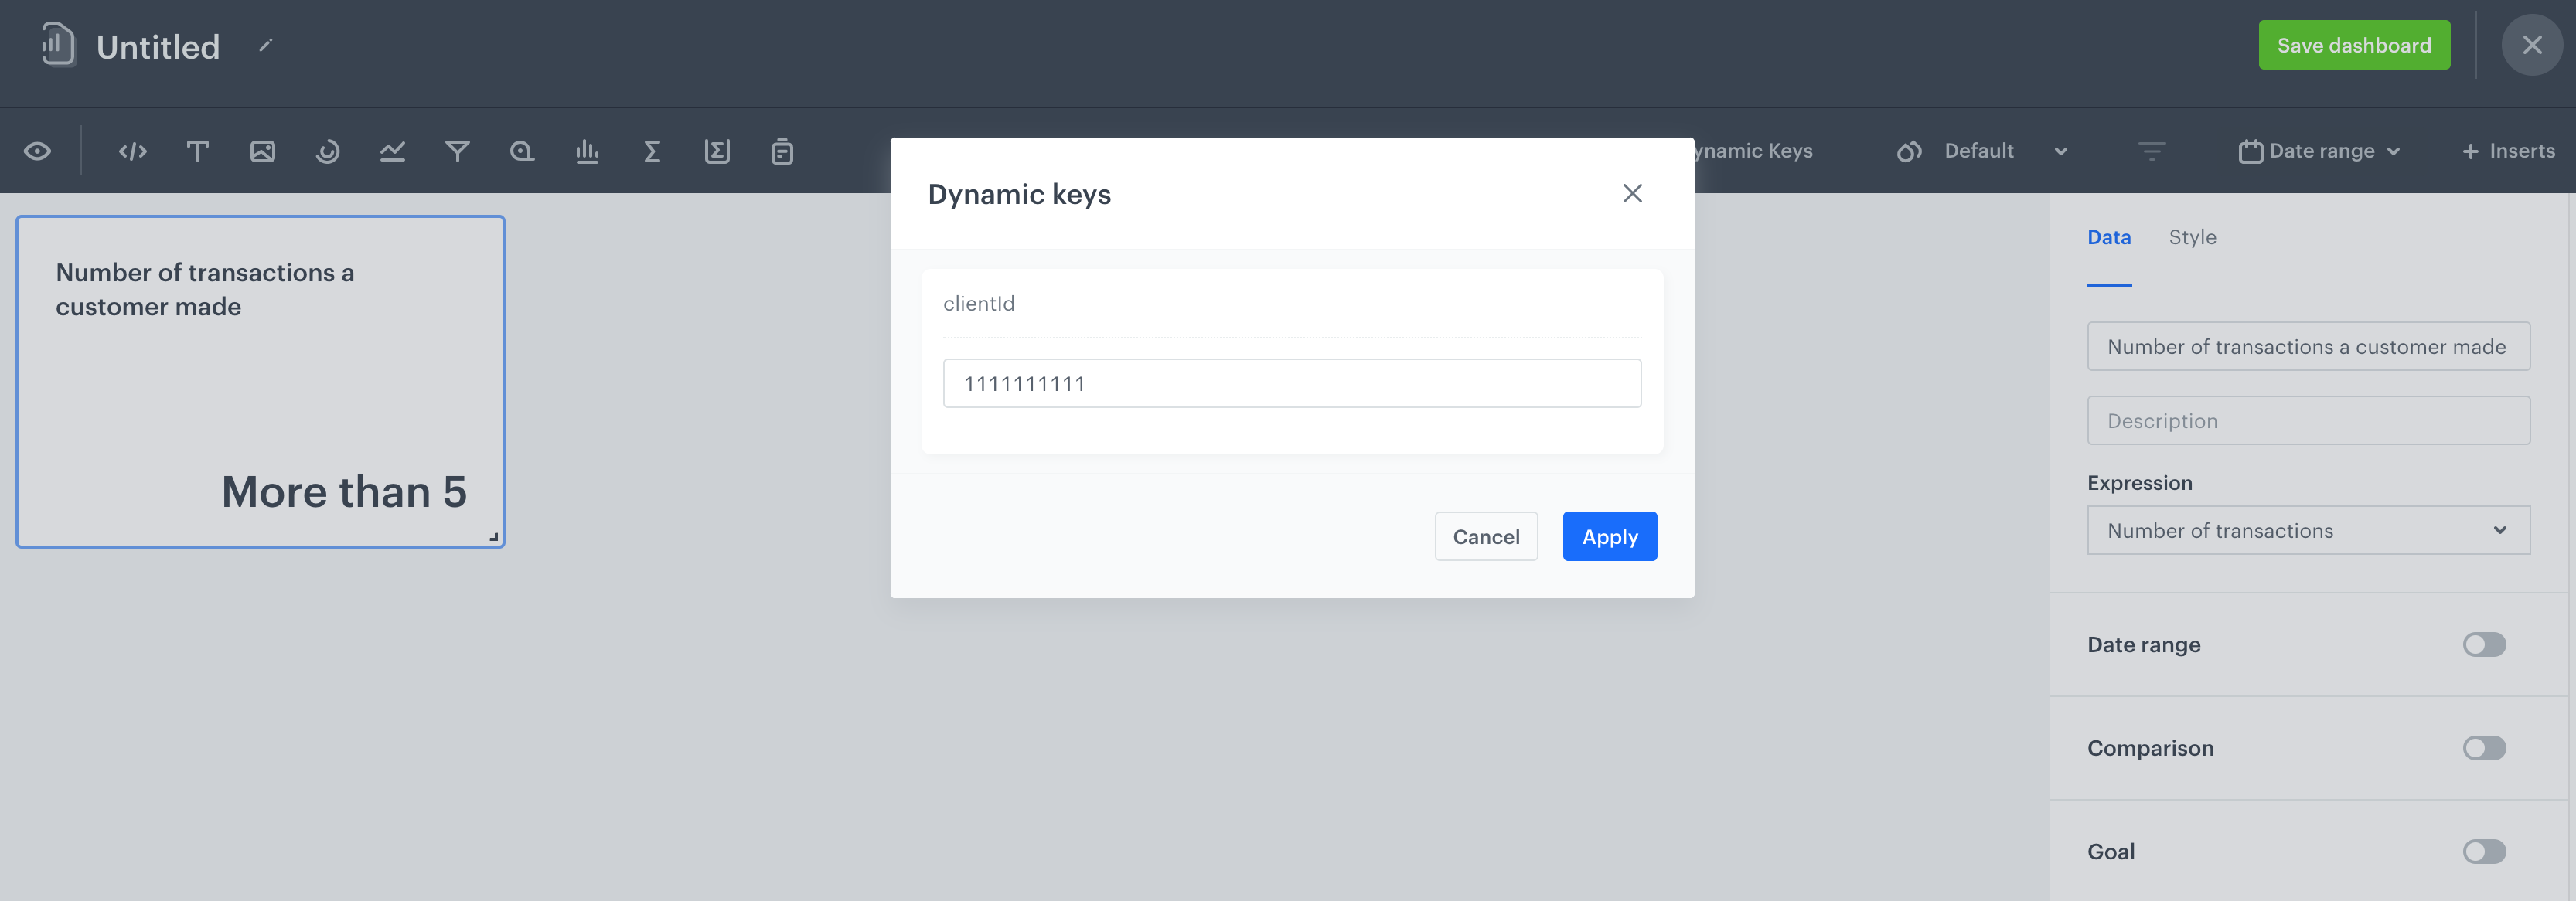
- **Analytical dashboard**
You can create an analytical dashboard and add the expression to the dashboard. In the **Dynamic key** field, enter the ID of the customer for which you want to see the result.
Expression used in the dashboard
## Check the use case set up on the Synerise Demo workspace
---
In the Synerise Demo workspace, you can check the configuration of:
- the [aggregate that returns the number of transactions](https://app.synerise.com/analytics/aggregates/554ca4db-fdde-3682-971c-038694dcafaa),
- the [segmentation that groups customers according to the number of transactions](https://app.synerise.com/analytics/segmentations/8ef8ffa0-c7ee-42fe-bc9d-496759233ab8)
- the [expression that returns the segment to which a customer belongs](https://app.synerise.com/analytics/expressions/b42707bd-4122-4bdc-bcb6-684fefd6e055)
If you’re our partner or client, you already have automatic access to the **Synerise Demo workspace (1590)**, where you can explore all the configured elements of this use case and copy them to your workspace.
If you’re not a partner or client yet, we encourage you to fill out the contact [form](https://demo.synerise.com/request) to schedule a meeting with our representatives. They’ll be happy to show you how our demo works and discuss how you can apply this use case in your business.
## Read more
---
- [Aggregates](/docs/analytics/aggregates)
- [Dashboards](/docs/analytics/analytics-dashboard)
- [Expressions](/docs/analytics/expressions)
- [Segmentation](/docs/analytics/segmentations)