transaction.charge event.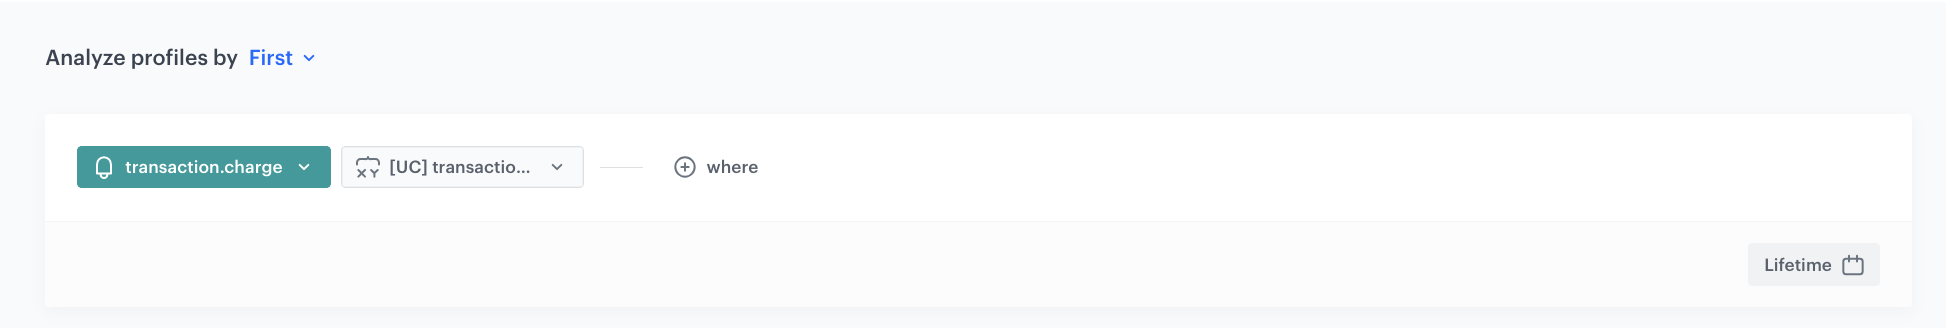
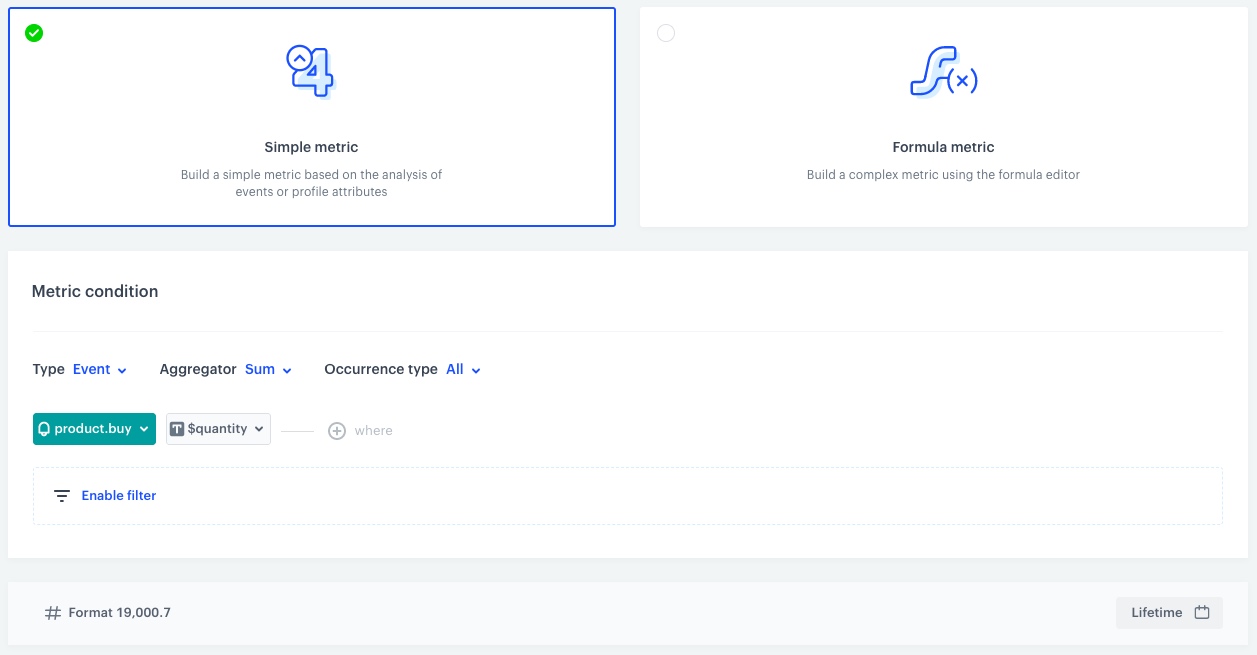
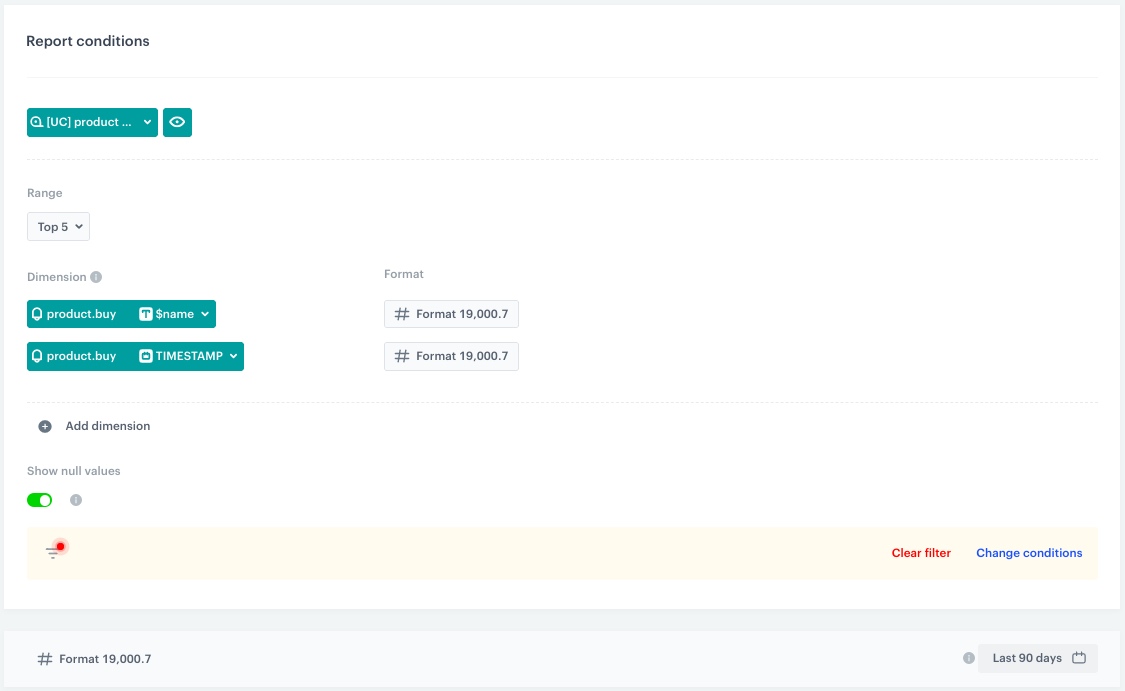
product.buy event.$name parameter.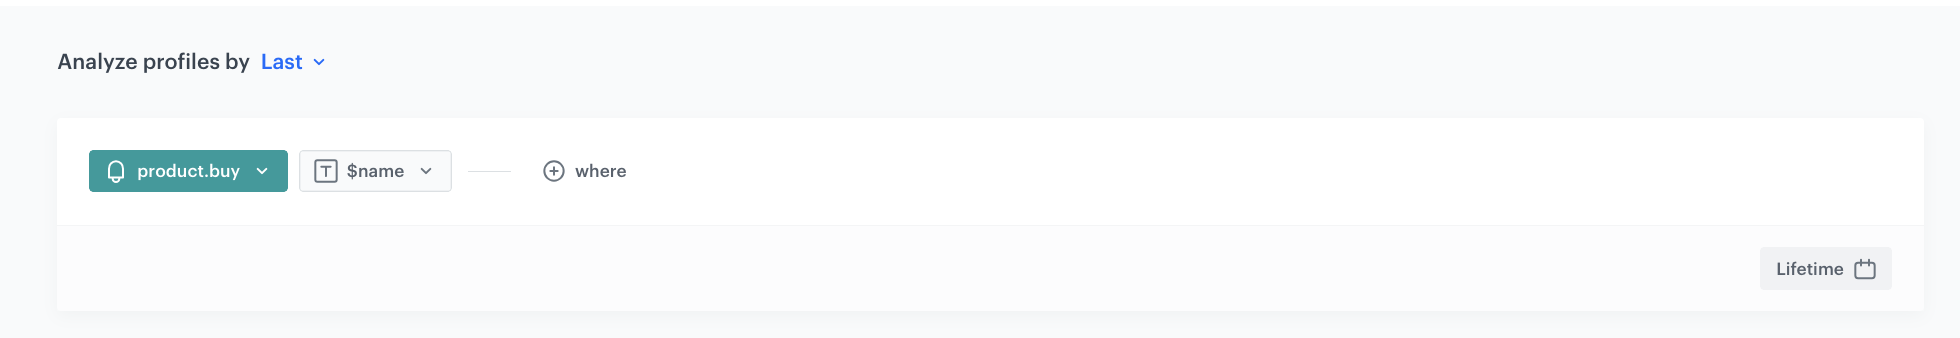
transaction.charge event.$totalAmount parameter.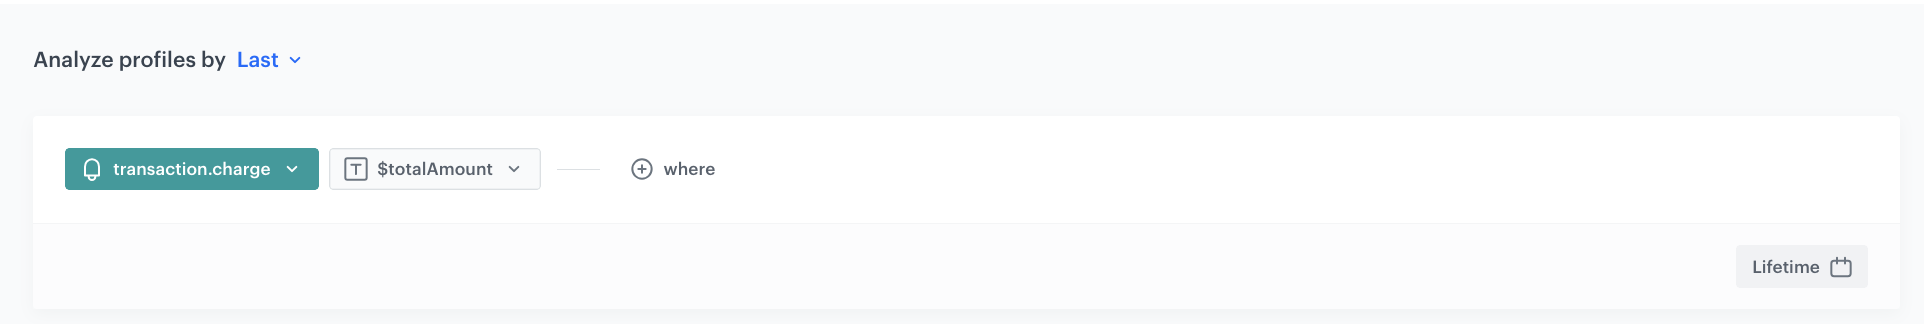
transaction.charge event.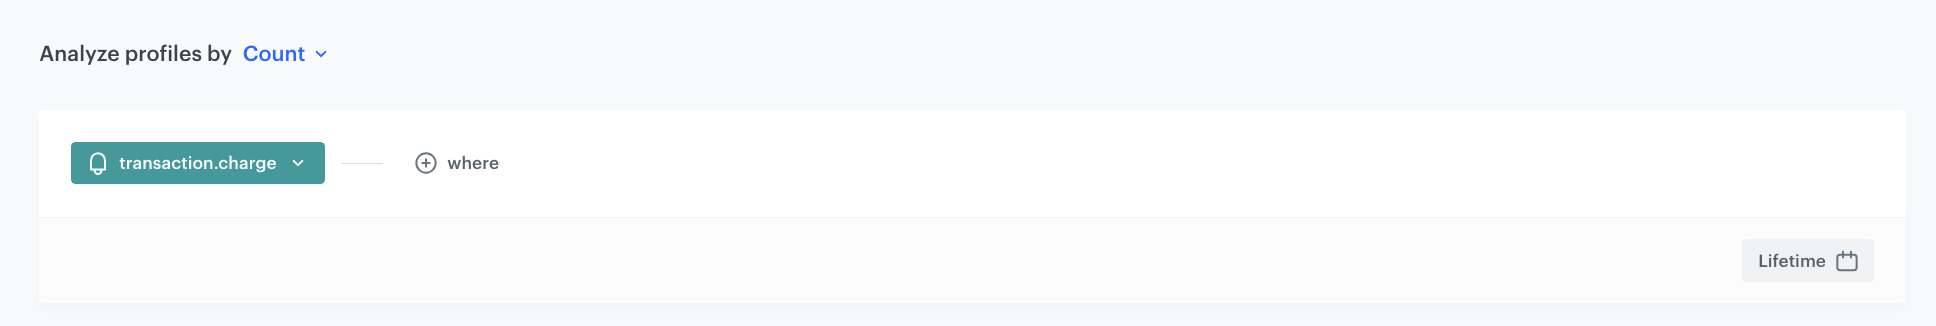
transaction.charge event.$totalAmount parameter.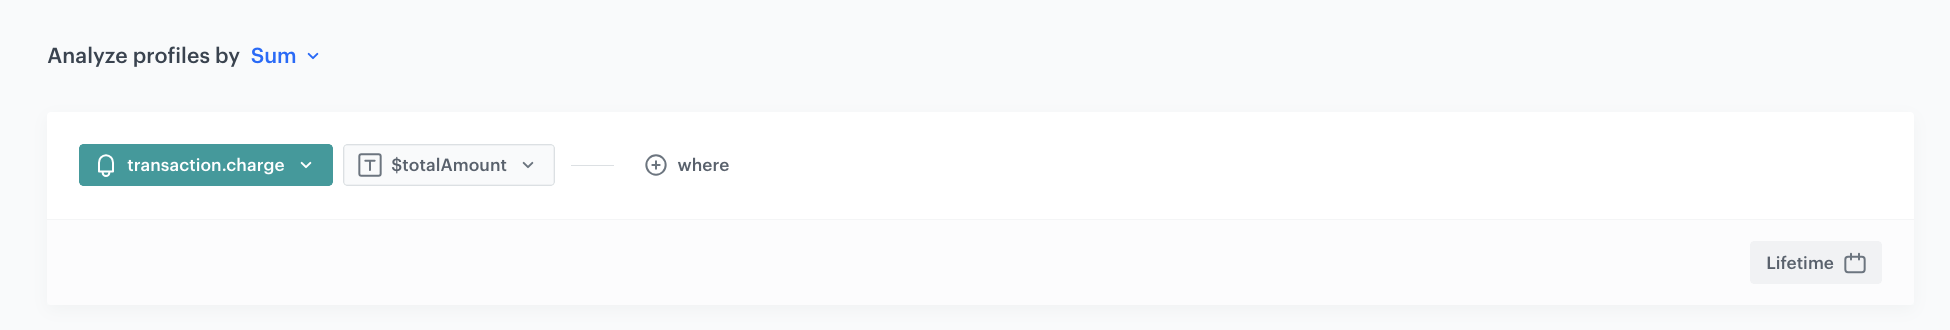
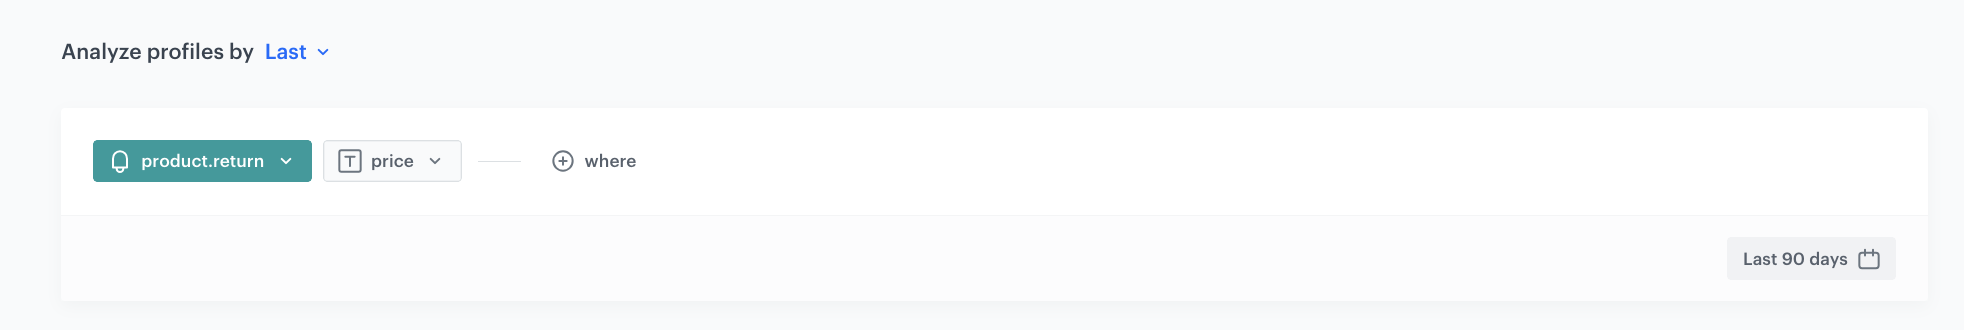
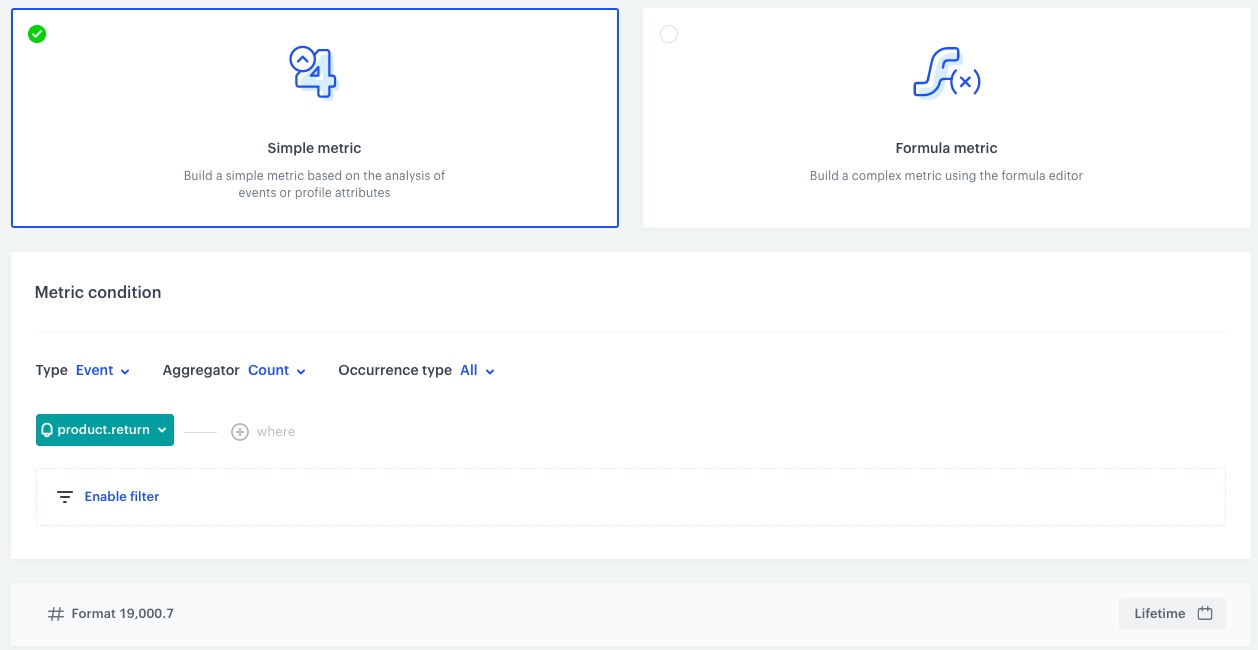
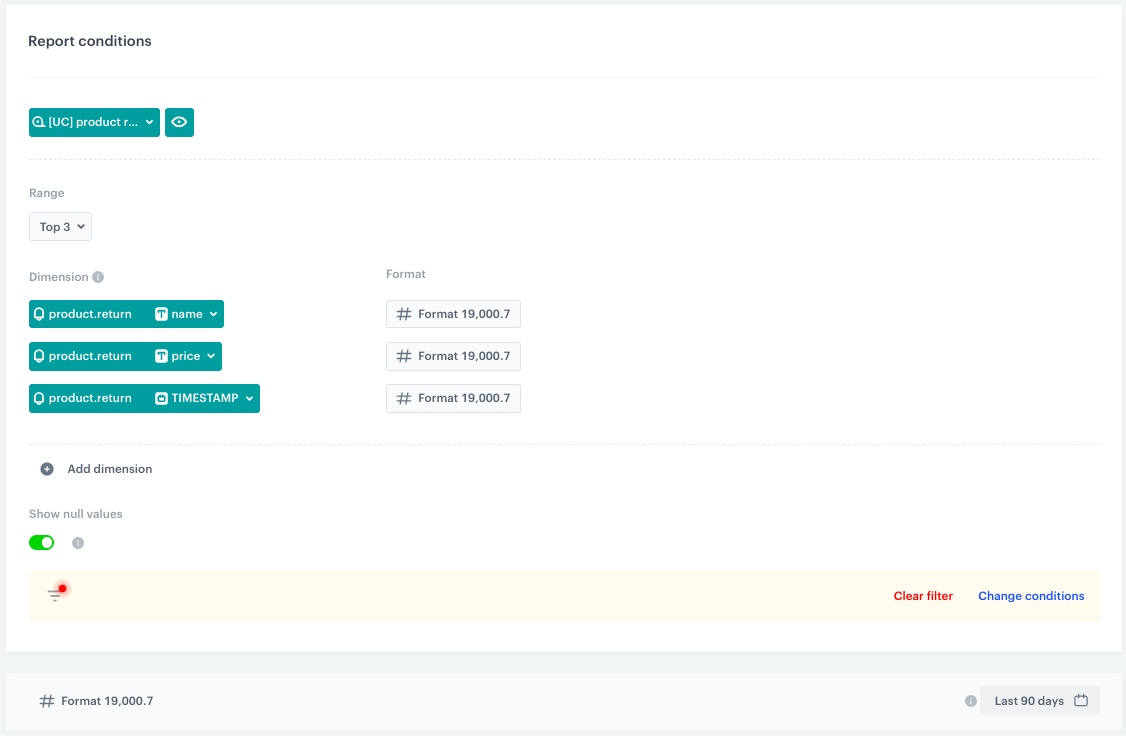
product.return event.name parameter.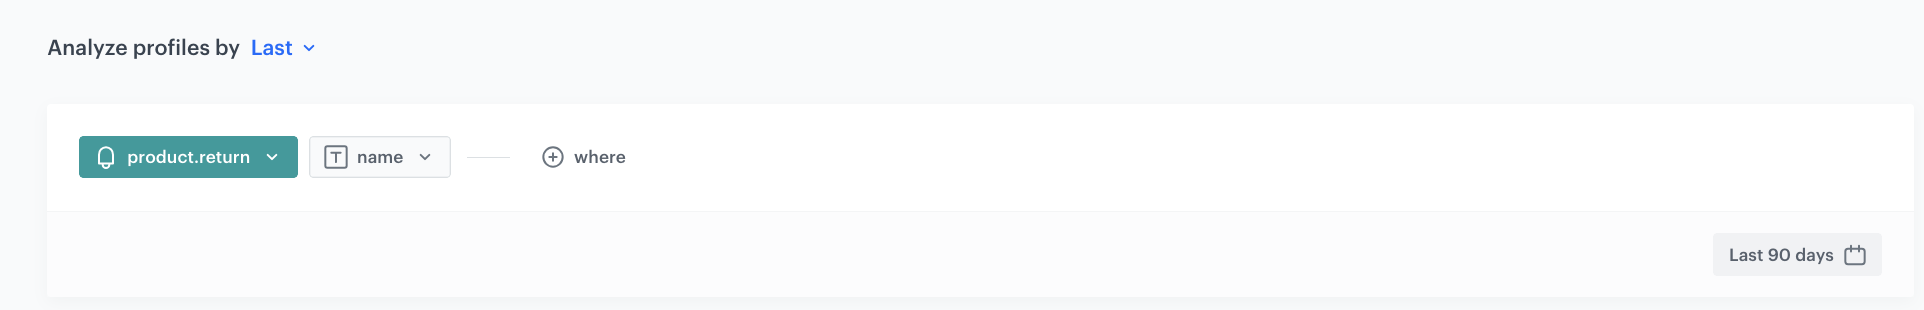
product.return event.price parameter.