
Thanks to the data context Jinjava tag, you can export campaign performance data from Synerise to Google Sheets. Automate updating Google spreadsheet with detailed report summarizing key metrics from your campaigns, this integration opens up new possibilities for data analysis and informed decision-making.

This use case shows a workflow configuration that sends daily data referencing webpush campaigns from Synerise to Google Spreadsheets.

## Prerequisites
---
- Check the [requirements](/docs/automation/integration/google-sheets/upload-data-to-spreadsheets#prerequisites) you must meet to integrate Synerise with Google Spreadsheets.
- Prepare a Google Spreadsheet to which you want to send the data.

## Create a workflow
---
In this part of the process, prepare a workflow that sends statistics to a spreadsheet.

1. Go to <img src="/api/docs/image/54176ad07f146575310749eba44b7c2f42c1b327/icons/automation-hub-icon.svg" alt="Automation Hub icon" class="icon" > **Automation Hub > Workflows > New workflow**.  
2. Enter the name of the workflow.

### Define the trigger node
---
At this stage, we will configure the conditions that launch the workflow. We will create a scheduled workflow, that starts every week on Monday at 9:45 A.M.

1. As the first node of the workflow, add **Scheduled Run**. In the configuration of the node:
    1. In the **Run trigger** section, leave the default **all time** option.
    2. In the **Repeat runs** section, choose suitable timezone.
    3. To launch the workflow every week at the defined time, click the **Every week** tab below.
    4. Select the desired day, in our case **Monday**.
    5. Click **Add time** and set it according to your needs, in our case to `9:45`.
    5. Confirm by clicking **Apply**.

<figure>
    <img src="/api/docs/image/54176ad07f146575310749eba44b7c2f42c1b327/use-cases/all-cases/_gfx/dr_sr_gs.png" alt="Scheduled Run Node"  class="full">
    <figcaption>The configuration of the Scheduled Run node</figcaption>
    </figure> 

### Configure the Get Statistics Node
---
As the next node, choose **Get Statistics** to retrieve webpush campaign statistics from a specified time range.

1. Select the **By time range** tab.
2. From the **Campaign type** dropdown list, select **Webpush**.
3. In the **Set time range** field, select the time range from which you would like to export the statistics. In our case, in the **Relative time range** section, select the **Last week** option. 
5. The default setting includes statistics exclusively for campaigns sent through Experience Hub. If you also want to include statistics for campaigns launched through Automation Hub, enable the **Include automation statistics** option. If this option is selected, the output will include campaigns set up by Automation Hub that meet one of the following criteria:
     - the date of creation is within the indicated time range,
    - at least one sending event has occurred in the indicated time range.
6.	Optionally, if you want to export variants of one campaign as separate records, enable the **Breakdown by variants** toggle.

    
 <div class="admonition admonition-note"><div class="admonition-icon"><svg xmlns="http://www.w3.org/2000/svg" fill="none" viewBox="0 0 24 24" stroke="currentColor" stroke-width="2.5"><path stroke-linecap="round" stroke-linejoin="round" d="M13 16h-1v-4h-1m1-4h.01M21 12a9 9 0 11-18 0 9 9 0 0118 0z" /></svg></div><div class="admonition-body"><div class="admonition-content">

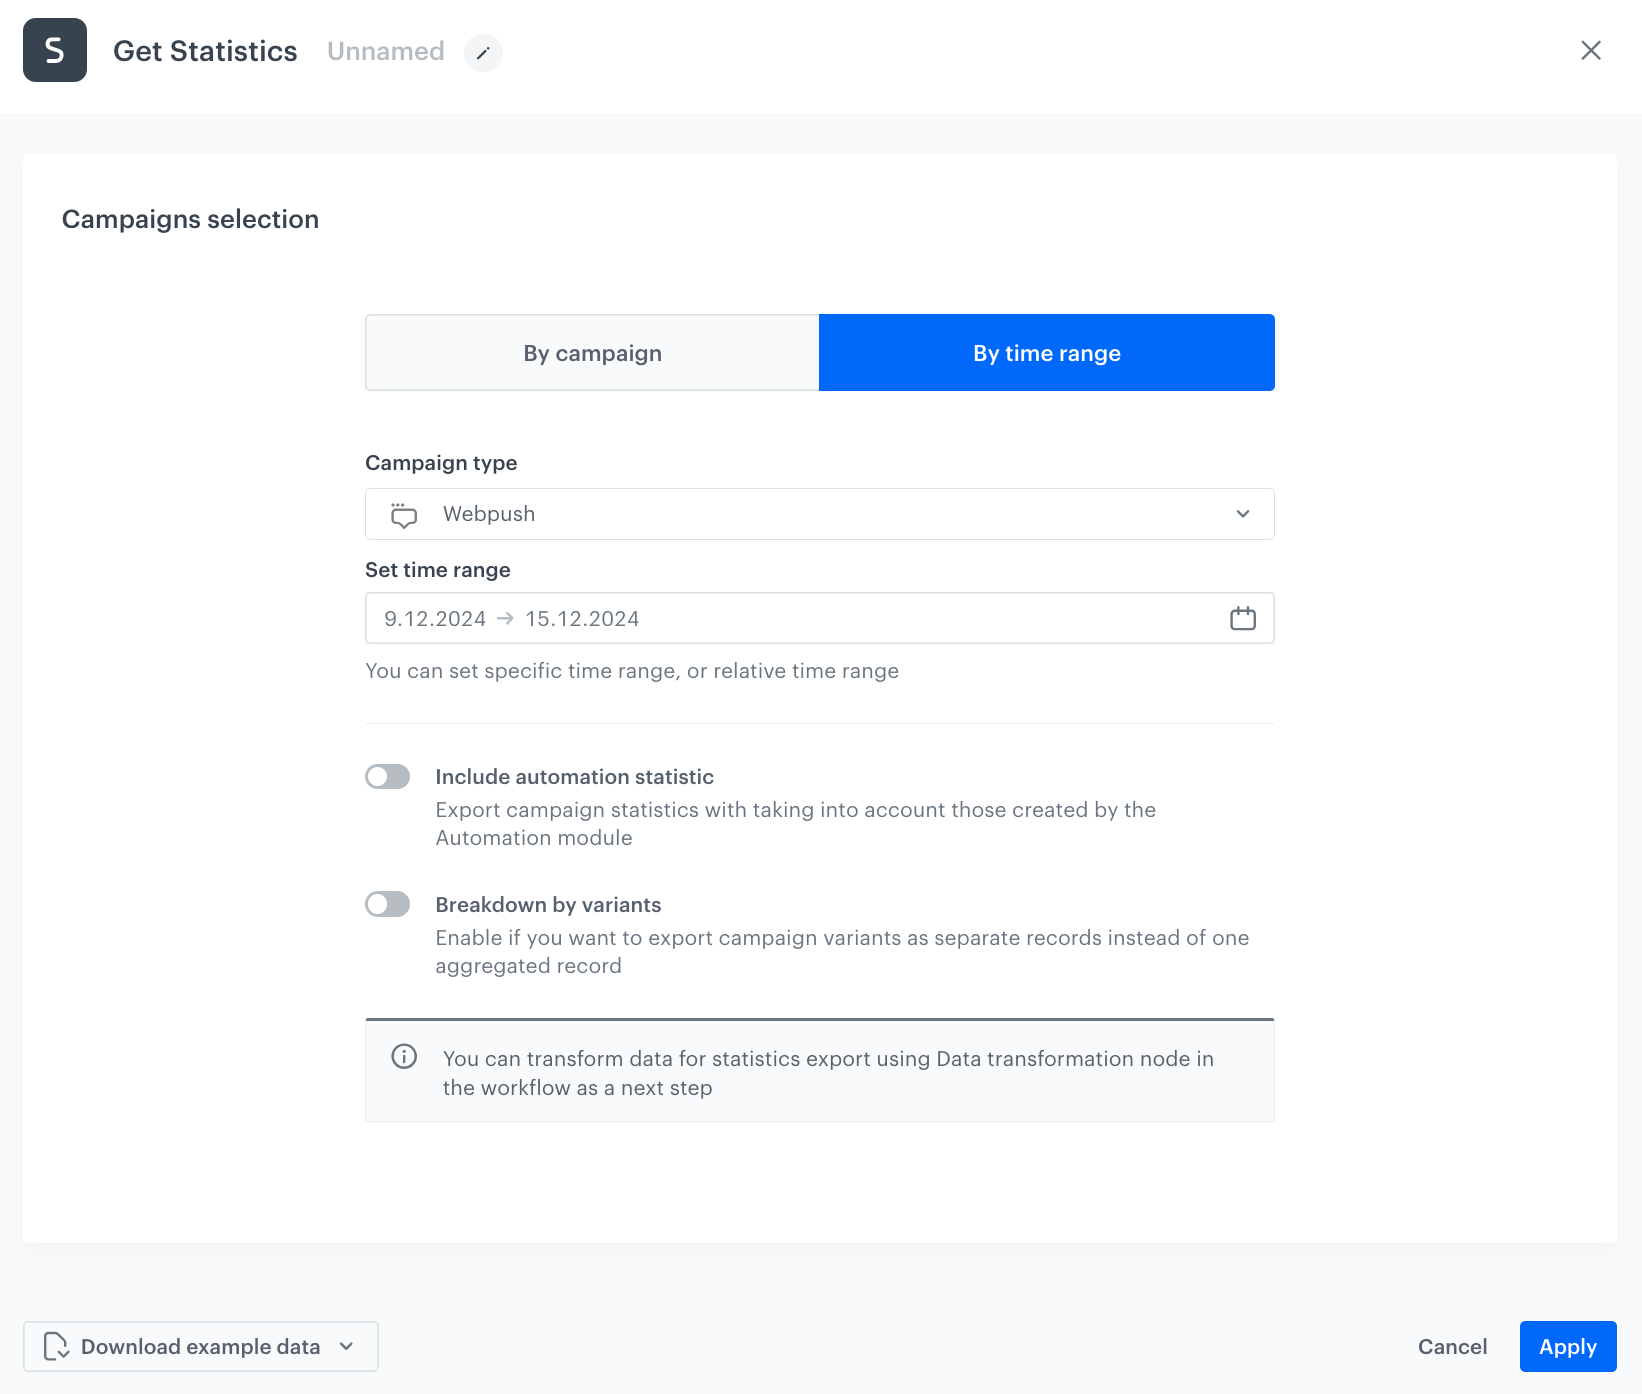
 By default, if statistics of a campaign selected for export contains more than one version (due to A/B testing), the statistics for each variant are a single aggregated record.
 <br><br>
 Campaign statistics data retrieved through the **Get Statistics** node before sending can be [transformed](/docs/automation/data-transformation-and-imports/introduction) to better align their format with specific requirements. To simplify building validation rules, you can download sample data in various formats (.csv, .json, .jsonl).

 </div></div></div>


7. Name your node `Campaigns sent yesterday` so it corresponds with [the Jinjava in the next step](#configure-integration-and-add-the-finishing-node).
8.	Confirm by clicking **Apply**.

<figure>
    <img src="/api/docs/image/54176ad07f146575310749eba44b7c2f42c1b327/use-cases/all-cases/_gfx/gs_getstat.png" alt="Get Statistics Node"  class="full">
    <figcaption>Configuration of the Get Statistics Node</figcaption>
    </figure> 

### Configure Upload Data to Spreadsheet node
---


<div class="admonition admonition-note"><div class="admonition-icon"><svg xmlns="http://www.w3.org/2000/svg" fill="none" viewBox="0 0 24 24" stroke="currentColor" stroke-width="2.5"><path stroke-linecap="round" stroke-linejoin="round" d="M13 16h-1v-4h-1m1-4h.01M21 12a9 9 0 11-18 0 9 9 0 0118 0z" /></svg></div><div class="admonition-body"><div class="admonition-content">

- You must have an account in Google Sheets.
- Your account must have permissions to edit the spreadsheet you want to update.

</div></div></div>


1. Click **Then** and add the **Upload Data to Spreadsheet** node. In the configuration of the node:
    1. Click **Select connection**.
    2. From the dropdown list, select the connection.
    - If no connections are available or you want to create a new one, click the **Select connection** dropdown list, and the **Add connection**. Find how to do it [here](/docs/automation/integration/google-sheets/upload-data-to-spreadsheets#create-a-connection).
    - If you selected an existing connection, proceed to the [Configure integration and add the finishing node](#configure-integration-and-add-the-finishing-node) step.

#### Configure integration and add the finishing node

In this step, fill in the form that allows you to send data from Synerise to a table in Google Sheets.

1. In the **Spreadsheet ID** field, enter the ID of the spreadsheet to which you want to upload data.
You can find the ID in the URL of the spreadsheet.
2. In the **Range** field, define the range of cells to which the data will be uploaded. The values will be appended to the first empty cell available within the indicated range. The value in this field must be given in the A1 notation, for example `Sheet1!A4:A`, then the data will be added in a column to A4 and A5 cells in the `Sheet1` Spreadsheet.
3. As the **Dimension**, select **Rows**.
4. In the **Values** field, paste the Jinjava that loops over the results of the **Get Statistics** node:

        
   <pre><code class="language-jinja">[ {%- datareference node='Campaigns sent yesterday' maxRows=100 -%}
       {%- for r in datareference_result -%}
       ["{{ r.campaignHash }}", "{{ r.campaignTitle }}", "{{ r.campaignType }}", "{{ r.clickRate }}", "{{ r.showRate }}", "{{ r.sendingTime}}", "{{ r.sendingTimeZone}}", "{{ r.uniqueClickCount }}","{{ r.sendingTime }}", "{{ r.uniqueShowCount }}" "{{ r.uniqueCappingCount }}", "{{ r.uniqueSendCount }}", "{{ r.utm.campaign }}", "{{ r.utm.content }}", "{{ r.utm.medium }}", "{{ r.utm.source }}", "{{ r.utm.term }}"] {%- if not(loop.last) -%},{%- endif -%}
       {%- endfor -%}
       {%- enddatareference -%} ]</code></pre>


    <figure>
        <img src="/api/docs/image/54176ad07f146575310749eba44b7c2f42c1b327/use-cases/all-cases/_gfx/gs_node_sp.png" alt="Upload Data to Spreadsheet Node"  class="full">
        <figcaption>The configuration of the Upload Data to Spreadsheet Node</figcaption>
        </figure> 

5. Click **Apply**.
6. After the **Upload Data to Spreadsheet** node, add the **End** node.
7. Confirm by clicking **Save**.
8. In the upper right corner, click **Save & Run**.

<figure>
    <img src="/api/docs/image/54176ad07f146575310749eba44b7c2f42c1b327/use-cases/all-cases/_gfx/gs_dr_wrkflw.png" alt="Workflow configuration"  class="full">
    <figcaption>The configuration of the Workflow</figcaption>
    </figure> 

## Check the use case set up on the Synerise Demo workspace
---

You can check the [workflow configuration](https://app.synerise.com/automations/workflows/automation-diagram/88a74673-e053-4ebc-8181-28f0eaf80f68) directly in Synerise Demo workspace.

If you’re our partner or client, you already have automatic access to the **Synerise Demo workspace (1590)**, where you can explore all the configured elements of this use case and copy them to your workspace.  

If you’re not a partner or client yet, we encourage you to fill out the contact [form](https://demo.synerise.com/request) to schedule a meeting with our representatives. They’ll be happy to show you how our demo works and discuss how you can apply this use case in your business.

## Read more
---
- [Automation Hub](/docs/automation)
- [Automation inserts](/developers/inserts/automation#data-context)
