
The Reports feature in Synerise gives lots of opportunities to create custom reports adjusted to your business needs and the data you store in the workspace. Thanks to data transformation and automation, you can create the mechanism of exporting reports to your external resource cyclically. 

In this use case we will describe how to export a report to an SFTP server every day. We will also create a data transformation diagram which changes the name of a column in the report before sending it. 


<div class="admonition admonition-note"><div class="admonition-icon"><svg xmlns="http://www.w3.org/2000/svg" fill="none" viewBox="0 0 24 24" stroke="currentColor" stroke-width="2.5"><path stroke-linecap="round" stroke-linejoin="round" d="M13 16h-1v-4h-1m1-4h.01M21 12a9 9 0 11-18 0 9 9 0 0118 0z" /></svg></div><div class="admonition-body"><div class="admonition-content">

Completing this procedure requires some knowledge on sending API requests using cURL, Postman, or similar tools.

</div></div></div>


## Prerequisites
---
- Create a catalog in your SFTP server in which your reports will be stored.
- Create a [report](/docs/analytics/reports) that will be exported to the SFTP server.

  <div class="admonition admonition-tip"><div class="admonition-icon"><svg xmlns="http://www.w3.org/2000/svg" fill="none" viewBox="0 0 24 24" stroke="currentColor" stroke-width="2.5"><path stroke-linecap="round" stroke-linejoin="round" d="M9.663 17h4.673M12 3v1m6.364 1.636l-.707.707M21 12h-1M4 12H3m3.343-5.657l-.707-.707m2.828 9.9a5 5 0 117.072 0l-.548.547A3.374 3.374 0 0014 18.469V19a2 2 0 11-4 0v-.531c0-.895-.356-1.754-.988-2.386l-.548-.547z" /></svg></div><div class="admonition-body"><div class="admonition-content">

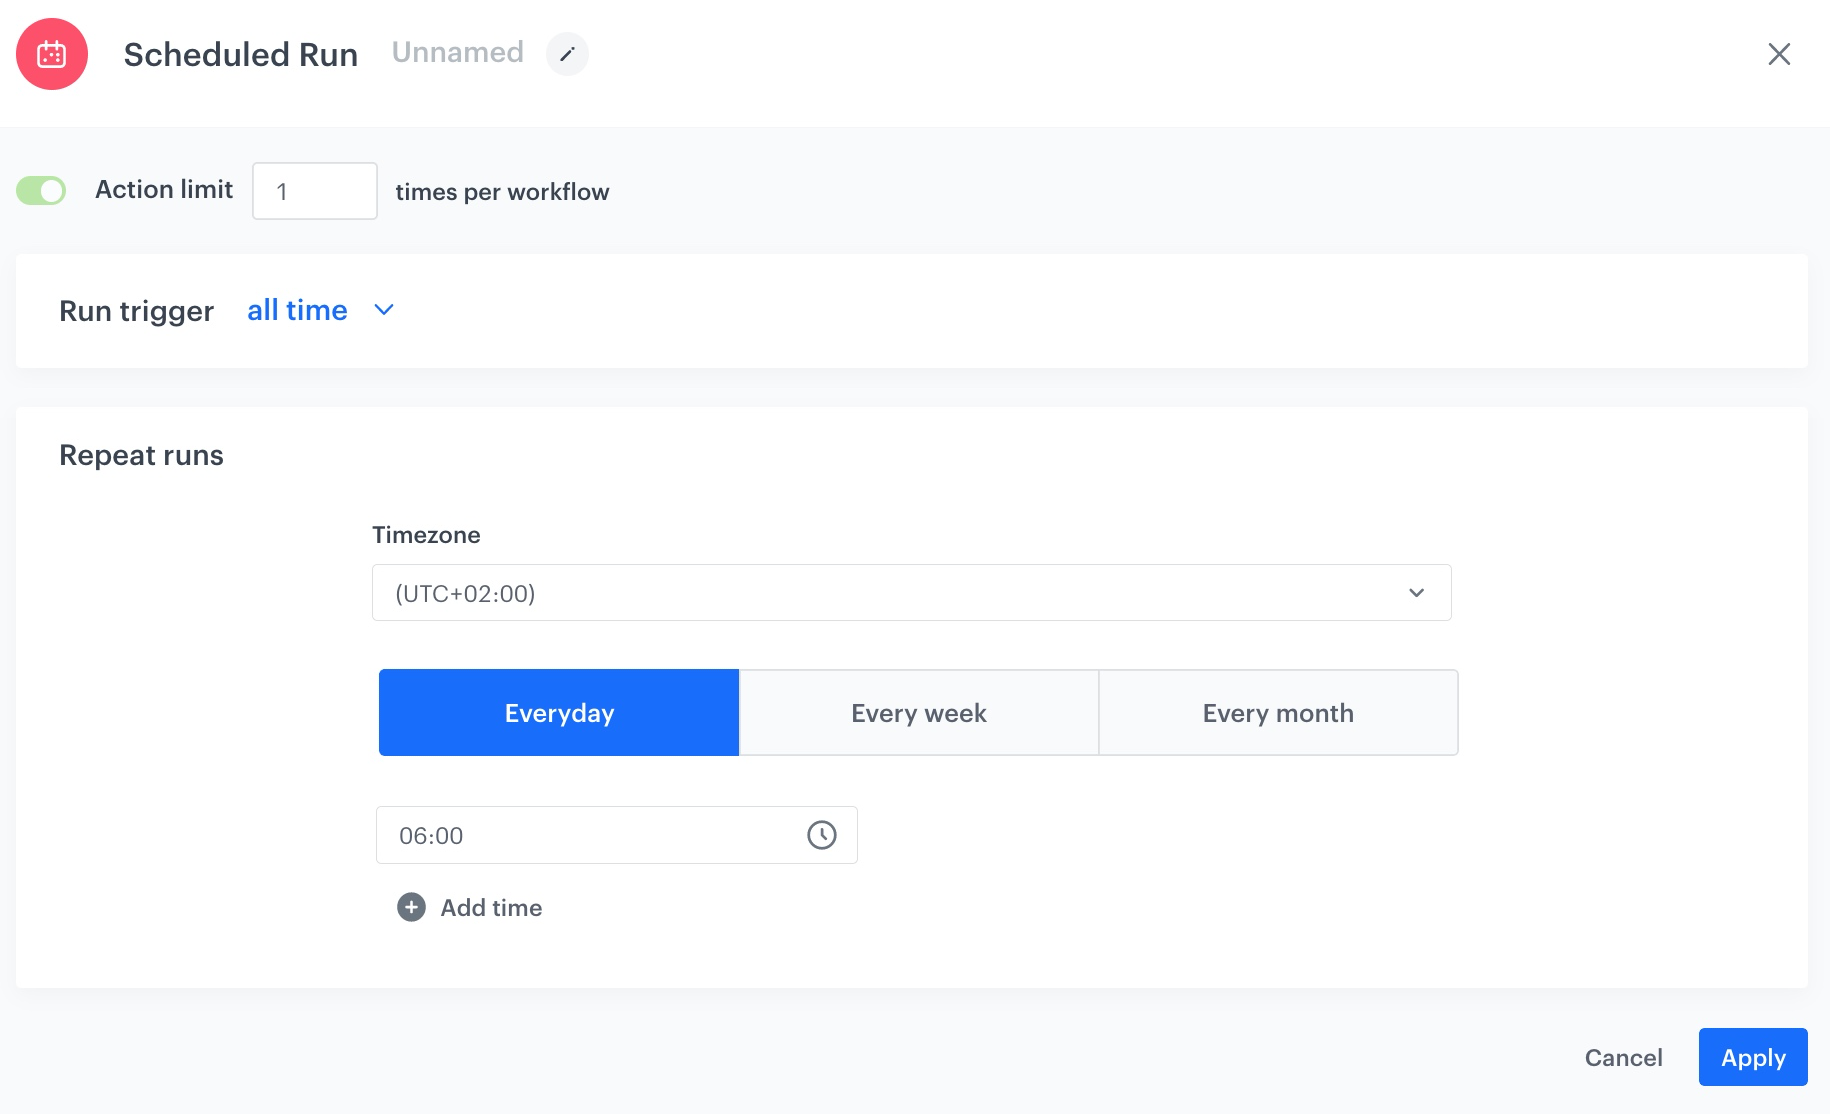
  The time scope of the report should be adjusted to the frequency of exporting data. For example, if you export the report every day, it should have the time scope set to **Yesterday** - thanks to this, you will export data each day from the previous day.

  </div></div></div>

- Create a workspace [API key](/docs/settings/tool/api) with the permission required by [the "Preview report as CSV method](https://developers.synerise.com/AnalyticsSuite/AnalyticsSuite.html#operation/previewAllGroupingsCSVPOST_v4).

## Process
---
1. [Prepare a file with sample data](/use-cases/export-report-sftp#prepare-a-file-with-sample-data).
2. [Create data transformation diagram](/use-cases/export-report-sftp#create-data-transformation-diagram).  
3. [Create a workflow](/use-cases/export-report-sftp#create-a-workflow).

## Prepare a file with sample data
---
In this part of the process, you need to prepare a file with sample data which will be used to create Data Transformation later.

1. Go to <img src="/api/docs/image/54176ad07f146575310749eba44b7c2f42c1b327/icons/decision-hub-icon.svg" alt="Decision Hub icon" class="icon" > **Decision Hub > Reports**.  
2. From the list, select the report you created for exporting. 
3. Click the **Preview** tab.
4. Click **Download CSV**.  
5. Open the file in text editor and remove rows from it until 10 are left. This copy is only needed as a file sample for creating the Data Transformation. 


## Create data transformation diagram
---

In this part of the process, we define the rules of modifying data before sending it to the SFTP server. Each report exported from Synerise has a column named `Value`, which contains the value of metric used in the report. For the purposes of this use case, we will change the name of this column to `number of clicks`.  

The data transformation diagram which is the output of this part of the process is used later to [automate sending the data](/use-cases/export-report-sftp#create-a-workflow).  

1. Go to <img src="/api/docs/image/54176ad07f146575310749eba44b7c2f42c1b327/icons/automation-hub-icon.svg" alt="Automation Hub icon" class="icon" > **Automation > Data Transformation > Create transformation**.  
2. Enter the name of the transformation.  
3. Click **Add input**.  

### Add file with sample data

The **Data input** node allows you to add a data sample. In further steps, you define how the data must be modified. Later, when this transformation is used in the Automation workflow, the system uses the rules created with the sample data as a pattern for modifying actual data.

4. On the pop-up, click **Add example**.  
5. Upload the file prepared in [this step](/use-cases/export-report-sftp#prepare-a-file-with-sample-data).  
6. Change the default delimiter to `;`.
    <figure><img src="/api/docs/image/54176ad07f146575310749eba44b7c2f42c1b327/use-cases/all-cases/_gfx/data-input-dt.png" class="full" alt="The configuration of the Data input node"><figcaption>The configuration of the Data input node</figcaption></figure>
6. Click **Generate**.  

### Change the name of the column

7. On the canvas, click the right mouse button.  
8. From the dropdown list, select **Rename column**.
9. Click the **Rename column** node.  
10. In the configuration of the node:  
    1. Click **Add rule**.  
    2. Click **Add column**.  
    3. Select the **Value** column.  
    4. Under **Edit values by**, from the dropdown list, select **Replacing**.  
    6. In the text field, enter `number of clicks`.
        <figure><img src="/api/docs/image/54176ad07f146575310749eba44b7c2f42c1b327/use-cases/all-cases/_gfx/rename-column-dt.png" class="full" alt="The configuration of the Rename column node"><figcaption>The configuration of the Rename column node</figcaption></figure>  
    7. Confirm by clicking **Apply**.


### Add the finishing node

This node lets you preview the output of the modifications to the sample data.

14. On the canvas, click the right mouse button.
15. From the dropdown list, select **Data output**.  
15. In the upper right corner, click **Save and publish**.  
    **Result**: You have published a Data Transformation diagram and it can now be used in a Workflow.
    <figure><img src="/api/docs/image/54176ad07f146575310749eba44b7c2f42c1b327/use-cases/all-cases/_gfx/diagram-dt-output.png" class="full" alt="The diagram of data transformation"><figcaption>The diagram of data transformation</figcaption></figure>


## Create a workflow
---
In this part of the process, you will create the workflow that exports report data to SFTP server every day at 6:00 AM.

1. Go to <img src="/api/docs/image/54176ad07f146575310749eba44b7c2f42c1b327/icons/automation-hub-icon.svg" alt="Automation Hub icon" class="icon" > **Automation Hub > Workflows > New workflow**.  
2. Enter the name of the workflow.  

### Define the launch date

3. As the trigger node, add **Scheduled Run**.  
4. In the configuration of the node:  
    1. Leave the **Run trigger** option at default (**all time**).  
    2. From the **Timezone** dropdown list, select the time zone consistent with the timezone selected for your workspace.  
    3. Define the frequency of the workflow. In this use case, it's every day at 6:00 AM. 
    The workflow will automatically launch everyday at 6:00 AM.  
    <figure><img src="/api/docs/image/54176ad07f146575310749eba44b7c2f42c1b327/use-cases/all-cases/_gfx/synchronize-scheduled-run.png" class="full" alt="The configuration of the Scheduled Run node"><figcaption>The configuration of the Scheduled Run node</figcaption></figure>

    4. Confirm by clicking **Apply**.

### Define the report that will be exported

In this part of the process, we need to define an HTTPS request in the **Get File** node which retrieves a CSV file with report data. The full documentation of this request is available [here](https://developers.synerise.com/AnalyticsSuite/AnalyticsSuite.html#operation/previewAllGroupingsCSVPOST_v4).

1. Click **THEN** and from the dropdown list, select **HTTPS > Get File**.  
2. In the configuration of the node:  
    1. From the **Method** dropdown menu, select **POST**.
    2. Enter the **URL**: `https://api.synerise.com/analytics/analytics/v4/reports/preview-csv`
    3. From the **File format** dropdown menu, select **CSV**.
    4. Change the default **Delimiter** to `;`.
    5. Add the JSON body of the request:
         1. In a new browser tab, open the report you want to export.
         2. Open the browser's developer tools and go to the tab where you can preview HTTP requests.
         3. In the report, go to the **Preview** tab.
         4. In the developer tools, locate the request to the `analytics/v4/reports/preview-csv` endpoint and copy its request body.
         5. Paste the request body into the **Body** field of the automation node.
    
       <div class="admonition admonition-tip"><div class="admonition-icon"><svg xmlns="http://www.w3.org/2000/svg" fill="none" viewBox="0 0 24 24" stroke="currentColor" stroke-width="2.5"><path stroke-linecap="round" stroke-linejoin="round" d="M9.663 17h4.673M12 3v1m6.364 1.636l-.707.707M21 12h-1M4 12H3m3.343-5.657l-.707-.707m2.828 9.9a5 5 0 117.072 0l-.548.547A3.374 3.374 0 0014 18.469V19a2 2 0 11-4 0v-.531c0-.895-.356-1.754-.988-2.386l-.548-.547z" /></svg></div><div class="admonition-body"><div class="admonition-content">

       You can also build the request body manually, according to the [documentation](https://developers.synerise.com/AnalyticsSuite/AnalyticsSuite.html#operation/previewAllGroupingsCSVPOST_v4).

       </div></div></div>

    6. In the **Authorization** section, choose the API key with the required permissions (according to the [documentation](https://developers.synerise.com/AnalyticsSuite/AnalyticsSuite.html#operation/previewAllGroupingsCSVPOST_v4)).
    7. Leave the rest of the settings as default.
    <figure><img src="/api/docs/image/54176ad07f146575310749eba44b7c2f42c1b327/use-cases/all-cases/_gfx/get-file-http-report.png" class="full" alt="The configuration of the Get File node"><figcaption>The configuration of the Get File node</figcaption></figure>
3. Confirm by clicking **Apply**.  

### Select the data transformation rules

1. Add a **Data Transformation** node.  
2. In the configuration of the node, select the [data transformation you have created before](/use-cases/export-report-sftp#create-data-transformation-diagram).  
    <figure><img src="/api/docs/image/54176ad07f146575310749eba44b7c2f42c1b327/use-cases/all-cases/_gfx/data-transformation-preview.png" class="full" alt="The configuration of the Data Transformation node"><figcaption>The configuration of the Data Transformation node</figcaption></figure>

3. Confirm by clicking **Apply**.  

### Configure settings for SFTP protocol

In this part of the process, we will configure the settings for an SFTP connection so that your report, after passing through transformation rules, can be stored in the external resource.

1. Add the **Send File** node by clicking **THEN > SFTP**.  
2. In the configuration of the node:  
    1. Enter the path to your server.  
    2. Select the port.
    3. Enter the path to the directory.
    4. Enter the name of the file that the report will be saved as.  
    5. If needed, in the **File name suffix**, select the suffix of the file name.  
    
       <div class="admonition admonition-tip"><div class="admonition-icon"><svg xmlns="http://www.w3.org/2000/svg" fill="none" viewBox="0 0 24 24" stroke="currentColor" stroke-width="2.5"><path stroke-linecap="round" stroke-linejoin="round" d="M9.663 17h4.673M12 3v1m6.364 1.636l-.707.707M21 12h-1M4 12H3m3.343-5.657l-.707-.707m2.828 9.9a5 5 0 117.072 0l-.548.547A3.374 3.374 0 0014 18.469V19a2 2 0 11-4 0v-.531c0-.895-.356-1.754-.988-2.386l-.548-.547z" /></svg></div><div class="admonition-body"><div class="admonition-content">

       We recommend choosing the **Date** suffix, which adds the current date to the file name, so that the names of your files do not repeat in the catalog (files will be sent every day) and are easier to browse.

       </div></div></div>

    6. From the **File format** dropdown list, select the **CSV** format.  
    7. Change the default **Delimiter** to `;`.
    8. In the **Authentication** section, select the method of authentication.  
    9. Confirm by clicking **Apply**. 
    
### Add the finishing node

1. Add the **End** node. 
2. In the upper right corner, click **Save & Run**.  
    <figure><img src="/api/docs/image/54176ad07f146575310749eba44b7c2f42c1b327/use-cases/all-cases/_gfx/final-config-workflow.png" class="full" alt="The workflow configuration"><figcaption>The workflow configuration</figcaption></figure>

You can monitor the flow of the workflow in the **Transformation logs** tab. It contains information about each execution of the workflow.  
    <figure><img src="/api/docs/image/54176ad07f146575310749eba44b7c2f42c1b327/use-cases/all-cases/_gfx/synchronize-logs.png" class="full" alt="The logs for the workflow"><figcaption>The logs for the workflow</figcaption></figure>

## Check the use case set up on the Synerise Demo workspace
---

You can check the configuration of use case in Synerise Demo workspace:
- [Created workflow](https://app.synerise.com/automations/automation-diagram/ddd30f46-9f9f-4427-a835-97324ffd3da1)
- [Data transformation rules](https://app.synerise.com/automations/data-transformation/04802b73-f425-494e-9a5d-c1e807b1d0e7).

If you’re our partner or client, you already have automatic access to the **Synerise Demo workspace (1590)**, where you can explore all the configured elements of this use case and copy them to your workspace.  

If you’re not a partner or client yet, we encourage you to fill out the contact [form](https://demo.synerise.com/request) to schedule a meeting with our representatives. They’ll be happy to show you how our demo works and discuss how you can apply this use case in your business.

## Read more
---
- [Automation Hub](/docs/automation) 
- [Data Transformation](/docs/automation/data-transformation-and-imports/introduction)  
- [Reports](/docs/analytics/reports)

