
If you want your campaigns to bring the best results, you should target customers who are genuinely interested in a given offer. This approach allows you to reach customer who will be more likely to convert and also helps you optimize the cost of carrying out these campaigns. 

This use case describes the process of creating a favorite-brand email campaign targeting customers with the highest propensity to buy products from specific brands. One of the challenges addressed in this use case is the use of **percentile** to obtain TOP 30% of customers mostly interested in the specific brand.


<div class="admonition admonition-note"><div class="admonition-icon"><svg xmlns="http://www.w3.org/2000/svg" fill="none" viewBox="0 0 24 24" stroke="currentColor" stroke-width="2.5"><path stroke-linecap="round" stroke-linejoin="round" d="M13 16h-1v-4h-1m1-4h.01M21 12a9 9 0 11-18 0 9 9 0 0118 0z" /></svg></div><div class="admonition-body"><div class="admonition-content">

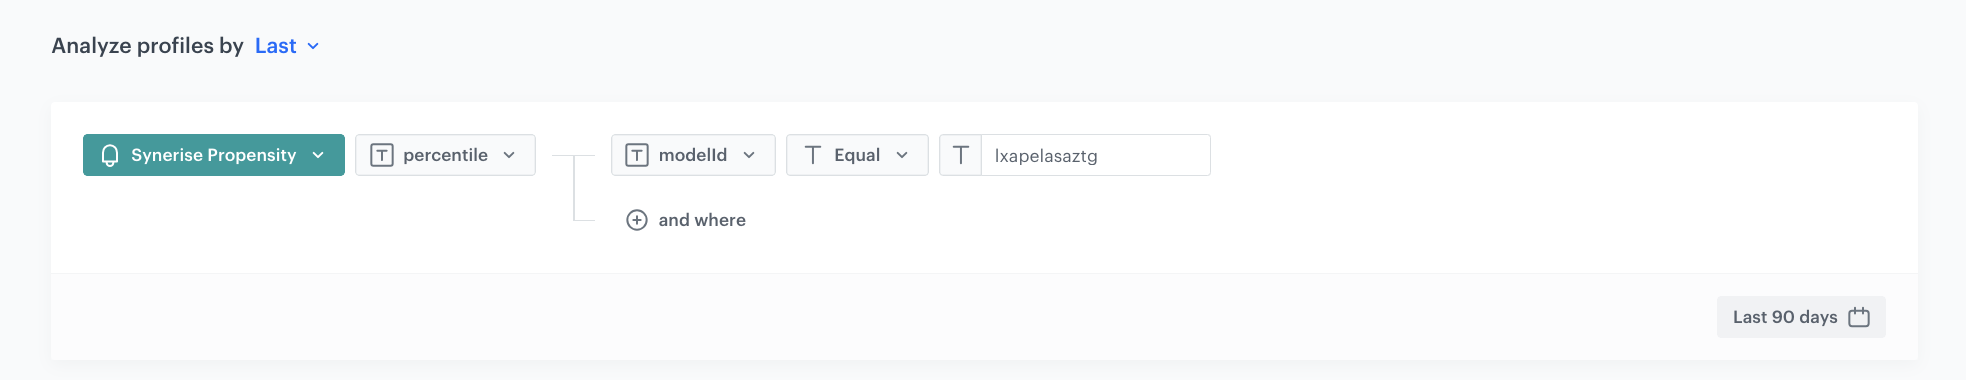
Percentile is a score below which a specified percentage of customers from an analyzed group falls. For instance, the 50th percentile means that 50% of the customers have lower score than this one. Percentiles are especially useful whenever you direct communication only to a certain number of customers. Let’s assume that you want to make a propensity for a segment that is made up of 100 000 customers, and you want to send a message only to 10 000 of them. In this case, you can pick TOP 10% of customers with the highest score: in terms of percentiles this value is expressed as “over the 90th percentile”.

</div></div></div>


## Prerequisites
---
- Implement transaction events using [SDK](/developers/web/transactions-sdk) or [API](https://developers.synerise.com/DataManagement/DataManagement.html#operation/CreateATransaction).
- [Import your item feed to AI engine](/docs/ai-hub/recommendations-v2/item-feed-requirements). The item feed must include information about item brand and that attribute must be added to [filterable attributes](/docs/ai-hub/ai-search/define-attributes#filterable-attributes).
- Prepare the propensity prediction following this [use case](/use-cases/propensity-brand). As an audience, [select the segmentation](/docs/analytics/segmentations/creating-segmentations) with your entire newsletter base.


  <div class="admonition admonition-note"><div class="admonition-icon"><svg xmlns="http://www.w3.org/2000/svg" fill="none" viewBox="0 0 24 24" stroke="currentColor" stroke-width="2.5"><path stroke-linecap="round" stroke-linejoin="round" d="M13 16h-1v-4h-1m1-4h.01M21 12a9 9 0 11-18 0 9 9 0 0118 0z" /></svg></div><div class="admonition-body"><div class="admonition-content">

  The purpose of the propensity prediction is to find the customers who are most likely to make a purchase of the specific brand among all the customers in your newsletter database. </br>
  The result of the calculation is a `snr.propensity.score` event on the profiles of customers (from your newsletter database) for whom there is enough data to calculate scoring. The `percentile` parameter of the event will be used in the further parts of the process to create a group of customers with the highest score.

  </div></div></div>


- [Create an email account](/docs/campaign/e-mail/configuring-email-account).
- [Create an email template](/docs/campaign/e-mail/creating-email-templates) with products of the brands for which the propensity prediction was created.


  <div class="admonition admonition-tip"><div class="admonition-icon"><svg xmlns="http://www.w3.org/2000/svg" fill="none" viewBox="0 0 24 24" stroke="currentColor" stroke-width="2.5"><path stroke-linecap="round" stroke-linejoin="round" d="M9.663 17h4.673M12 3v1m6.364 1.636l-.707.707M21 12h-1M4 12H3m3.343-5.657l-.707-.707m2.828 9.9a5 5 0 117.072 0l-.548.547A3.374 3.374 0 0014 18.469V19a2 2 0 11-4 0v-.531c0-.895-.356-1.754-.988-2.386l-.548-.547z" /></svg></div><div class="admonition-body"><div class="admonition-content">

  In the email template, we recommend to use personalized AI campaign to retreive products from the specific brand chosen by AI engine for the customer. Read more about [creating AI campaign](/docs/ai-hub/recommendations-v2/creating-recommendation-campaign), [applying filters](/docs/ai-hub/recommendations-v2/recommendation-filters) and [inserting it to email templates](/developers/inserts/recommendations-v2)

  </div></div></div>


## Process
---

In this use case, you will go through the following steps:
1. [Create an aggregate](/use-cases/favorite-brand#create-an-aggreagate) to enable using the result of the latest propensity prediction as a customer parameter in a segmentation.
2. [Create a segmentation](/use-cases/favorite-brand#create-a-segmentation) based on that aggregate to set an audience for use in communication.

## Create an aggreagate
---
Based on the `snr.propensity.score` event, create an aggregate that returns the most recent value of the [percentile](/docs/glossary#percentiles) parameter for a customer.


<div class="admonition admonition-tip"><div class="admonition-icon"><svg xmlns="http://www.w3.org/2000/svg" fill="none" viewBox="0 0 24 24" stroke="currentColor" stroke-width="2.5"><path stroke-linecap="round" stroke-linejoin="round" d="M9.663 17h4.673M12 3v1m6.364 1.636l-.707.707M21 12h-1M4 12H3m3.343-5.657l-.707-.707m2.828 9.9a5 5 0 117.072 0l-.548.547A3.374 3.374 0 0014 18.469V19a2 2 0 11-4 0v-.531c0-.895-.356-1.754-.988-2.386l-.548-.547z" /></svg></div><div class="admonition-body"><div class="admonition-content">

In this step, you will need the ID of the prediction you created before. In the list of predictions, click the <img src="/api/docs/image/54176ad07f146575310749eba44b7c2f42c1b327/icons/threedoticon.png" alt="Three dot icon" class="icon" > icon on the prediction and the ID will be available at the bottom of the context menu.

</div></div></div>


1. Go to <img src="/api/docs/image/54176ad07f146575310749eba44b7c2f42c1b327/icons/behavioral-data-hub-icon.svg" alt="Behavioral Data Hub icon" class="icon"> **Behavioral Data Hub > Live Aggregates > Create aggregate**.
2. As the aggregate type, select **Profile**.  
2. Enter a meaningful name of the aggregate.
2. Click **Analyze profiles by** and select **Last**.  
3. Select the **snr.propensity.score** event.
4. As the event parameter, select **percentile**. 
5. Click **+ where**.
6. From the **Choose parameter** dropdown list, select **modelId**. 
7. As the logical operator, select **Equal**.  
8. In the text field, enter the value of the modelId parameter.
9. As the date range, select **Last 30 days**.
10. Save the aggregate.

 <figure><img src="/api/docs/image/54176ad07f146575310749eba44b7c2f42c1b327/use-cases/all-cases/_gfx/favorite-brand-aggregate.png" class="full" alt="The final configuration of the aggregate"><figcaption>The final configuration of the aggregate </figcaption></figure>

## Create a segmentation
---
Create a segmentation of customers based on the results of [the aggregate you created](/use-cases/favorite-brand#create-an-aggreagate) in the previous part of the process. This segmentation contains 30% of customers with the highest scoring (customers who are most interested in the selected brands).


<div class="admonition admonition-tip"><div class="admonition-icon"><svg xmlns="http://www.w3.org/2000/svg" fill="none" viewBox="0 0 24 24" stroke="currentColor" stroke-width="2.5"><path stroke-linecap="round" stroke-linejoin="round" d="M9.663 17h4.673M12 3v1m6.364 1.636l-.707.707M21 12h-1M4 12H3m3.343-5.657l-.707-.707m2.828 9.9a5 5 0 117.072 0l-.548.547A3.374 3.374 0 0014 18.469V19a2 2 0 11-4 0v-.531c0-.895-.356-1.754-.988-2.386l-.548-.547z" /></svg></div><div class="admonition-body"><div class="admonition-content">

The value of percentiles can be tailored to your business needs.

</div></div></div>


1. Go to **Decision Hub > Segmentations > New segmentation**.  
2. Enter the name of the segmentation.  
3. Click **Choose filter**.  
4. From the dropdown list, select the [aggregate you created before](/use-cases/favorite-brand#create-an-aggreagate).  
5. As the logical operator, select **More or equal**.  
6. In the text field, enter `70`.
7. Save the segmentation. 


<figure><img src="/api/docs/image/54176ad07f146575310749eba44b7c2f42c1b327/use-cases/all-cases/_gfx/favorite-brand-segmentation.png" class="full" alt="The final configuration of the segmentation"><figcaption>The final configuration of the segmentation </figcaption></figure>


## What's next
---
Go to **Experience Hub > Email** and create the Email communication with the template created before. As the audience of the communication, use [the segmentation you created](/use-cases/favorite-brand#create-a-segmentation).

## Check the use case set up on the Synerise Demo workspace
---
You can check the configuration of every element of this process directly in Synerise Demo workspace:

- [Propensity prediction](https://app.synerise.com/ai-v2/predictions/propensity/pngsuydybpkq)
- [Aggregate](https://app.synerise.com/analytics/aggregates/eee8bfa1-0f75-32a8-8ee5-8e3a36812112)
- [Segmentation](https://app.synerise.com/analytics/segmentations/adbfd118-8f98-4b6f-904b-e90f2f592231)

If you’re our partner or client, you already have automatic access to the **Synerise Demo workspace (1590)**, where you can explore all the configured elements of this use case and copy them to your workspace.  

If you’re not a partner or client yet, we encourage you to fill out the contact [form](https://demo.synerise.com/request) to schedule a meeting with our representatives. They’ll be happy to show you how our demo works and discuss how you can apply this use case in your business.

## Read more
---
- [Alternative way of preparing segmentation based on propensity](/use-cases/segmentation-propensity-based)
- [Email communication](/docs/campaign/e-mail/introduction-to-email-campaigns)
- [Prediction overview](/docs/ai-hub/predictions/predictions-introduction)
- [Propensity predictions](/docs/ai-hub/predictions/propensity)
- [Segmentation](/docs/analytics/segmentations)
