There are many criteria by which you can create a variety of customer segmentations. The measures you choose will largely depend on the business goal you want to achieve. One of the possible goals may be to keep heavy buyers engaged. Heavy buyers are those customers who do an above-average amount of shopping. Heavy customers typically make up less than one-third of consumers of goods or services but account for more than two-thirds of sales revenue. That is why companies try to take special care of this group of customers.
This use case describes the process of identifying heavy buyers whose buying activity has declined in the current period and reactivating them with communications containing personalized offers that will prompt them to make a purchase.
## Prerequisites
---
Implement [transaction events](https://developers.synerise.com/DataManagement/DataManagement.html#tag/Events).
## Process
---
- [Create a segmentation of heavy buyers](/use-cases/find-heavy-buyers#create-a-segmentation-of-heavy-buyers)
- [Create a segmentation of heavy buyers whose buying behavior has changed over the past year](/use-cases/find-heavy-buyers#create-a-segmentation-of-heavy-buyers-whose-buying-behavior-has-changed-over-the-past-year)
## Create a segmentation of heavy buyers
---
In this part of the process, you will create a segmentation of heavy buyers based on the number of transactions generated by these customers in the previous period. Before you proceed to creating the segmentation, you will create an aggregate and metric which you will use in the conditions of the segmentation.
Depending on your business needs, you can create a segmentation of heavy buyers based on various criteria and choose a period that meets your requirements.
### Create an aggregate
Create an aggregate that sums up the number of transactions in the previous period.
1. Go to **Behavioral Data Hub > Live Aggregates > Create aggregate**.
2. As the aggregate type, select **Profile**.
2. Enter the name of the aggregate.
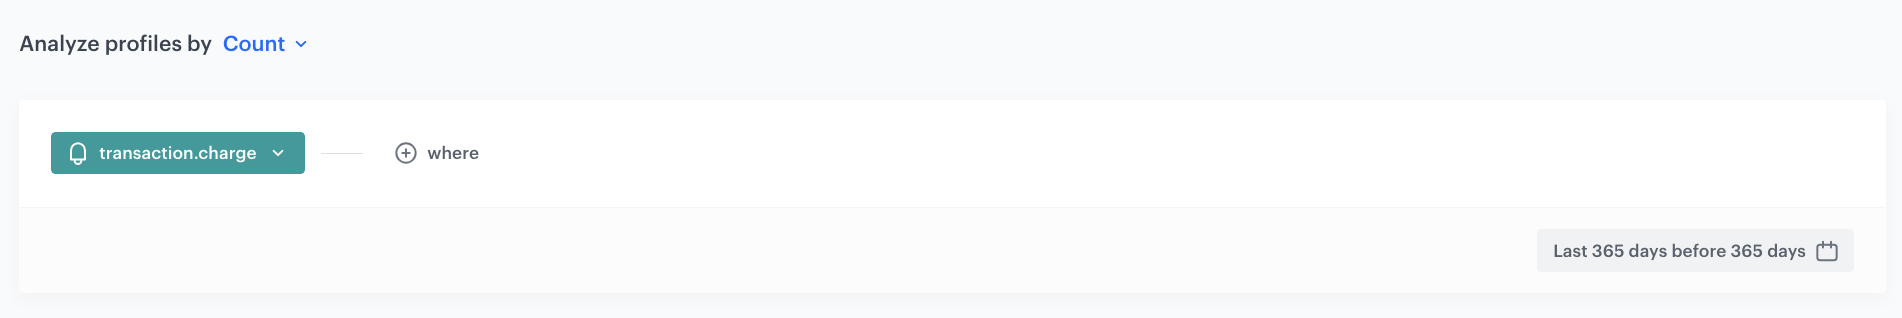
3. Click **Analyze profiles by** and select **Count** (then the aggregate result shows the total number of transactions in the time range selected in the analysis).
4. From the **Choose event** dropdown list, select the **transaction.charge** event.
Events may have different labels between workspaces, but you can always find them by their action name (in this step, it’s **transaction.charge**).
5. Change the date range, by clicking the calendar icon. Create the following custom date range `last 365 days before 365 days`.
6. Confirm the changes with the **Apply** button.
7. Save the aggregate by clicking **Save**.
Example settings of the aggregate
### Create a metric
Create a metric that sets a cutoff value for the customer segment with the highest number of transactions.
1. Go to **Decision Hub > Metrics > New metric**.
2. Enter the name of the metric.
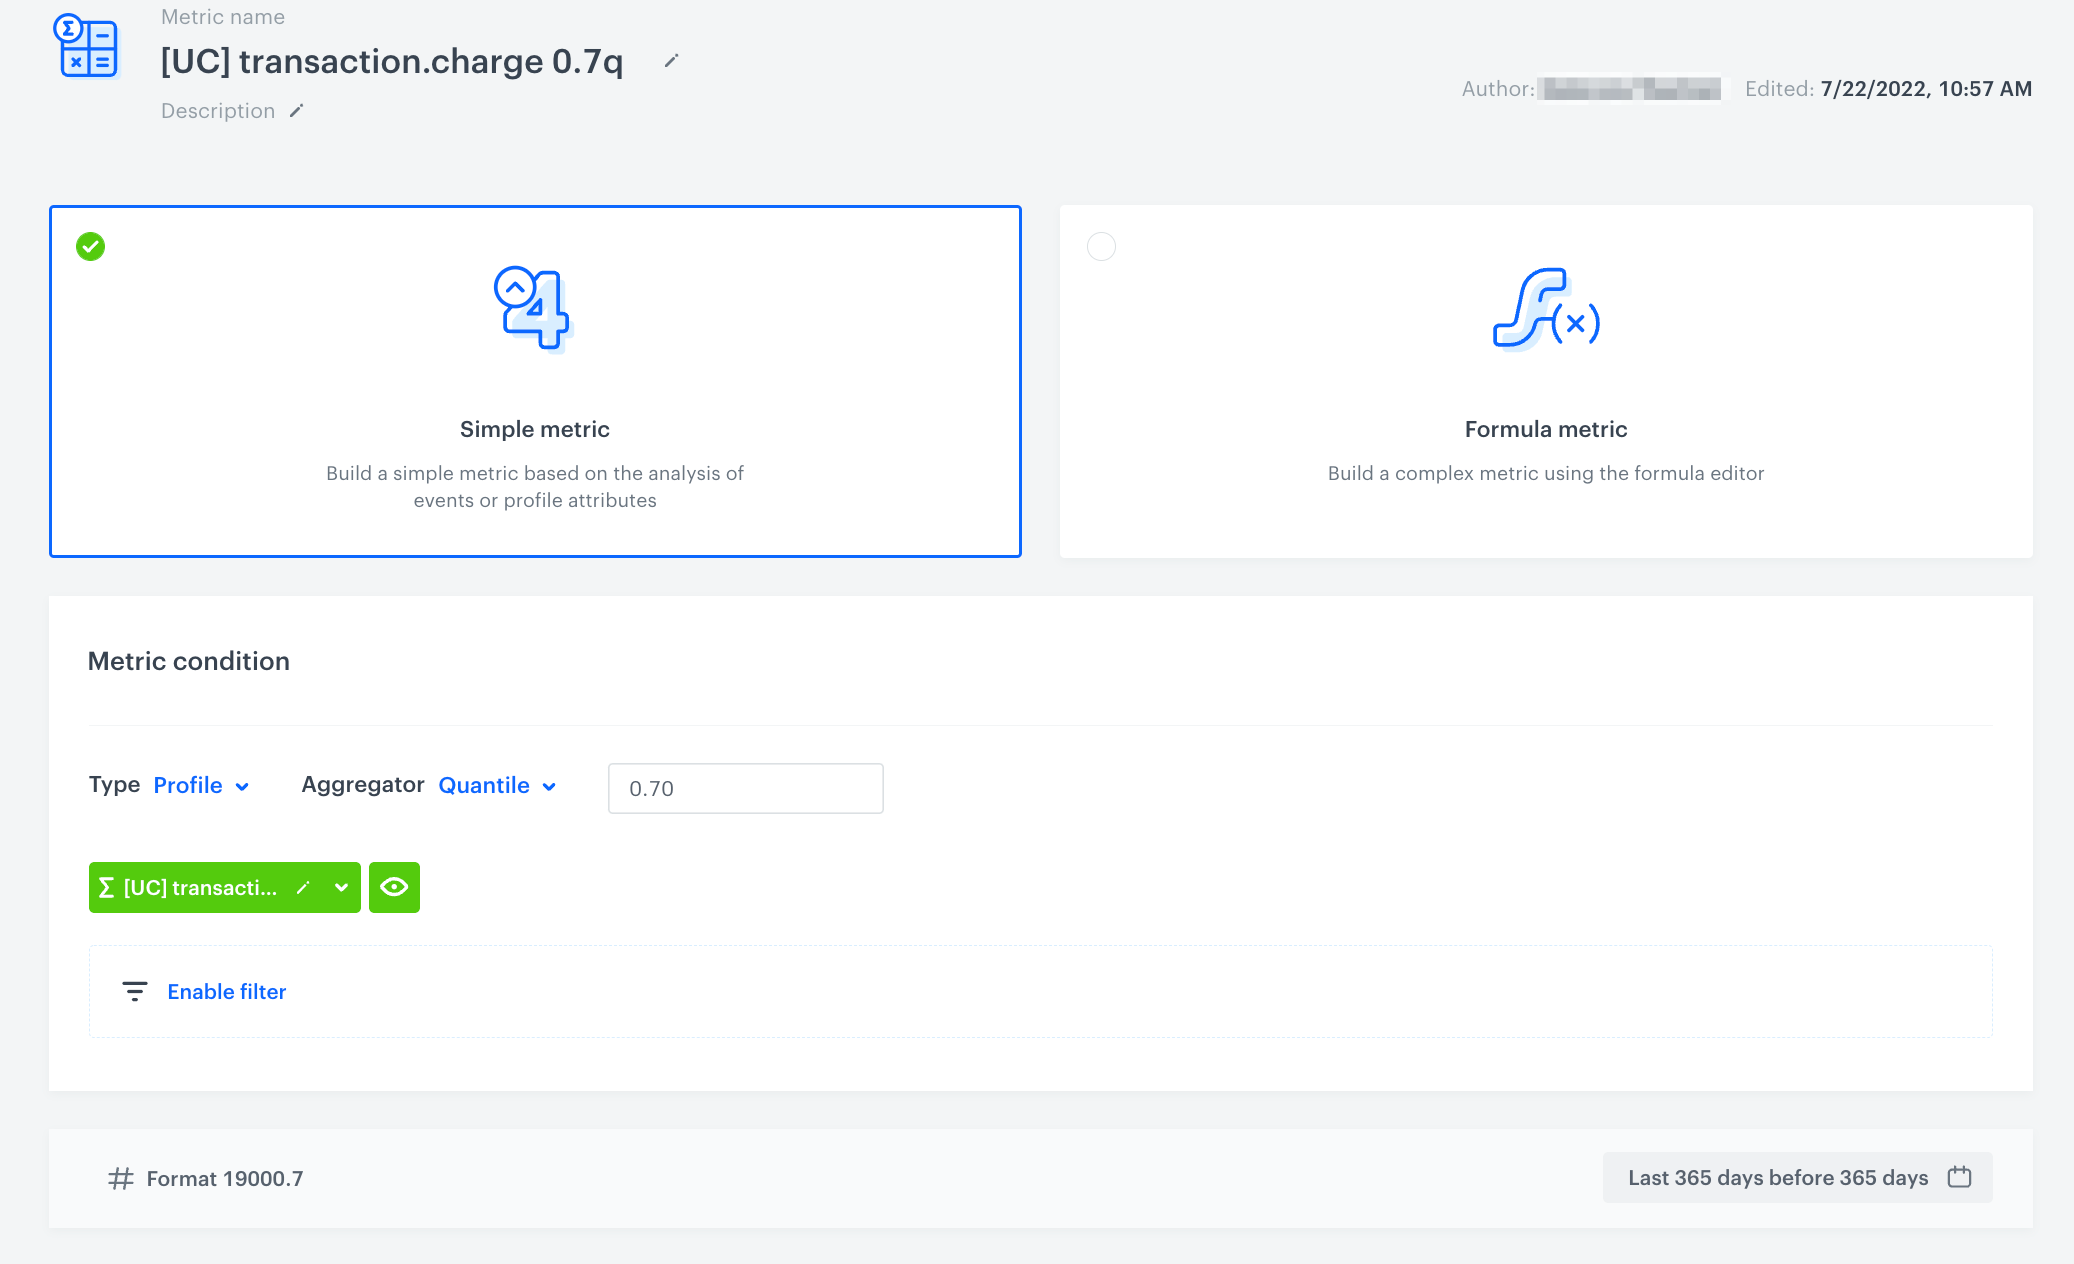
3. As a metric kind, select **Simple metric**.
4. As a metric type, select **Profile**.
5. As the aggregator, set **Quantile**.
Quantile is used to divide a sample of data into equal-sized subgroups
6. In the input field which appears next to the aggregator, type `0.7` (to create a cutoff that defines the highest number of values).
7. Click **Choose event**.
8. From the dropdown list, select the [aggregate you created before](/use-cases/find-heavy-buyers#create-an-aggregate).
9. Define the same time range as in the aggregate you use in the metric.
10. Click **Save**.
The final configuration of the metric
### Create a segmentation
In this part of the process, you will create a segmentation of customers with the highest scoring (30% of customers who made the highest number of transactions).
1. Go to **Decision Hub > Segmentation > New Segmentation**.
2. Enter the name of segmentation.
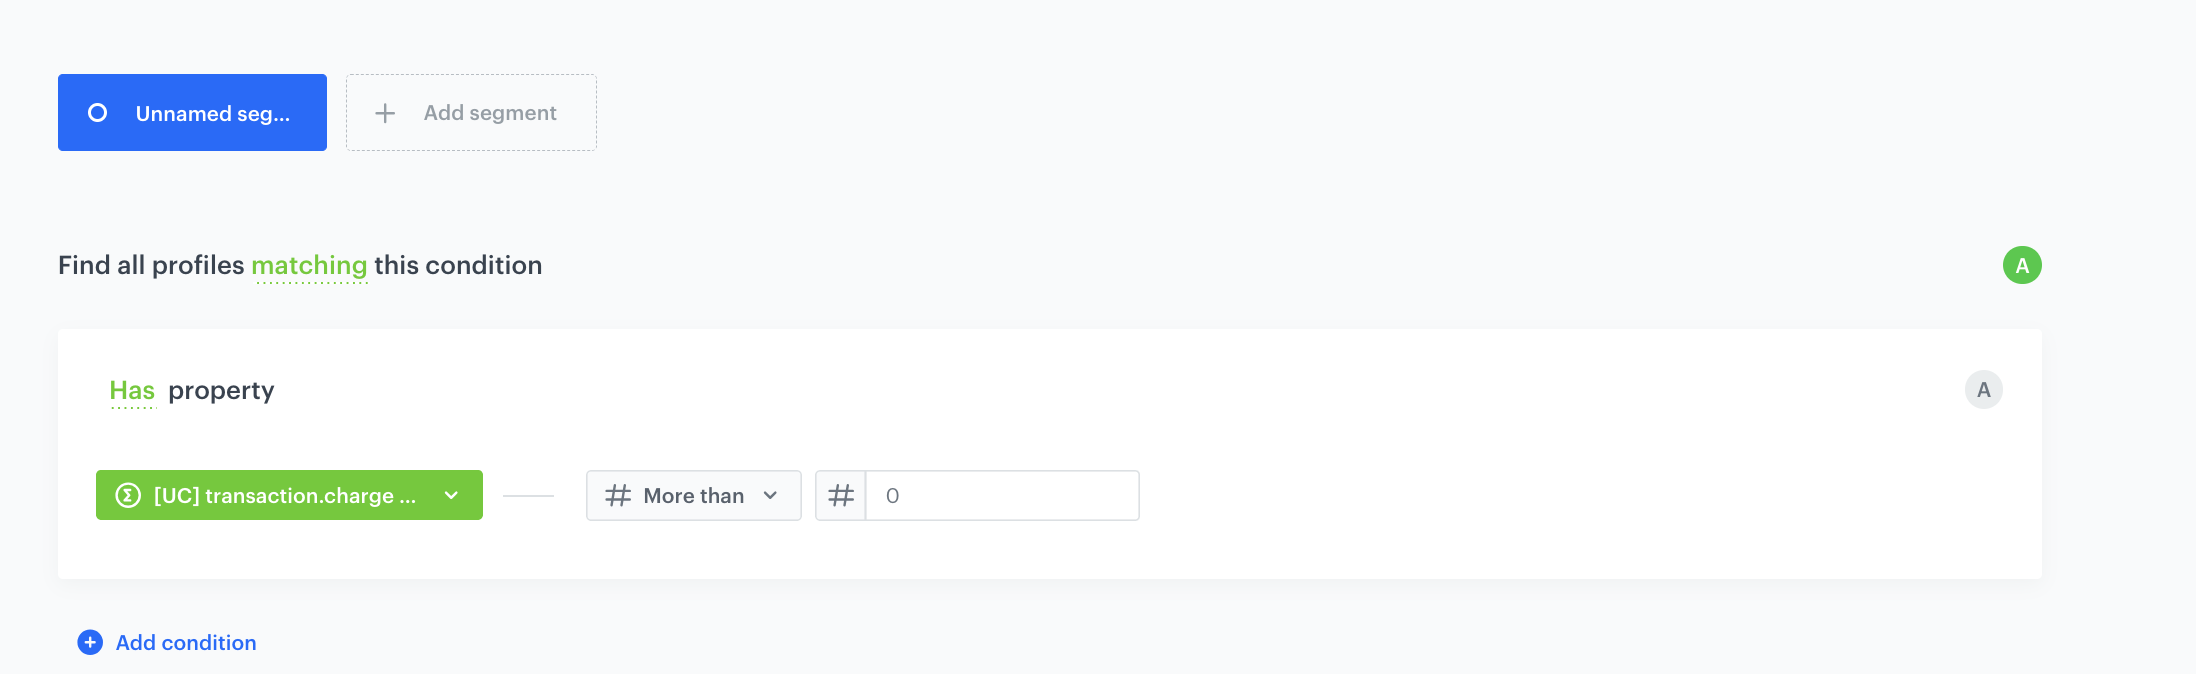
3. On the canvas, click **Add condition**.
4. From the dropdown list, select the [aggregate you created before](/use-cases/find-heavy-buyers#create-an-aggregate).
5. From the **Choose operator** dropdown list, select **More than**.
6. In the text field, enter the value returned from [the metric you created in the previous step](/use-cases/find-heavy-buyers#create-a-metric).
7. Click **Save**.
The final configuration of the metric
## Create a segmentation of heavy buyers whose buying behavior has changed over the past year
---
In this part of the process, you will create a segmentation that groups together all heavy buyers whose buying behavior has declined. Before you proceed to creating the segmentation, create an aggregate and metric which you will use in the segmentation.
### Create an aggregate
Create an aggregate that sums up the number of transactions from the current period.
1. Go to **Behavioral Data Hub > Live Aggregates > Create aggregate**.
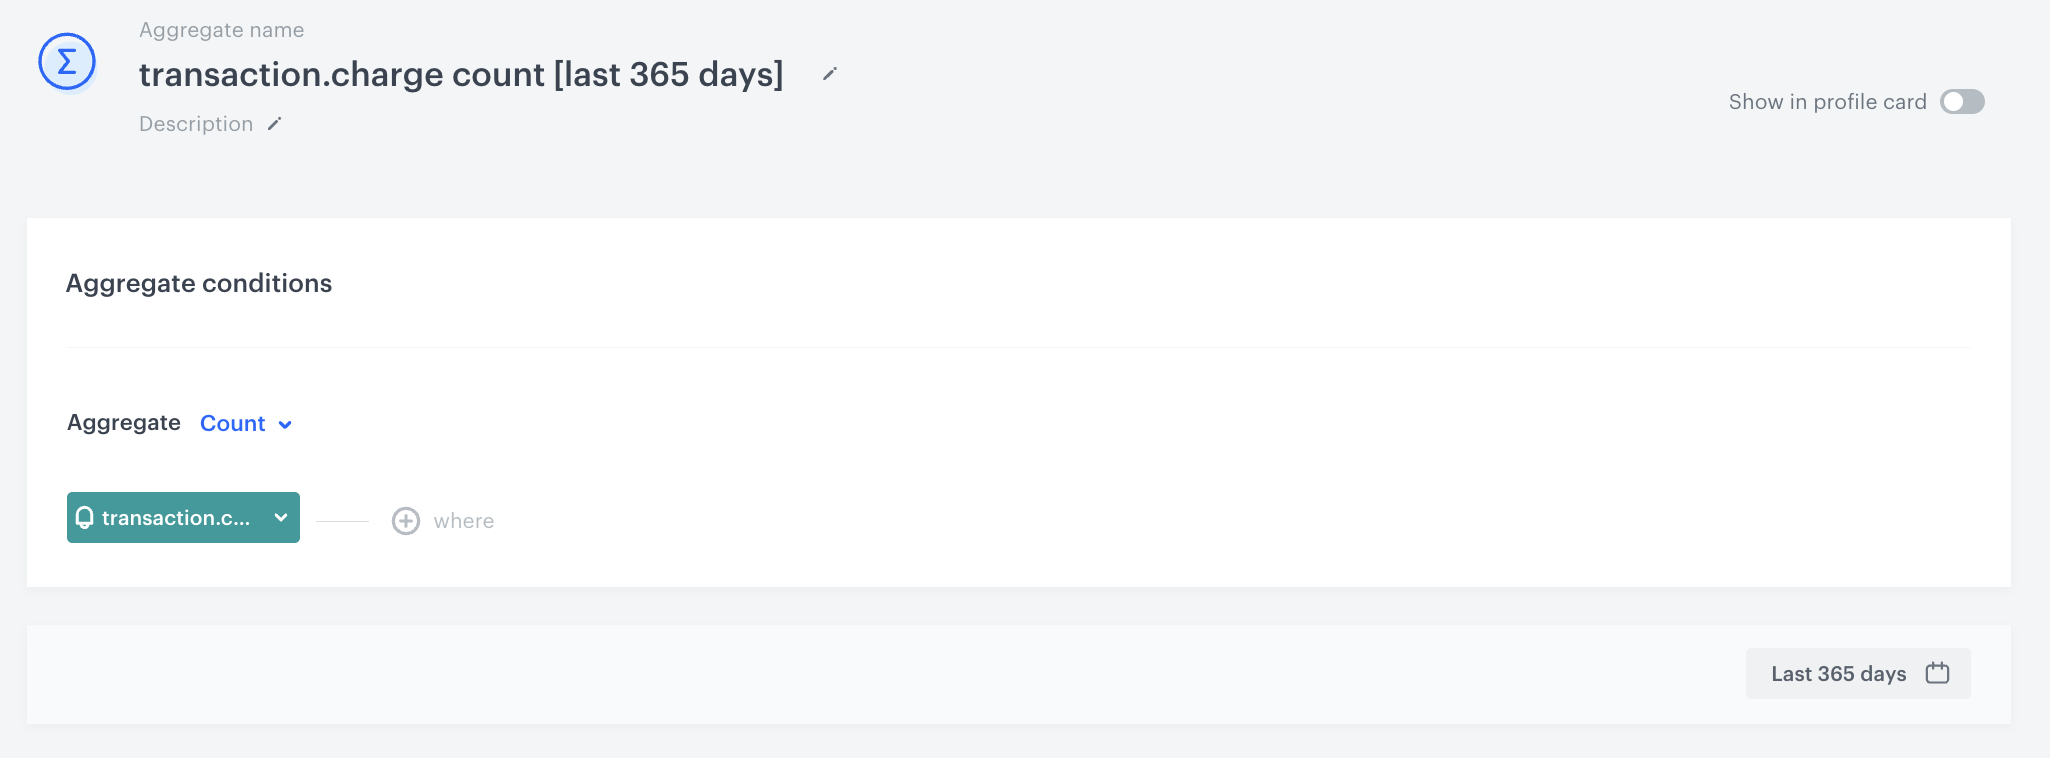
2. Enter the name of the aggregate.
3. By clicking the button, set **Count** as the type of the aggregate result (then the aggregate result shows the total number of transactions in the time range selected in the analysis).
4. From the **Choose event** dropdown list, select the **transaction.charge** event.
5. Change the date range, by clicking the calendar icon. Create the following custom date range `last 365 days before 0`.
6. Confirm the changes with the **Apply** button.
7. Save the aggregate by clicking **Save**.
Example settings of the aggregate
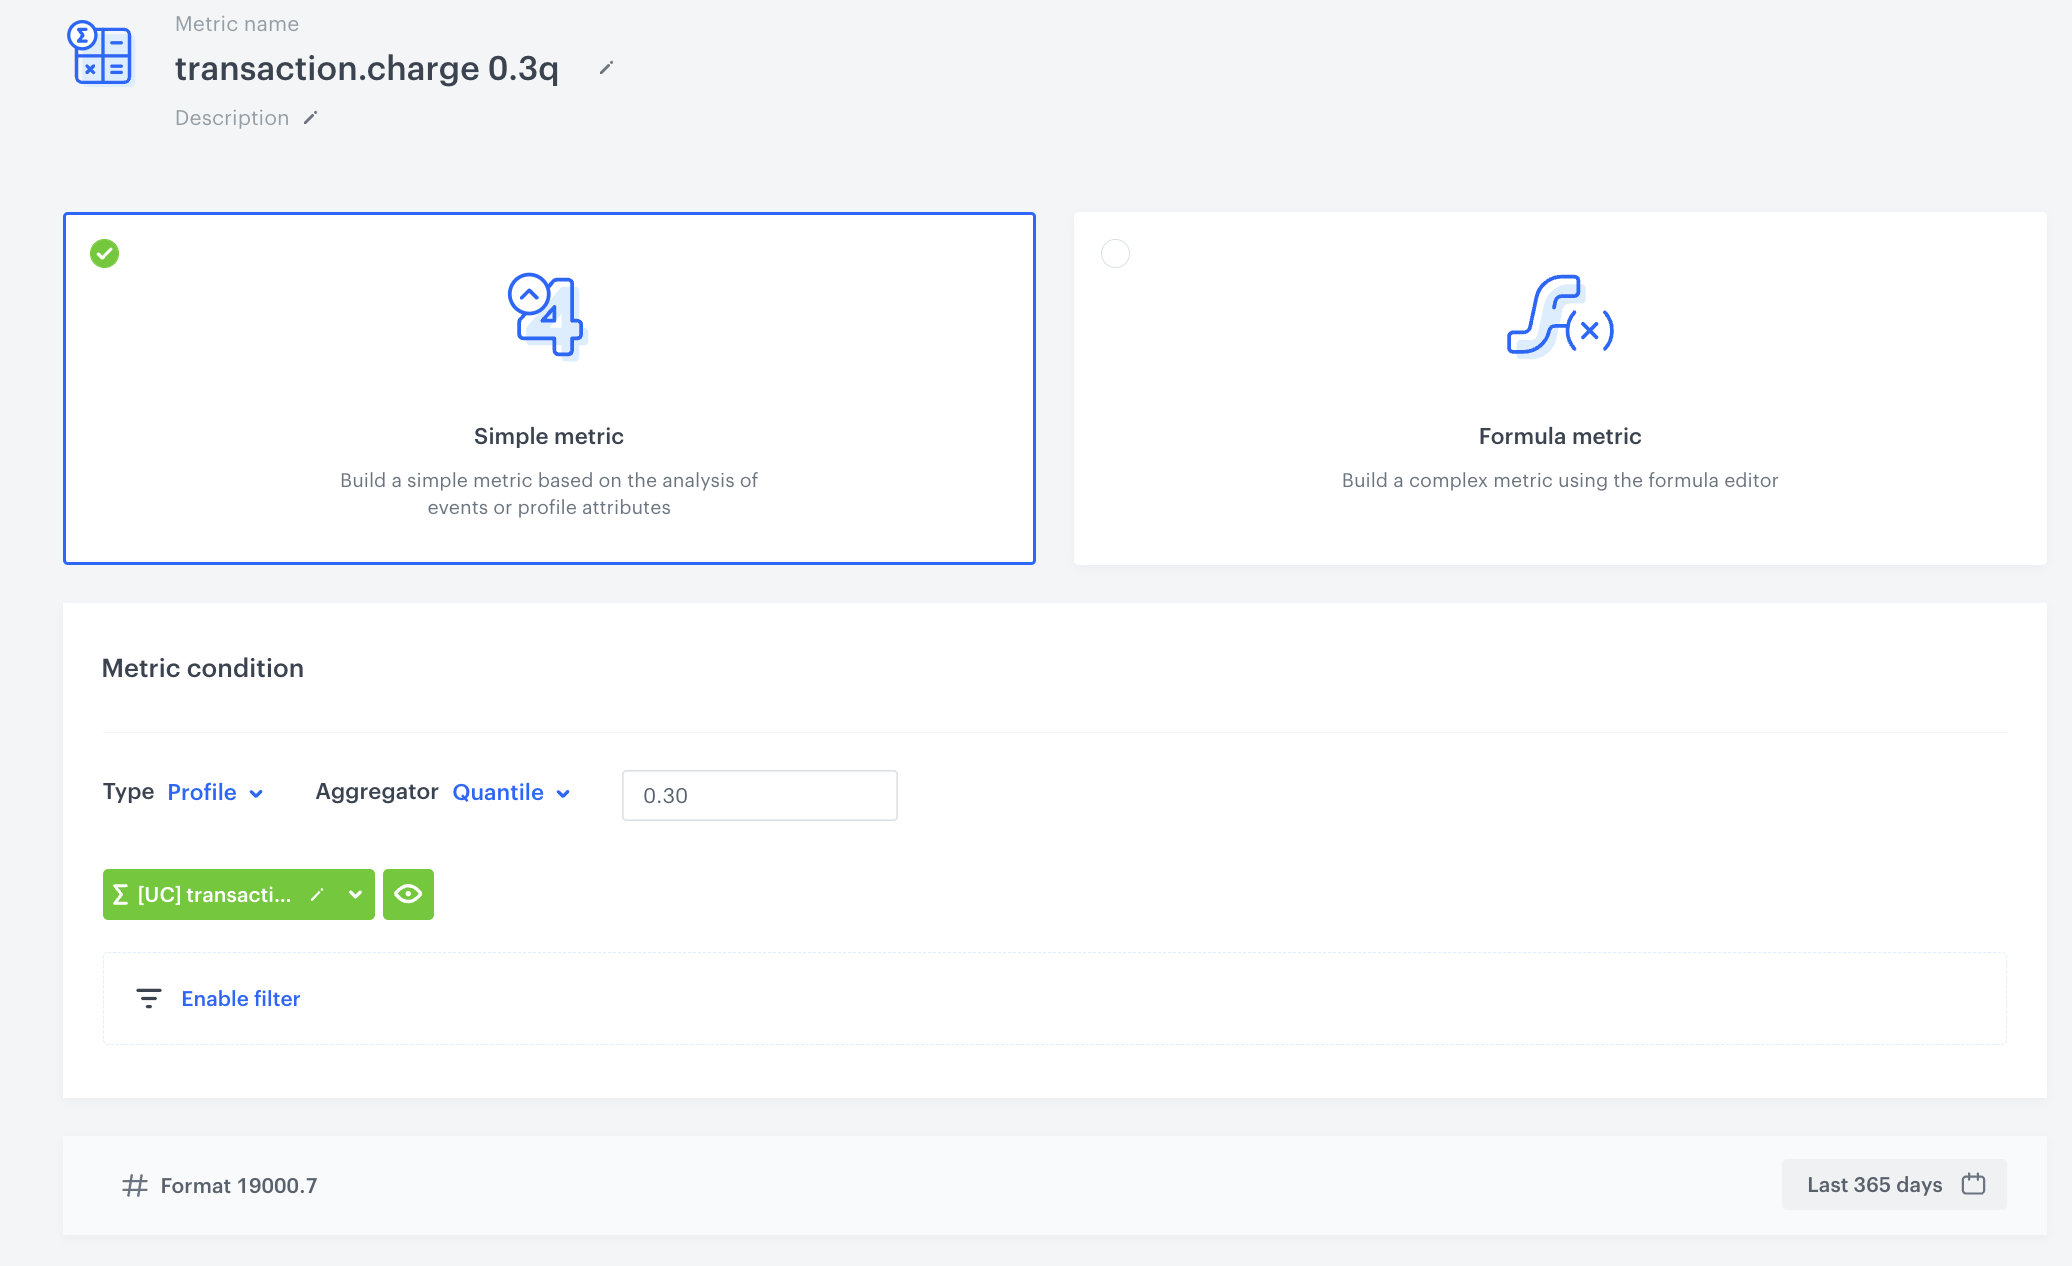
### Create a metric
Create a metric that sets a cutoff value for the customer segment with the lowest number of transactions.
1. Go to **Decision Hub > Metrics > New metric**.
2. Enter the name of the metric.
3. As a metric kind, select **Simple metric**.
4. As a metric type, select **Profile**.
5. As the aggregator, set **Quantile**.
6. In the input field which appears next to the aggregator, type `0.3`(to create a cutoff that defines the lowest number of values).
7. Click **Choose event**.
8. From the dropdown list, select the [aggregate you created before](/use-cases/find-heavy-buyers#create-an-aggregate-1).
9. Define the same time range as in the aggregate you use in the metric.
10. Click **Save**.
The final configuration of the metric
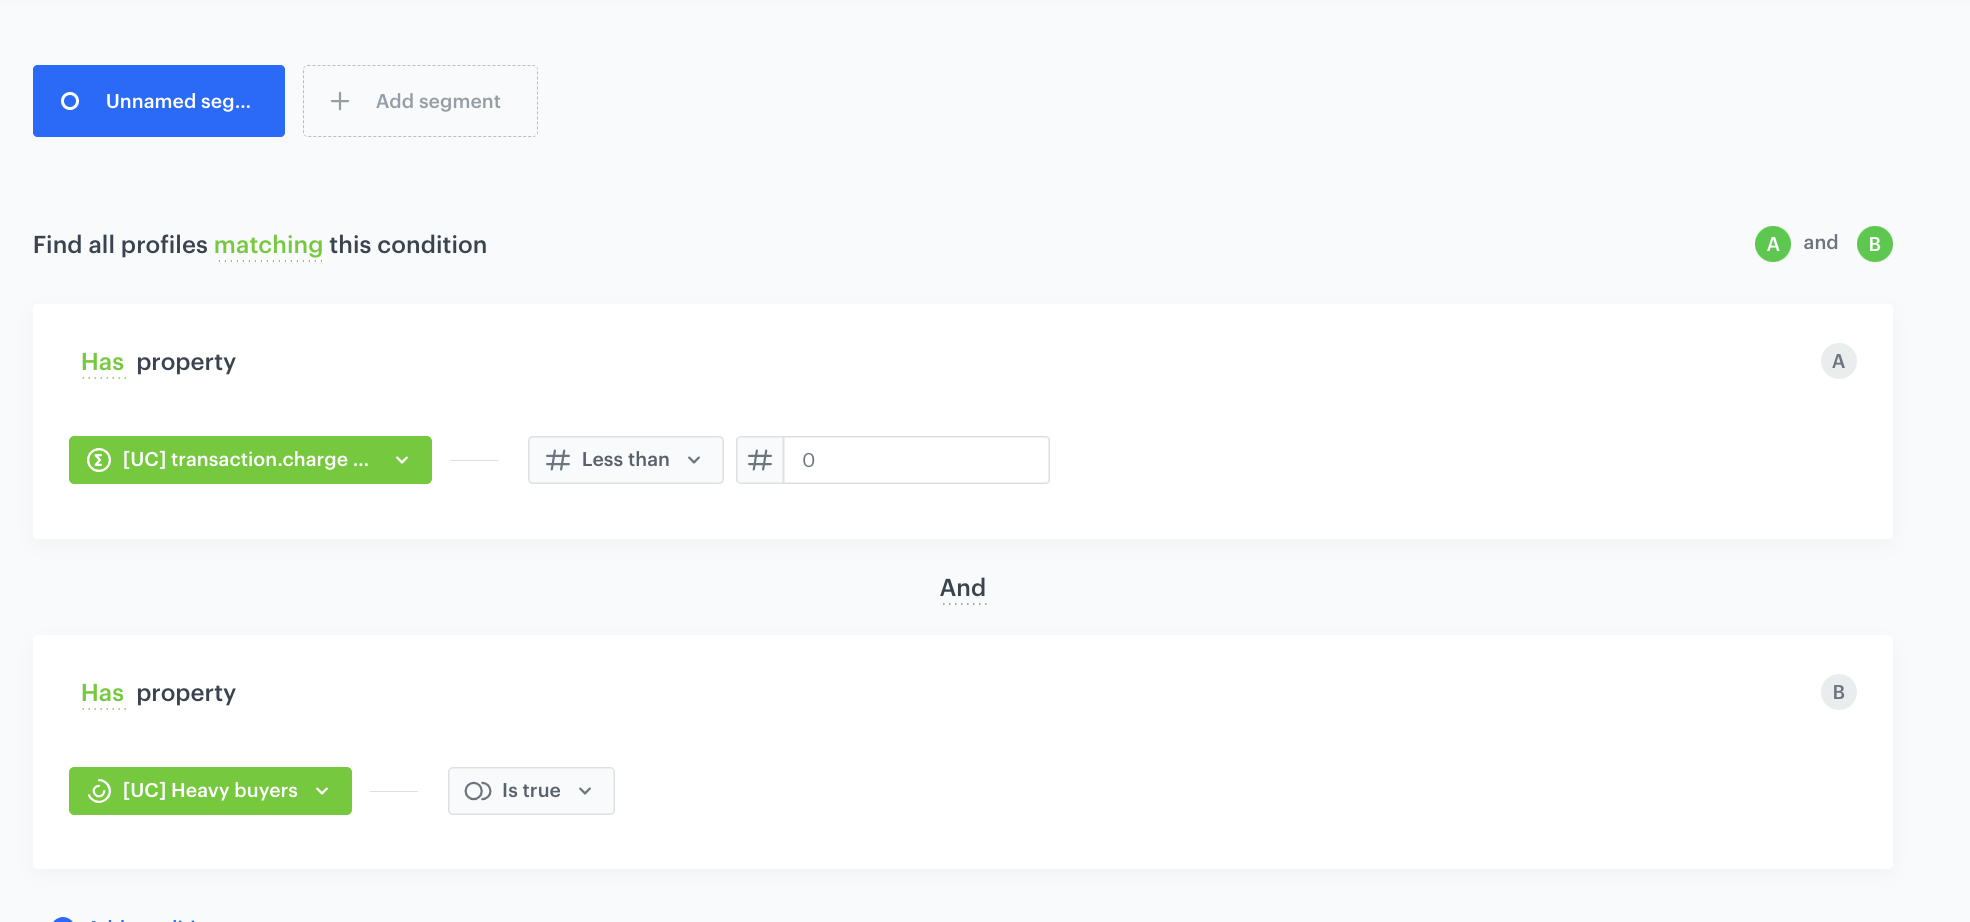
### Create segmentation
Create a segmentation of customers who have the lowest number of transactions from the current period and also belong to the segmentation of heavy buyers.
1. Go to **Decision Hub > Segmentation > New Segmentation**.
2. Enter the name of segmentation.
3. On the canvas, click **Add condition**.
4. From the dropdown list, select the [aggregate you created before](/use-cases/find-heavy-buyers#create-an-aggregate-1).
5. From the **Choose operator** dropdown list, select **Less than**.
6. In the text field, enter the value returned from the [metric that sets a cutoff value for the customer segmentation with the lowest number of transactions](/use-cases/find-heavy-buyers#create-a-metric-1).
7. From the **Add condition** dropdown list, select a [segmentation of heavy buyers](/use-cases/find-heavy-buyers#create-segmentation).
8. From the **Choose operator** dropdown list, select Boolean **Is true**.
9. Click **Save**.
The final configuration of the metric
## What's next
---
Send [an email](/docs/campaign/e-mail/introduction-to-email-campaigns) with personalized offers to the [segmentation](/use-cases/find-heavy-buyers#create-segmentation) you have created with heavy buyers who should be reactivated.
## Check the use case set up on the Synerise demo workspace
---
You can check the segmentation configuration directly in Synerise demo workspace:
- [Segment of heavy buyers](https://app.synerise.com/analytics/segmentations/f22d73d7-5aba-48e7-b70f-54bbc1dba0a2)
- [Segment of heavy buyers whose buying behavior has changed over the past year](https://app.synerise.com/analytics/segmentations/043ea1b9-798e-4945-8b3c-d56be94f65ea)
If you’re our partner or client, you already have automatic access to the **Synerise Demo workspace (1590)**, where you can explore all the configured elements of this use case and copy them to your workspace.
If you’re not a partner or client yet, we encourage you to fill out the contact [form](https://demo.synerise.com/request) to schedule a meeting with our representatives. They’ll be happy to show you how our demo works and discuss how you can apply this use case in your business.
## Read more
---
- [Email templates](/docs/campaign/e-mail/creating-email-templates)
- [Recommendations](/docs/ai-hub/recommendations-v2/recommendation-types)
- [Segmentations](/docs/analytics/segmentations)
- [Aggregates](/docs/analytics/aggregates)
- [Metrics](/docs/analytics/metrics)