
While creating a purchase analysis of specific products, we often want to group them according to specific rules, for example, by their category. However, the product category is not always added to the parameters of the transaction event. In this case, you can use Decision Hub, which creates the necessary parameter on the fly without changing the integration.

In this use case, you'll learn how to create category parameters on the fly using Synerise Decision Hub and how to create a report that shows how many purchases were made for products in the defined categories.  

## Prerequisites 
---
- Implement transaction events using [SDK](/developers/web/transactions-sdk) or [API](https://developers.synerise.com/DataManagement/DataManagement.html#operation/CreateATransaction).
- Prepare a list of product SKUs that you would like to group into specific product categories. 

## Process
---
- [Create an expression](/use-cases/group_products_by_category#group-sold-products-by-their-category-with-sku) that groups sold products into categories based on their SKU.
- [Create a metric](/use-cases/group_products_by_category#create-a-metric) that returns the number of products purchased within the defined category. 
- [Create a report](/use-cases/group_products_by_category#create-a-report) that shows the metric result broken down into defined groups (product categories).

## Group sold products by their category with SKU 
---


<div class="admonition admonition-note"><div class="admonition-icon"><svg xmlns="http://www.w3.org/2000/svg" fill="none" viewBox="0 0 24 24" stroke="currentColor" stroke-width="2.5"><path stroke-linecap="round" stroke-linejoin="round" d="M13 16h-1v-4h-1m1-4h.01M21 12a9 9 0 11-18 0 9 9 0 0118 0z" /></svg></div><div class="admonition-body"><div class="admonition-content">

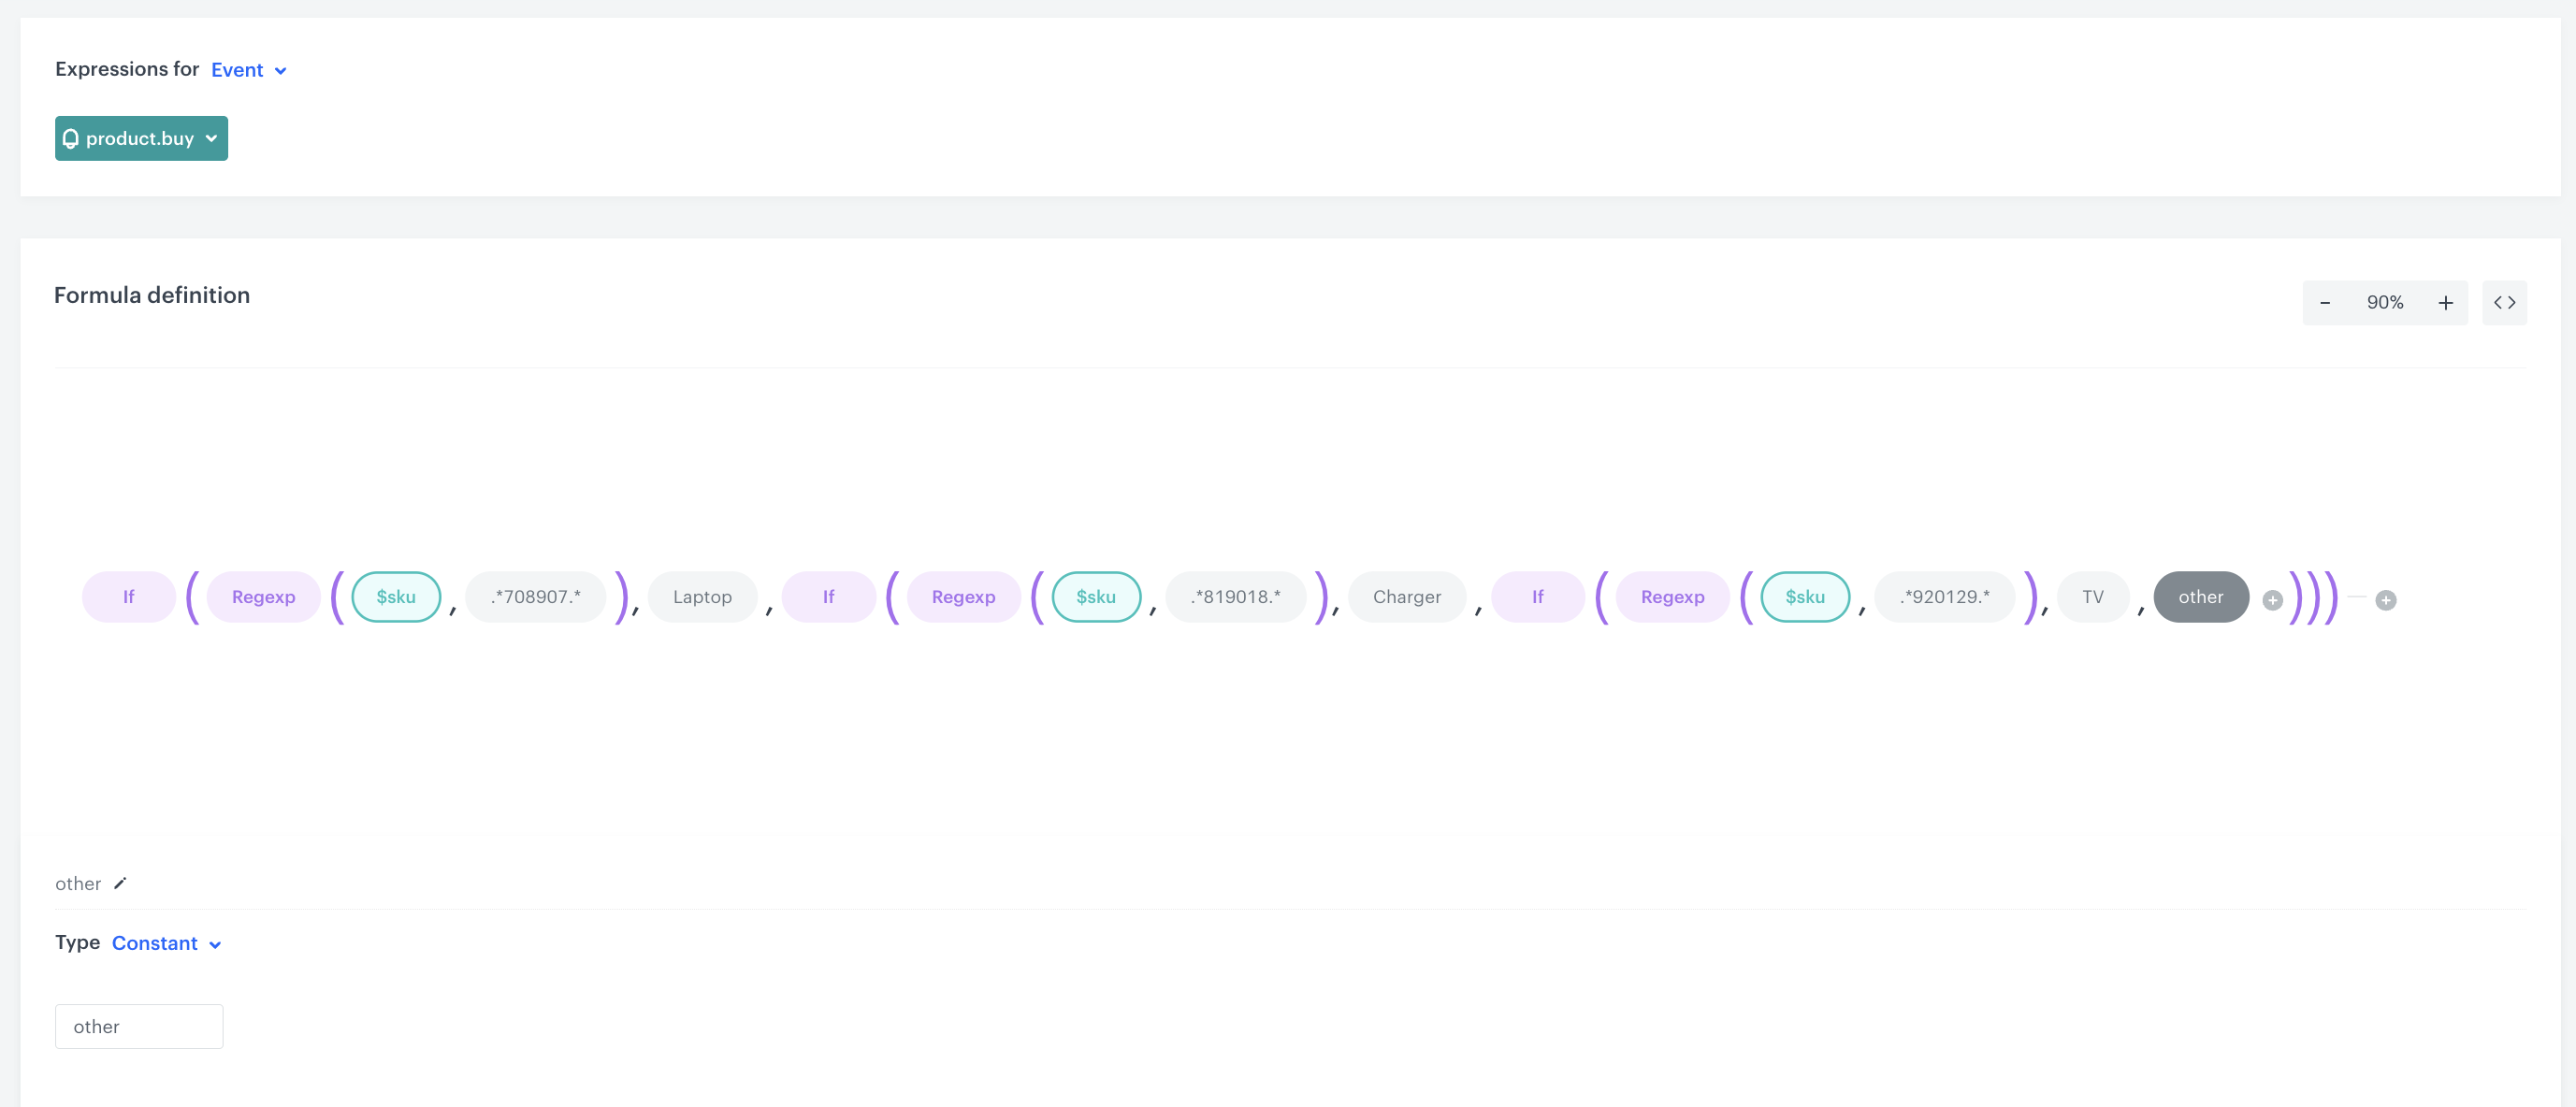
In our case, event expression is be based on the products SKU. Hovewer, it is only the example of the configuration of the expression. Depending on your business needs and parameters used in the product events, you can create any conditions that can be based for example on fragment from the product name, url, and any other conditions.

</div></div></div>


In this part of the process, you will create an event expression for the **product.buy** event. The formula of this expression will assign a product with a given SKU to a specific product category. 


<div class="admonition admonition-tip"><div class="admonition-icon"><svg xmlns="http://www.w3.org/2000/svg" fill="none" viewBox="0 0 24 24" stroke="currentColor" stroke-width="2.5"><path stroke-linecap="round" stroke-linejoin="round" d="M9.663 17h4.673M12 3v1m6.364 1.636l-.707.707M21 12h-1M4 12H3m3.343-5.657l-.707-.707m2.828 9.9a5 5 0 117.072 0l-.548.547A3.374 3.374 0 0014 18.469V19a2 2 0 11-4 0v-.531c0-.895-.356-1.754-.988-2.386l-.548-.547z" /></svg></div><div class="admonition-body"><div class="admonition-content">

Groups of these SKUs have a repeating string in the middle (for example, one SKU has ZZ**XXXX**YY and another has AA**XXXX**BB)

</div></div></div>


If the SKU is included in the group corresponding to the regular expression conditions (constant with the value “.*XXXX.*”), then the expression assigns it to the product group (for example, constant with the value `Laptop`). The next groups of products will be added in the same way. If the product doesn't meet the expression conditions, it will be assigned to the `other` category.

1. Go to <<img src="/api/docs/image/54176ad07f146575310749eba44b7c2f42c1b327/icons/behavioral-data-hub-icon.svg" alt="Behavioral Data Hub icon" class="icon"> **Behavioral Data Hub > Expression > New expression**. 
2. Enter the name of the expression. 
3. Set the Expression for option to **Event**. 
4. From the dropdown list, select **product.buy**.
5. Build the expression as shown in the screenshot below:

<figure>
<img src="/api/docs/image/54176ad07f146575310749eba44b7c2f42c1b327/use-cases/all-cases/_gfx/group_products_expression.png" class="full" alt="Expression configuration">
<figcaption>Expression configuration</figcaption>
</figure>

## Create a metric
---

Create a metric to receive the number of purchased products of the groups defined in the previous step.

1. Go to <img src="/api/docs/image/54176ad07f146575310749eba44b7c2f42c1b327/icons/decision-hub-icon.svg" alt="Behavioral Data Hub icon" class="icon"> **Decision Hub > Metrics > New mertic**. 
2. Enter the name of the metric.
3. As a metric kind, select **Simple metric**. 
4. As the aggregator, set **Count**. 
5. As the occurrence type, set **All**. 
6. From the Choose event dropdown list, select **product.buy** event. 
7. Click **Where** button.  
    Result: The Choose parameter button appears. 
8. Click the **Choose parameter** button.   
    Result: A pop-up appears. 
9. On the pop-up, click the **three-dot** button   
    Result: A dropdown shows. 
10. From the dropdown, select **Expressions**. 
11. In the list of expressions, find the event expression you have created [earlier](/use-cases/group_products_by_category#group-sold-products-by-their-category-with-sku). 
12. Click the **Choose parameter** button. 
13. From the dropdown, select **Not equal**. 
14. In the text field, enter `other`.
15. To select a specific time range, click the **calendar** icon.     
16. Confirm your choice with the **Apply** button. 
17. Save metrics.

<figure>
<img src="/api/docs/image/54176ad07f146575310749eba44b7c2f42c1b327/use-cases/all-cases/_gfx/metrics_names_of_categ.png" class="large" alt="Metrics configuration">
<figcaption>Metrics configuration</figcaption>
</figure>

## Create a report 
---
In this part of the process, create a report based on the metric and expression you prepared before. The result of the report is a table with the number of purchased products in each category over a specified time period. 

1. Go to <img src="/api/docs/image/54176ad07f146575310749eba44b7c2f42c1b327/icons/decision-hub-icon.svg" alt="Behavioral Data Hub icon" class="icon"> **Decision Hub > Reports > New report**. 
2. Enter the name of the report. 
3. Select metric you created in [this part](/use-cases/group_products_by_category#create-a-metric) of the process. 
4. From the **Range** dropdown list, select the number of top (the most frequently bought group of products) to be shown in the preview of the report.

    
   <div class="admonition admonition-tip"><div class="admonition-icon"><svg xmlns="http://www.w3.org/2000/svg" fill="none" viewBox="0 0 24 24" stroke="currentColor" stroke-width="2.5"><path stroke-linecap="round" stroke-linejoin="round" d="M9.663 17h4.673M12 3v1m6.364 1.636l-.707.707M21 12h-1M4 12H3m3.343-5.657l-.707-.707m2.828 9.9a5 5 0 117.072 0l-.548.547A3.374 3.374 0 0014 18.469V19a2 2 0 11-4 0v-.531c0-.895-.356-1.754-.988-2.386l-.548-.547z" /></svg></div><div class="admonition-body"><div class="admonition-content">

   The selected number of product groups in the range must be greater than the number of product groups defined in the expression - for the report to pull them all in.

   </div></div></div>


5. In the Dimension section, select the expression created in [this step](/use-cases/group_products_by_category#group-sold-products-by-their-category-with-sku). 
6. In the date range, select the time that will be analyzed.  
7. Save the report.
8. Click **Preview** to see the results. 

<figure>
<img src="/api/docs/image/54176ad07f146575310749eba44b7c2f42c1b327/use-cases/all-cases/_gfx/report_category.png" class="large" alt="Report configuration">
<figcaption>Report configuration</figcaption>
</figure>

Preview the results of the report: 

<figure>
<img src="/api/docs/image/54176ad07f146575310749eba44b7c2f42c1b327/use-cases/all-cases/_gfx/report_preview.png" class="large" alt="Report preview">
<figcaption>Report preview</figcaption>
</figure>

The sold products presented in the report are grouped according to predefined categories. You can use this data to compare whether sales of a particular product group have increased during the period of interest. If there has been a noticeable increase in product group sales, there is likely to be a fraud.

In this case, you can implement an alert system using email alert/sms alert nodes or outgoing integration. You can take inspiration from the following [use case](/use-cases/slack-integration), which describes the process of creating a workflow that sends alert messages based on the results of metrics to a Slack channel.

## Check the use case set up on the Synerise Demo workspace
---
You can check the configuration of each step from this use case in our Synerise Demo workspace:
- [Expression](https://app.synerise.com/analytics/expressions/b6b60b91-9333-42db-9a87-9343a87d87fd)
- [Metric](https://app.synerise.com/analytics/metrics/9399b940-b639-4bba-a83f-2d320827cf6e)
- [Report](https://app.synerise.com/analytics/reports/9d2f7346-368d-4099-8e9f-dd749641a374)

If you’re our partner or client, you already have automatic access to the **Synerise Demo workspace (1590)**, where you can explore all the configured elements of this use case and copy them to your workspace.  

If you’re not a partner or client yet, we encourage you to fill out the contact [form](https://demo.synerise.com/request) to schedule a meeting with our representatives. They’ll be happy to show you how our demo works and discuss how you can apply this use case in your business. 

## Read more
---

- [Expressions](/docs/analytics/expressions)
- [Metrics](/docs/analytics/metrics)
- [Reports](/docs/analytics/reports)
