Thanks to the parameters in the URL, we can track the behavior of customers after interacting with a given campaign. In this use case, we will show an example of analyses related to AI recommendations, but in general, the same principles can be applied to create an analysis for any campaign where these parameters in the URL are placed.
It helps us check the effectiveness of recommendations and monitor the purchases (exact number of products bought after clicking and their total value). This use case describes the process of creating aggregates, metrics and other analyses that count purchases based on the URL parameter with the ID of the AI recommendation.
## Prerequisites
---
- A [tracking code](/developers/web/installation-and-configuration#creating-a-tracking-code) implemented in the source of your website.
- Send information about transactions through [API](https://developers.synerise.com/DataManagement/DataManagement.html#operation/CreateATransaction) or [SDK](/developers/web/transactions-sdk).
- Implement [OG Tags](/developers/web/og-tags) on your website.
- Implement [AI recommendation](/docs/ai-hub/recommendations-v2) on your website or, in case you want to analyze different type of campaign, add unique parameters to the URL after clicking it, which will allow you to analyze the campaign results.
## Process
---
This use case contains the following steps which must be performed in the given order:
1. [Getting the list of clicked products](/use-cases/items-bought-after-clicking#getting-the-list-of-clicked-products).
2. [Getting the timestamp of the first visit to the product page](/use-cases/items-bought-after-clicking#getting-the-timestamp-of-the-first-visit).
3. [Getting the list of the order IDs after clicking the recommendation](/use-cases/items-bought-after-clicking#getting-the-list-of-the-order-ids-after-clicking-the-recommendation).
4. [Multiply the product price by the product quantity](/use-cases/items-bought-after-clicking#multiply-the-product-price-by-the-product-quantity).
5. [Create metrics that calculate](/use-cases/items-bought-after-clicking#create-metrics):
- The number of products bought after clickng the recommendation
- The value of products bought after clicking the recommendation
- The number of transactions with the products bought after clicking the recommendation
- The value of transactions with the products bought after clicking the recommendation
## Getting the list of clicked products
---
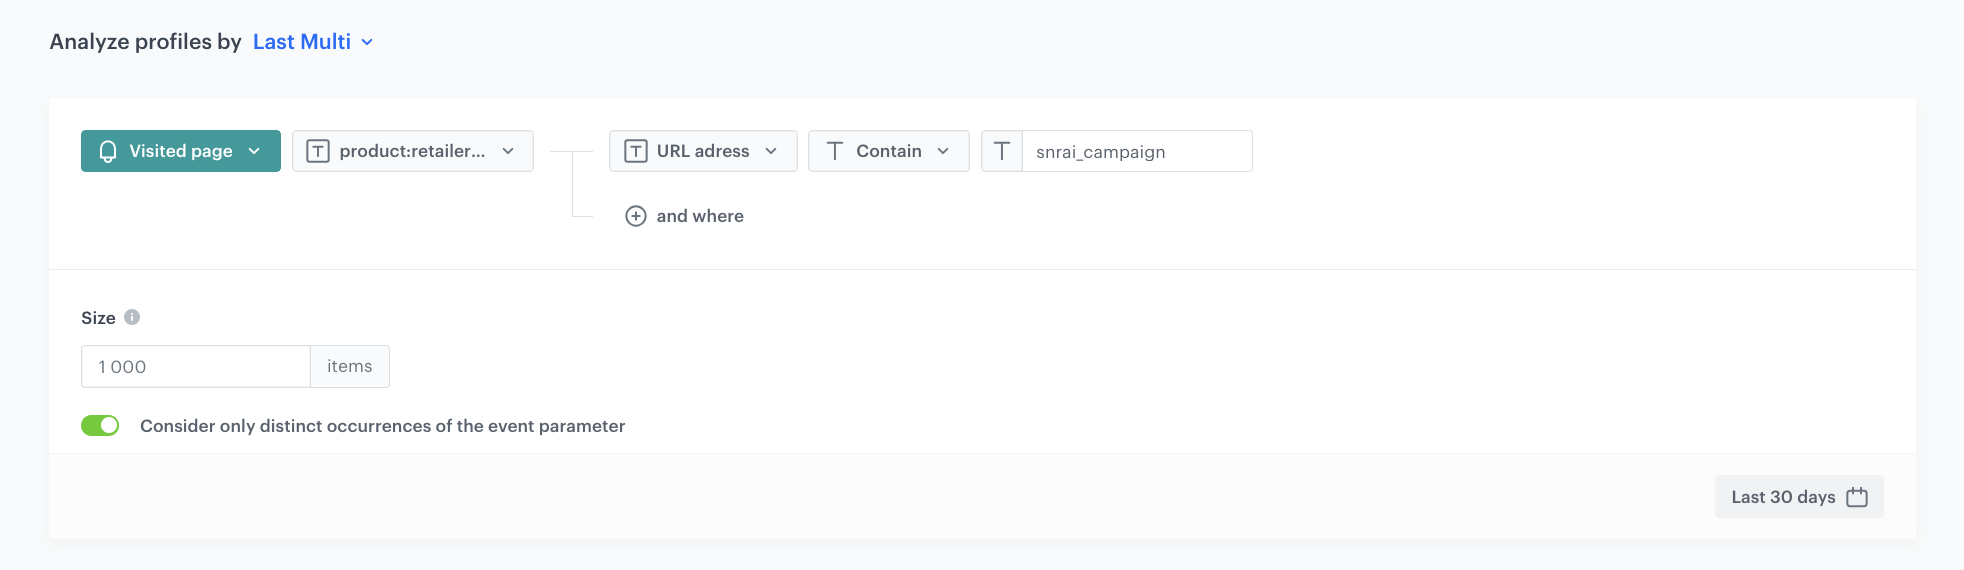
Create an aggregate that returns the SKUs of the clicked items (from a particular recommendation campaign). You will use these SKUs later to check if they occured in the transactions that occurred after clicking at a certain time.
In this use case, we analyze clicking a product from a given AI recommendation based on the `page.visit` event and `uri` parameter (URL of the website). This parameter contains `?snrai_campaign=XXX` part, where `XXX` is the ID of AI recommendation that was clicked. The `?snrai_campaign` parameter it is added to the URL automatically when implementing AI recommendation.
The analysis is also based on the ID of the clicked product which is stored in the `retailer_part_no` parameter. However, sometimes clicking a product does not transfer directly to the product page, so it is not possible to add parameters to the URL, especially in the case of "Add to cart" buttons placed directly in the product frame. In such case instead of relying on the `page.visit` event, you should implement a [custom event](/developers/web/event-tracking#declarative-tracking-custom-events). Such an event must contain the AI recommendation ID and the product ID that was clicked in its parameters. Then you will be able to rely your analyses on this custom event.
1. Go to **Behavioral Data Hub > Live Aggregates > Create aggregate**.
2. As the aggregate type, select **Profile**.
2. Click **Analyze profiles by** and select **Last Multi**.
3. Select **Consider only distinct occurrences of the event parameter**.
3. In the **Size** field, enter the number of returned SKUs.
4. Select the **page.visit** event.
5. Select the **product:retailer_part_no** parameter.
6. Select the **url** parameter.
7. Select the **Contain** logical operator.
8. In the text field, enter the ID of the recommendation campaign.
You can find it in the URL of the product from the recommendation: ID of recommendation campaign in URL
9. Save the aggregate.
Last visited recommendation aggregate
## Getting the timestamp of the first visit
---
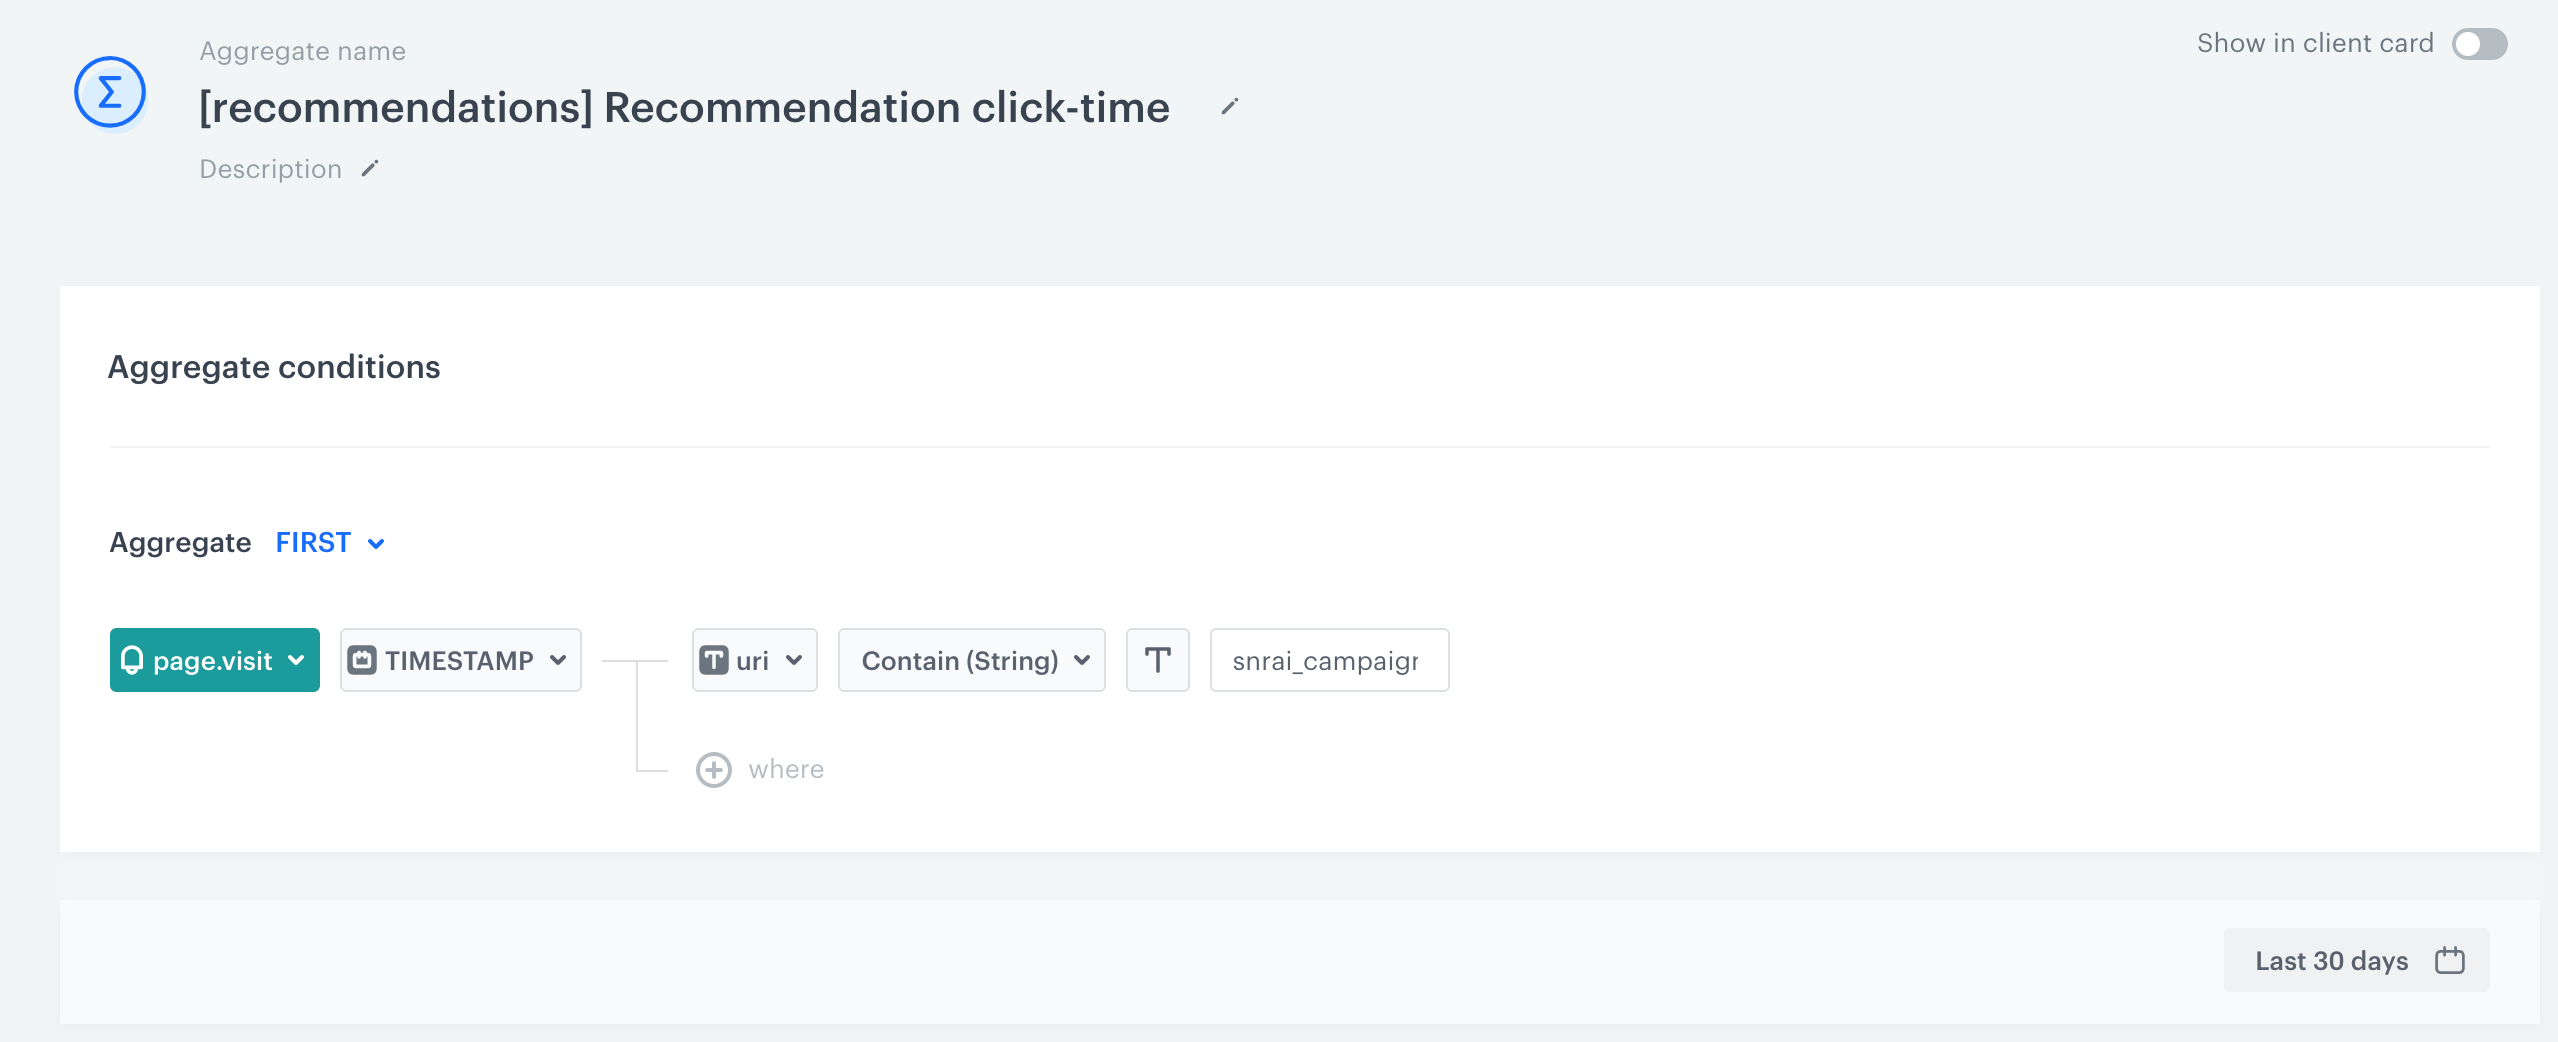
You must get the time of the first click at the product from recommendation campaign. To do so, we use the `TIMESTAMP` parameter and the ID of the recommendation campaign which is visible in the clicked link. Timestamp allows you to define the period from which transactions should be taken into account, and also those transactions which occurred after clicking the campaign.
1. Go to **Behavioral Data Hub > Live Aggregates > Create aggregate**.
2. As the aggregate type, select **Profile**.
2. Click **Analyze profiles by** and select **First**.
4. Select the **page.visit** event.
5. Select the **TIMESTAMP** parameter.
6. Select the **url address** parameter.
7. Select the **Contain** logical operator.
8. In the text field, enter the ID of the recommendation campaign.
9. Save the aggregate.
Time of the first visit to the product of the recommendation campaign
## Getting the list of the order IDs after clicking the recommendation
---
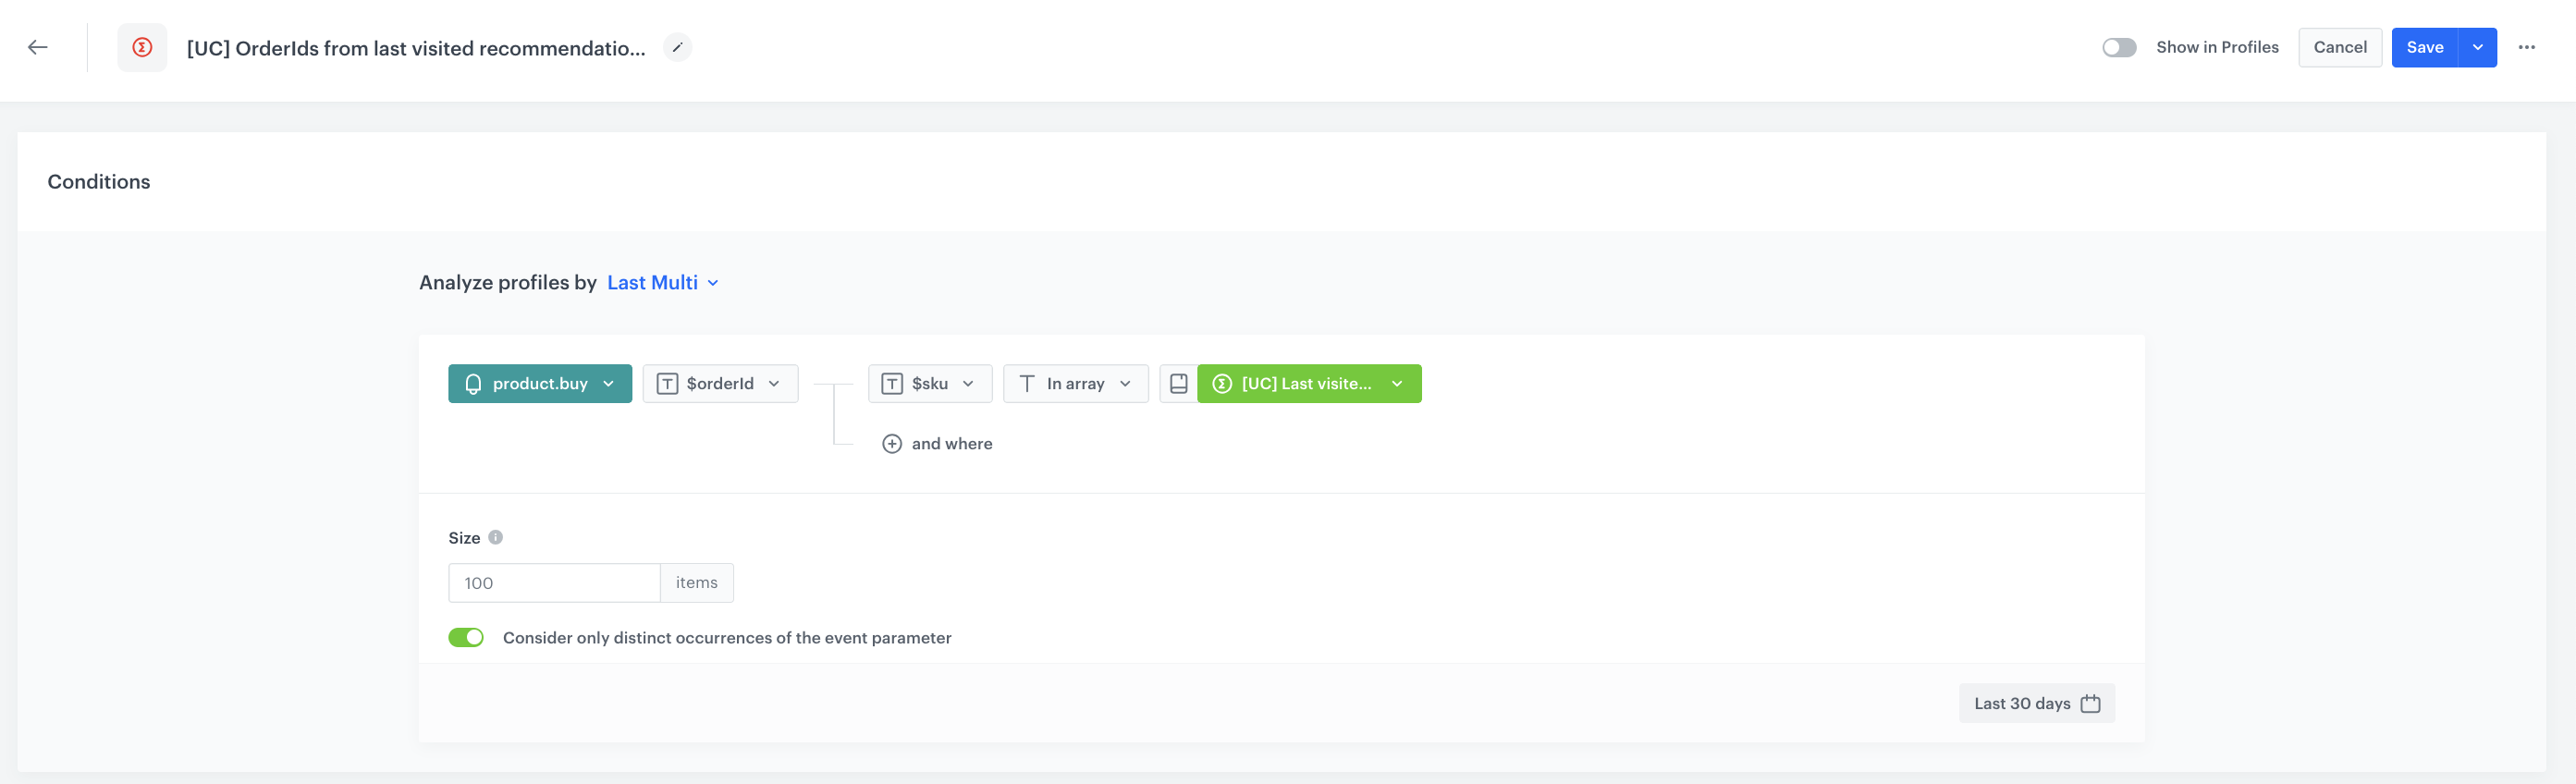
Create an aggregate that returns the order IDs of the products included in the [first aggregate you prepared](/use-cases/items-bought-after-clicking#getting-the-list-of-clicked-products). It allows you to identify the transactions that included the products clicked from the specific campaign and those transactions which took place just after the click.
1. Go to **Behavioral Data Hub > Live Aggregates > Create aggregate**.
2. As the aggregate type, select **Profile**.
2. Click **Analyze profiles by** and select **Last Multi**.
3. Select **Consider only distinct occurrences of the event parameter**.
4. Select the **product.buy** event.
5. Select the **$orderID** parameter.
6. Select the **$sku** parameter.
7. Select the **IN ARRAY** logical operator.
8. Select the aggregate you created in the [Getting the list of visited products](/use-cases/items-bought-after-clicking#getting-the-list-of-clicked-products) step.
9. Save the aggregate.
The list of products clicked in the recommendation
## Multiply the product price by the product quantity
---
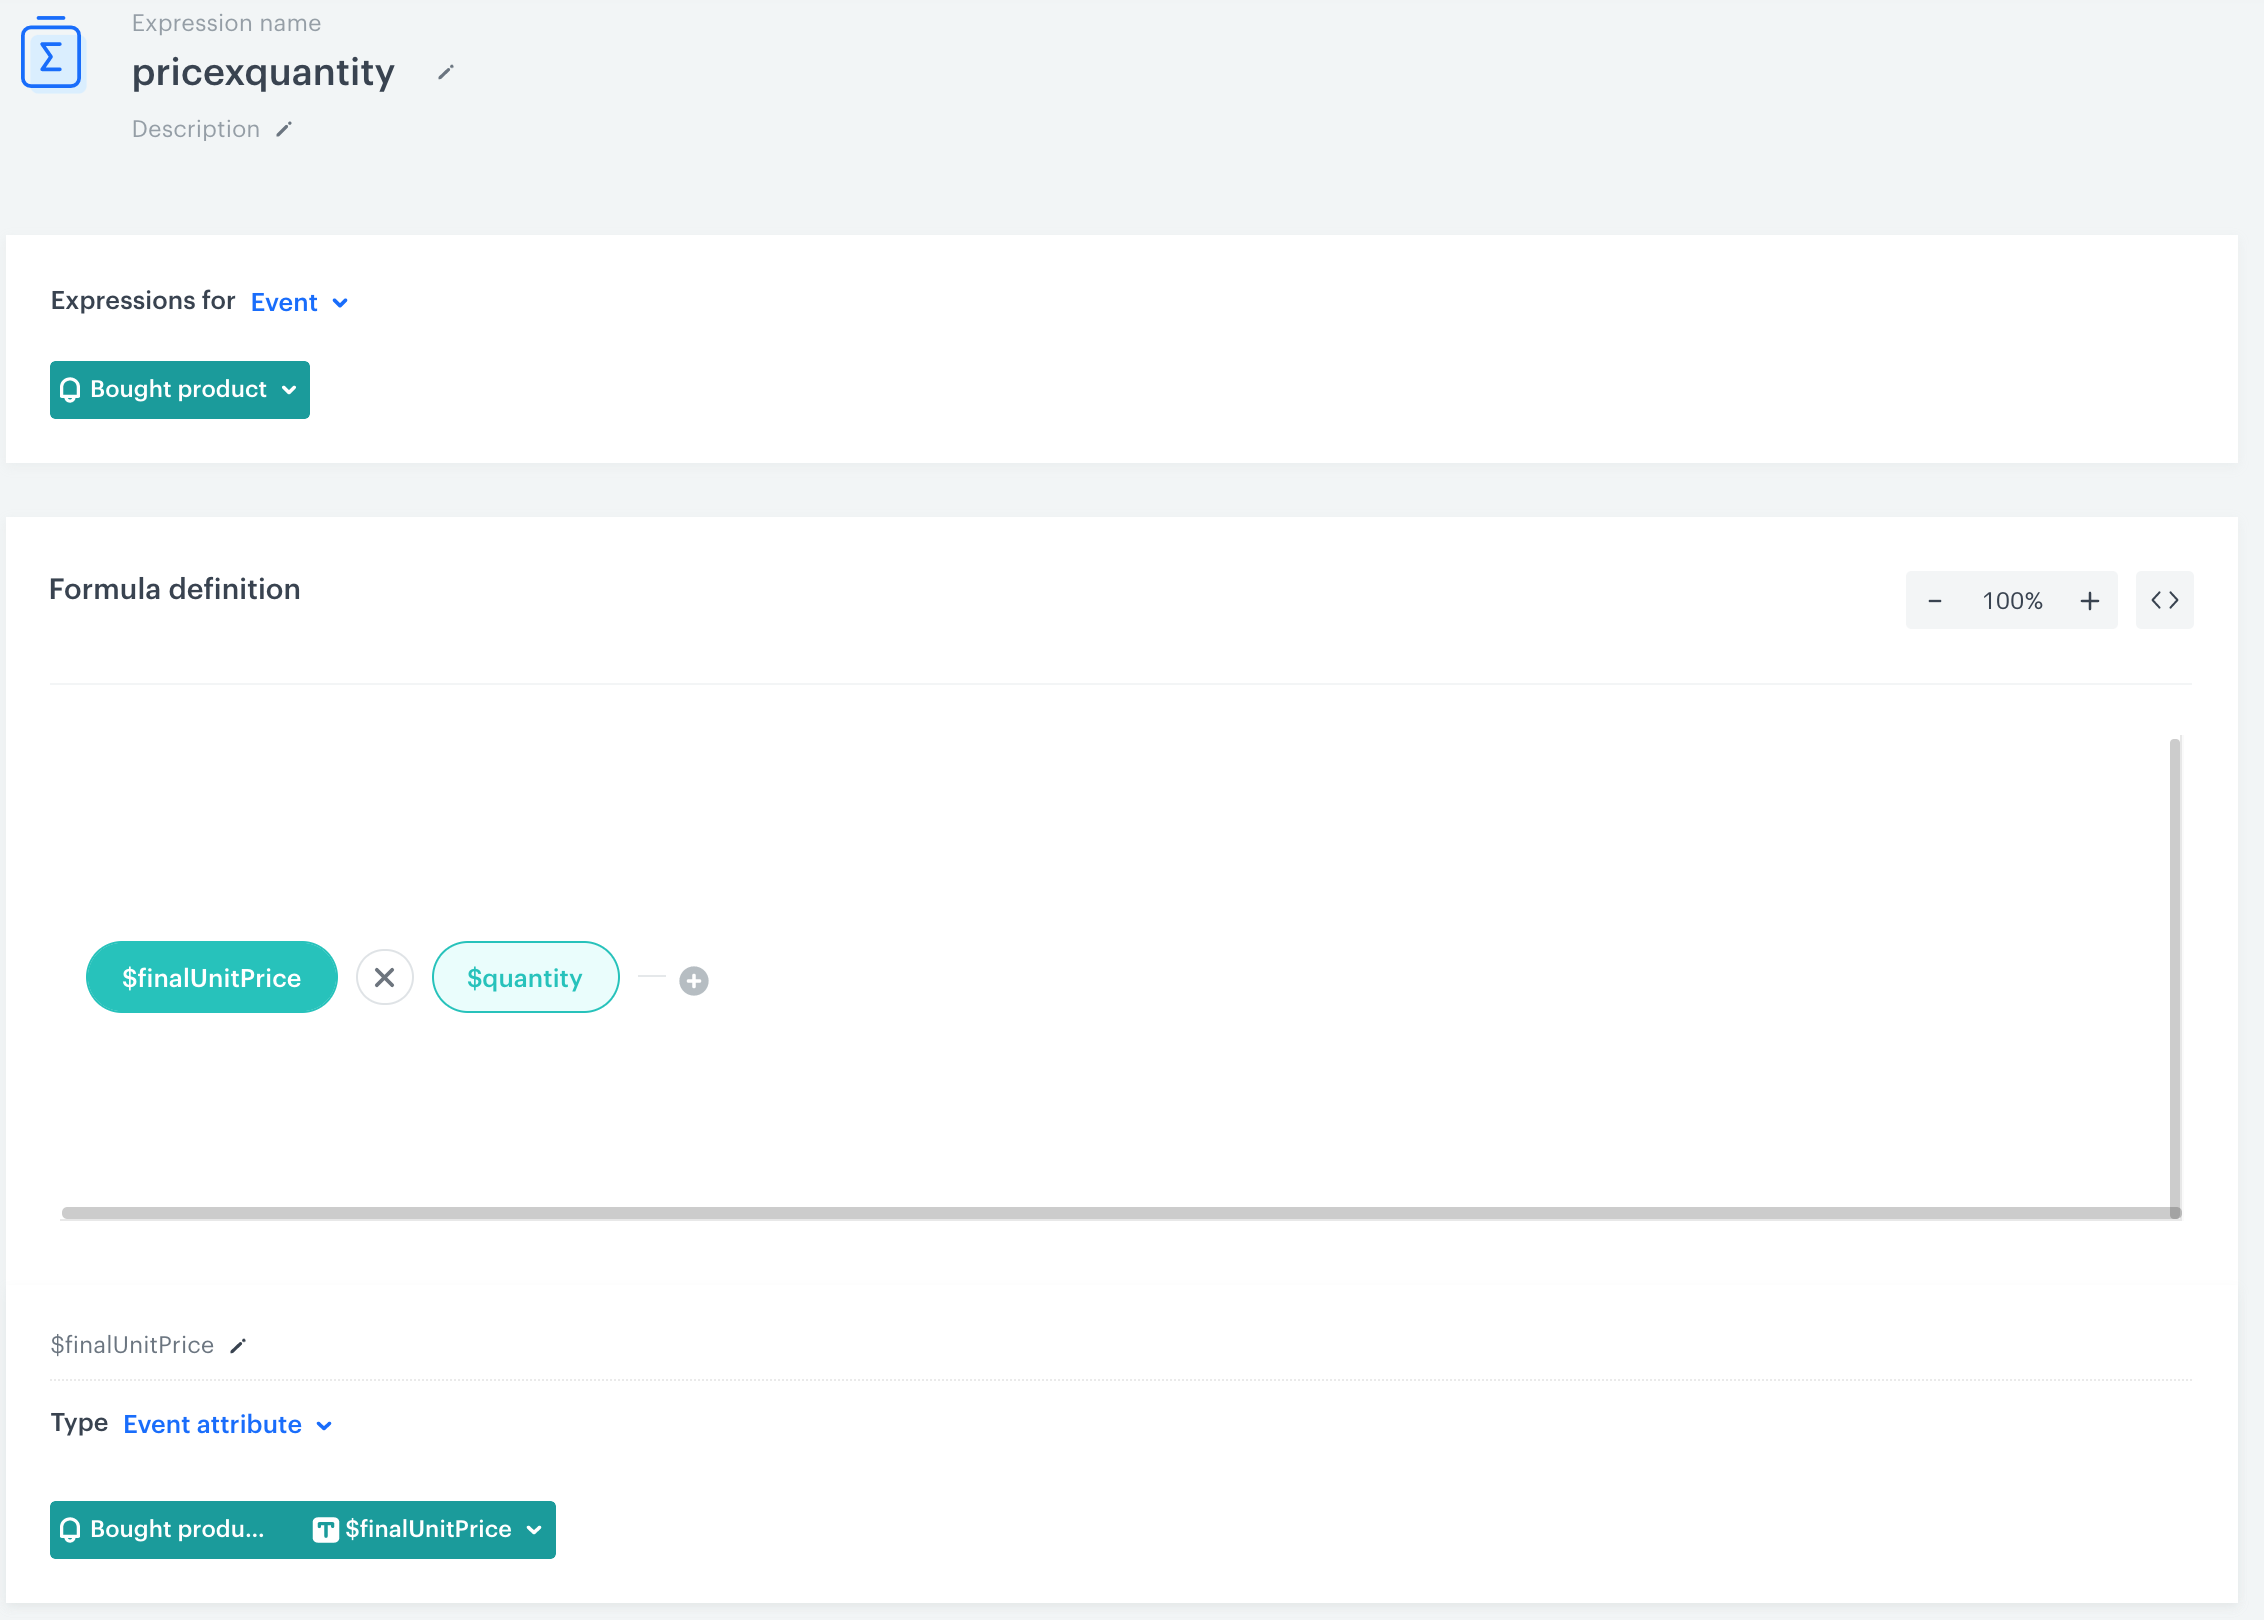
Create [an event expression](/docs/analytics/expressions/creating-event-expression) that multiplies the final price of the product and its quantity. At the same time you enrich the parameters of the `product.buy` event.
1. Go to **Behavioral Data Hub > Expressions > New expressions**.
2. From the **Expression for** list, select **Events**.
3. Select the **product.buy** event.
4. On the dashboard, click the **Select** button and select **Event attribute**.
5. On the list, find **$finalUnitprice** or other parameter that signifies the actual transaction value.
6. Click the plus button and select **Event attribute**.
7. On the list, find **$quantity** or other parameter that signifies the quantity of the product.
8. Change the mathematical sign between the attributes from the plus sign to times sign (`x`).
9. Save the expression.
Configuration of the expression
## Create metrics
---
Prepare metrics based on the three aggregates you created in previous steps. Including the aggregates in metrics lets you calculate:
- the number of products purchased after clicking in the campaign,
- the total value of products purchased after clicking in the campaign,
- the number of transactions that include the products bought after clicking the campaign,
- the total value of transactions that include the products bought after clicking the campaign.
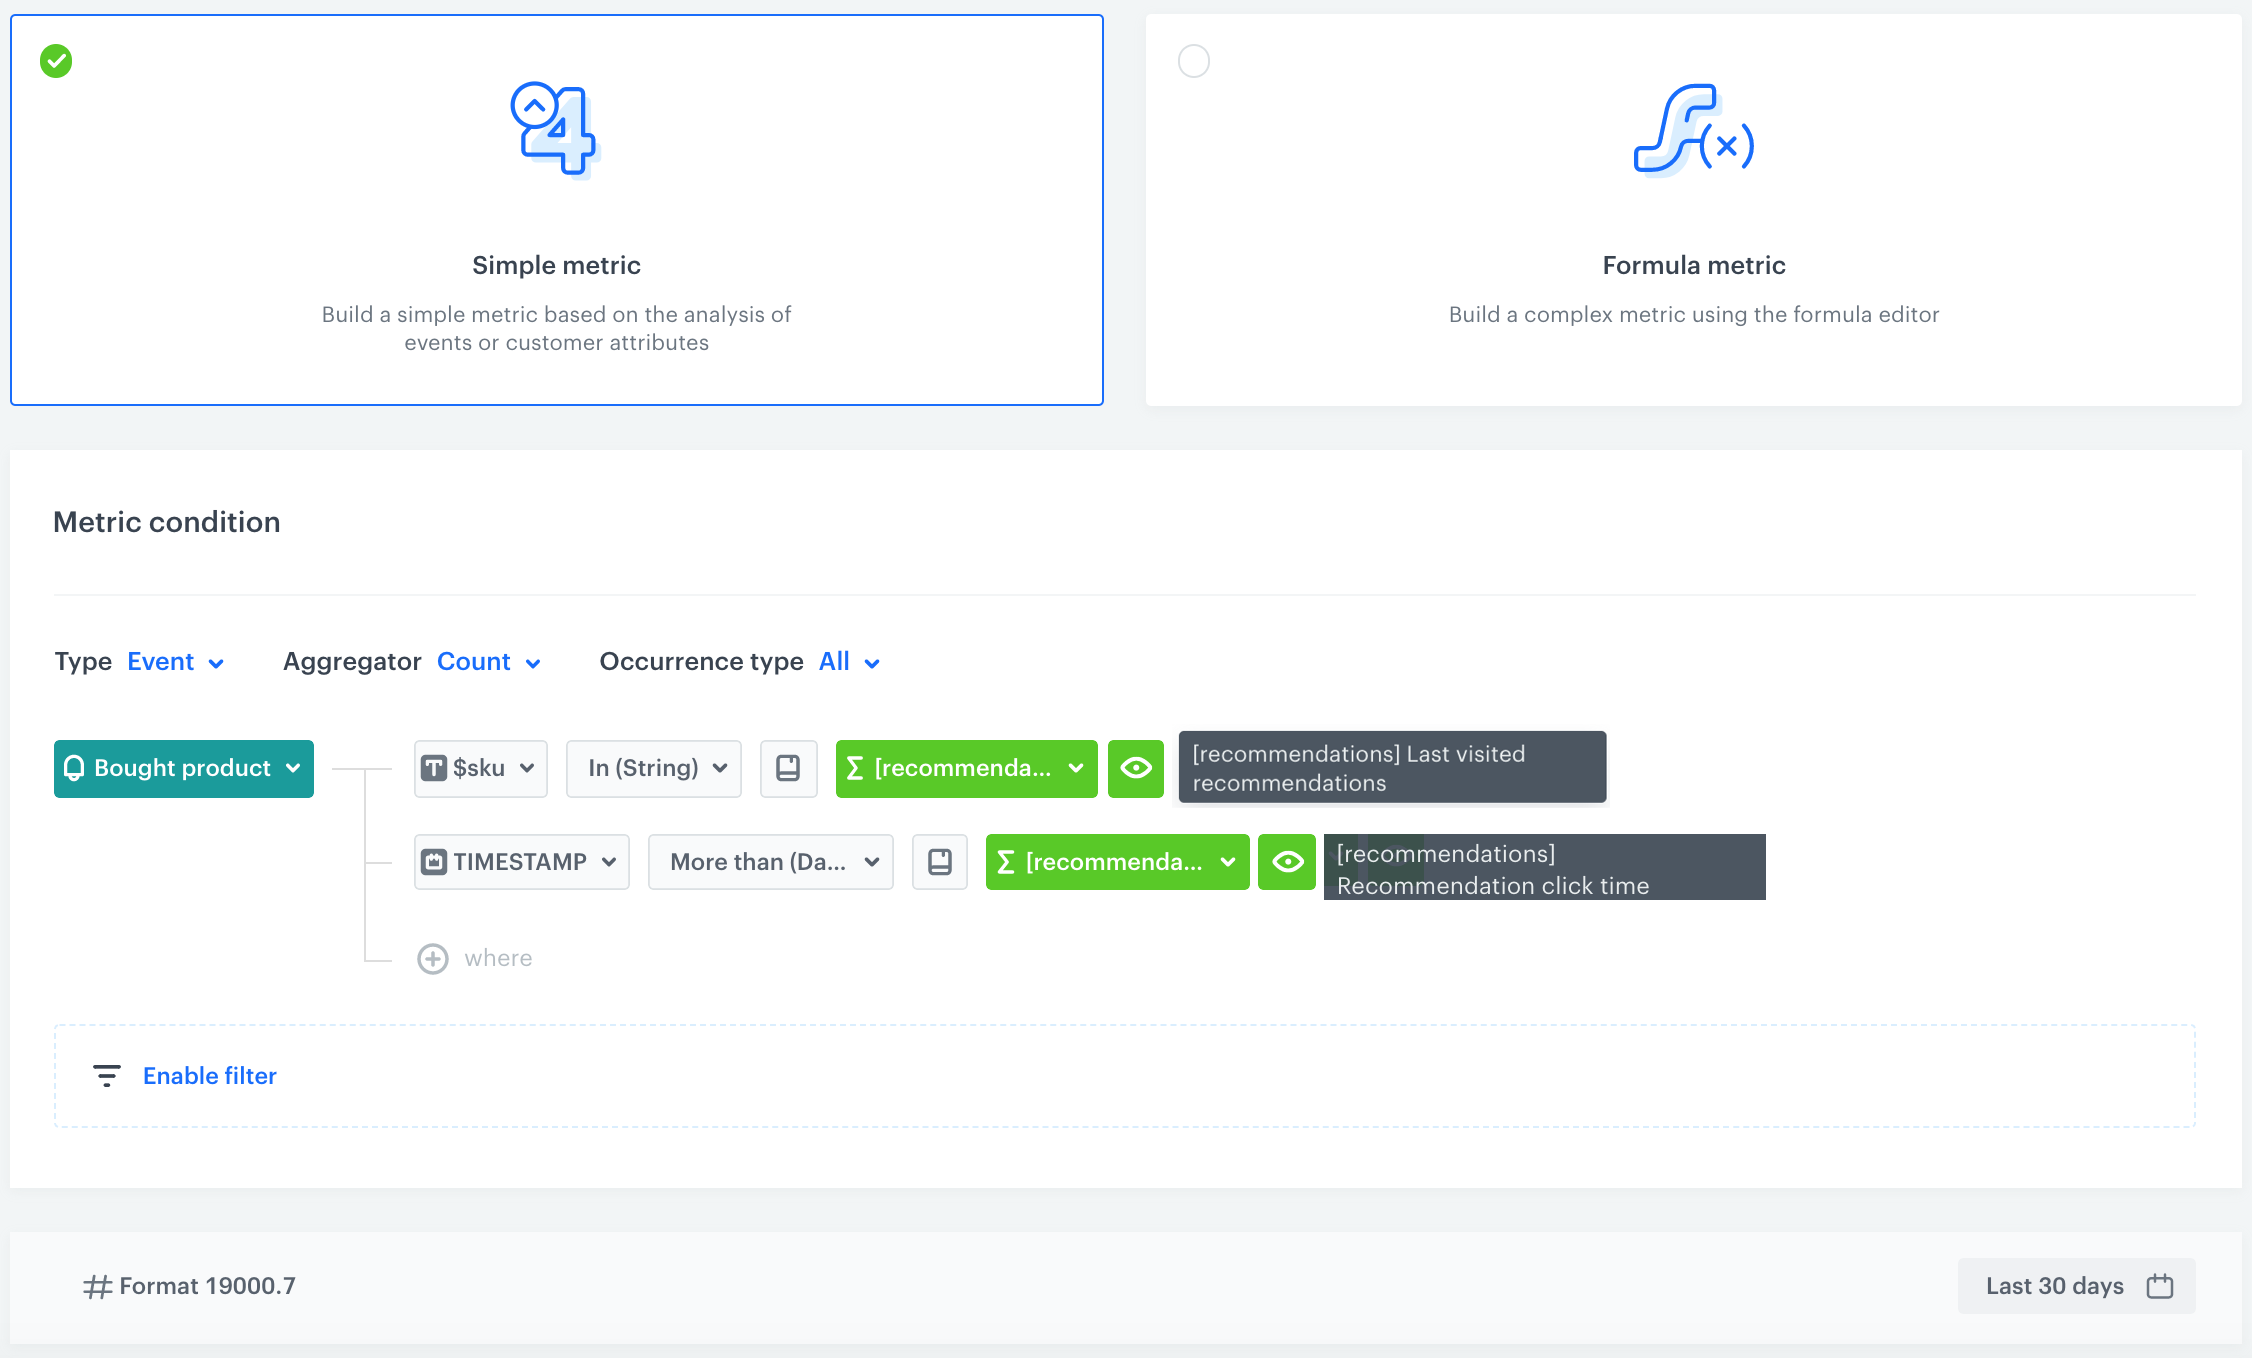
Click to see the metric for the number of products bought after clicking the campaign
In this metric, you check the number of products by using in the metric formula the aggregate that returns the SKU of the products viewed within a campaign.
Additionally, narrow down the results by using the timestamp parameter. Set the time stamp to include the purchases after the first click at the product in the campaign. For that purpose, use the aggregate that calculates the timestamp of the first product visit.
Go to Decision Hub > Metrics > New metric.
Enter the name of the metric.
Leave the Aggregator at default (Count).
Select the product.buy event.
Add the following parameters:
Add the $sku parameter.
Select the In operator.
Keep clicking the icon next to the logical operator until you get .
Select the date range of the metric (for example, last 30 days).
Save the metric by clicking Save.
Configuration of the metric
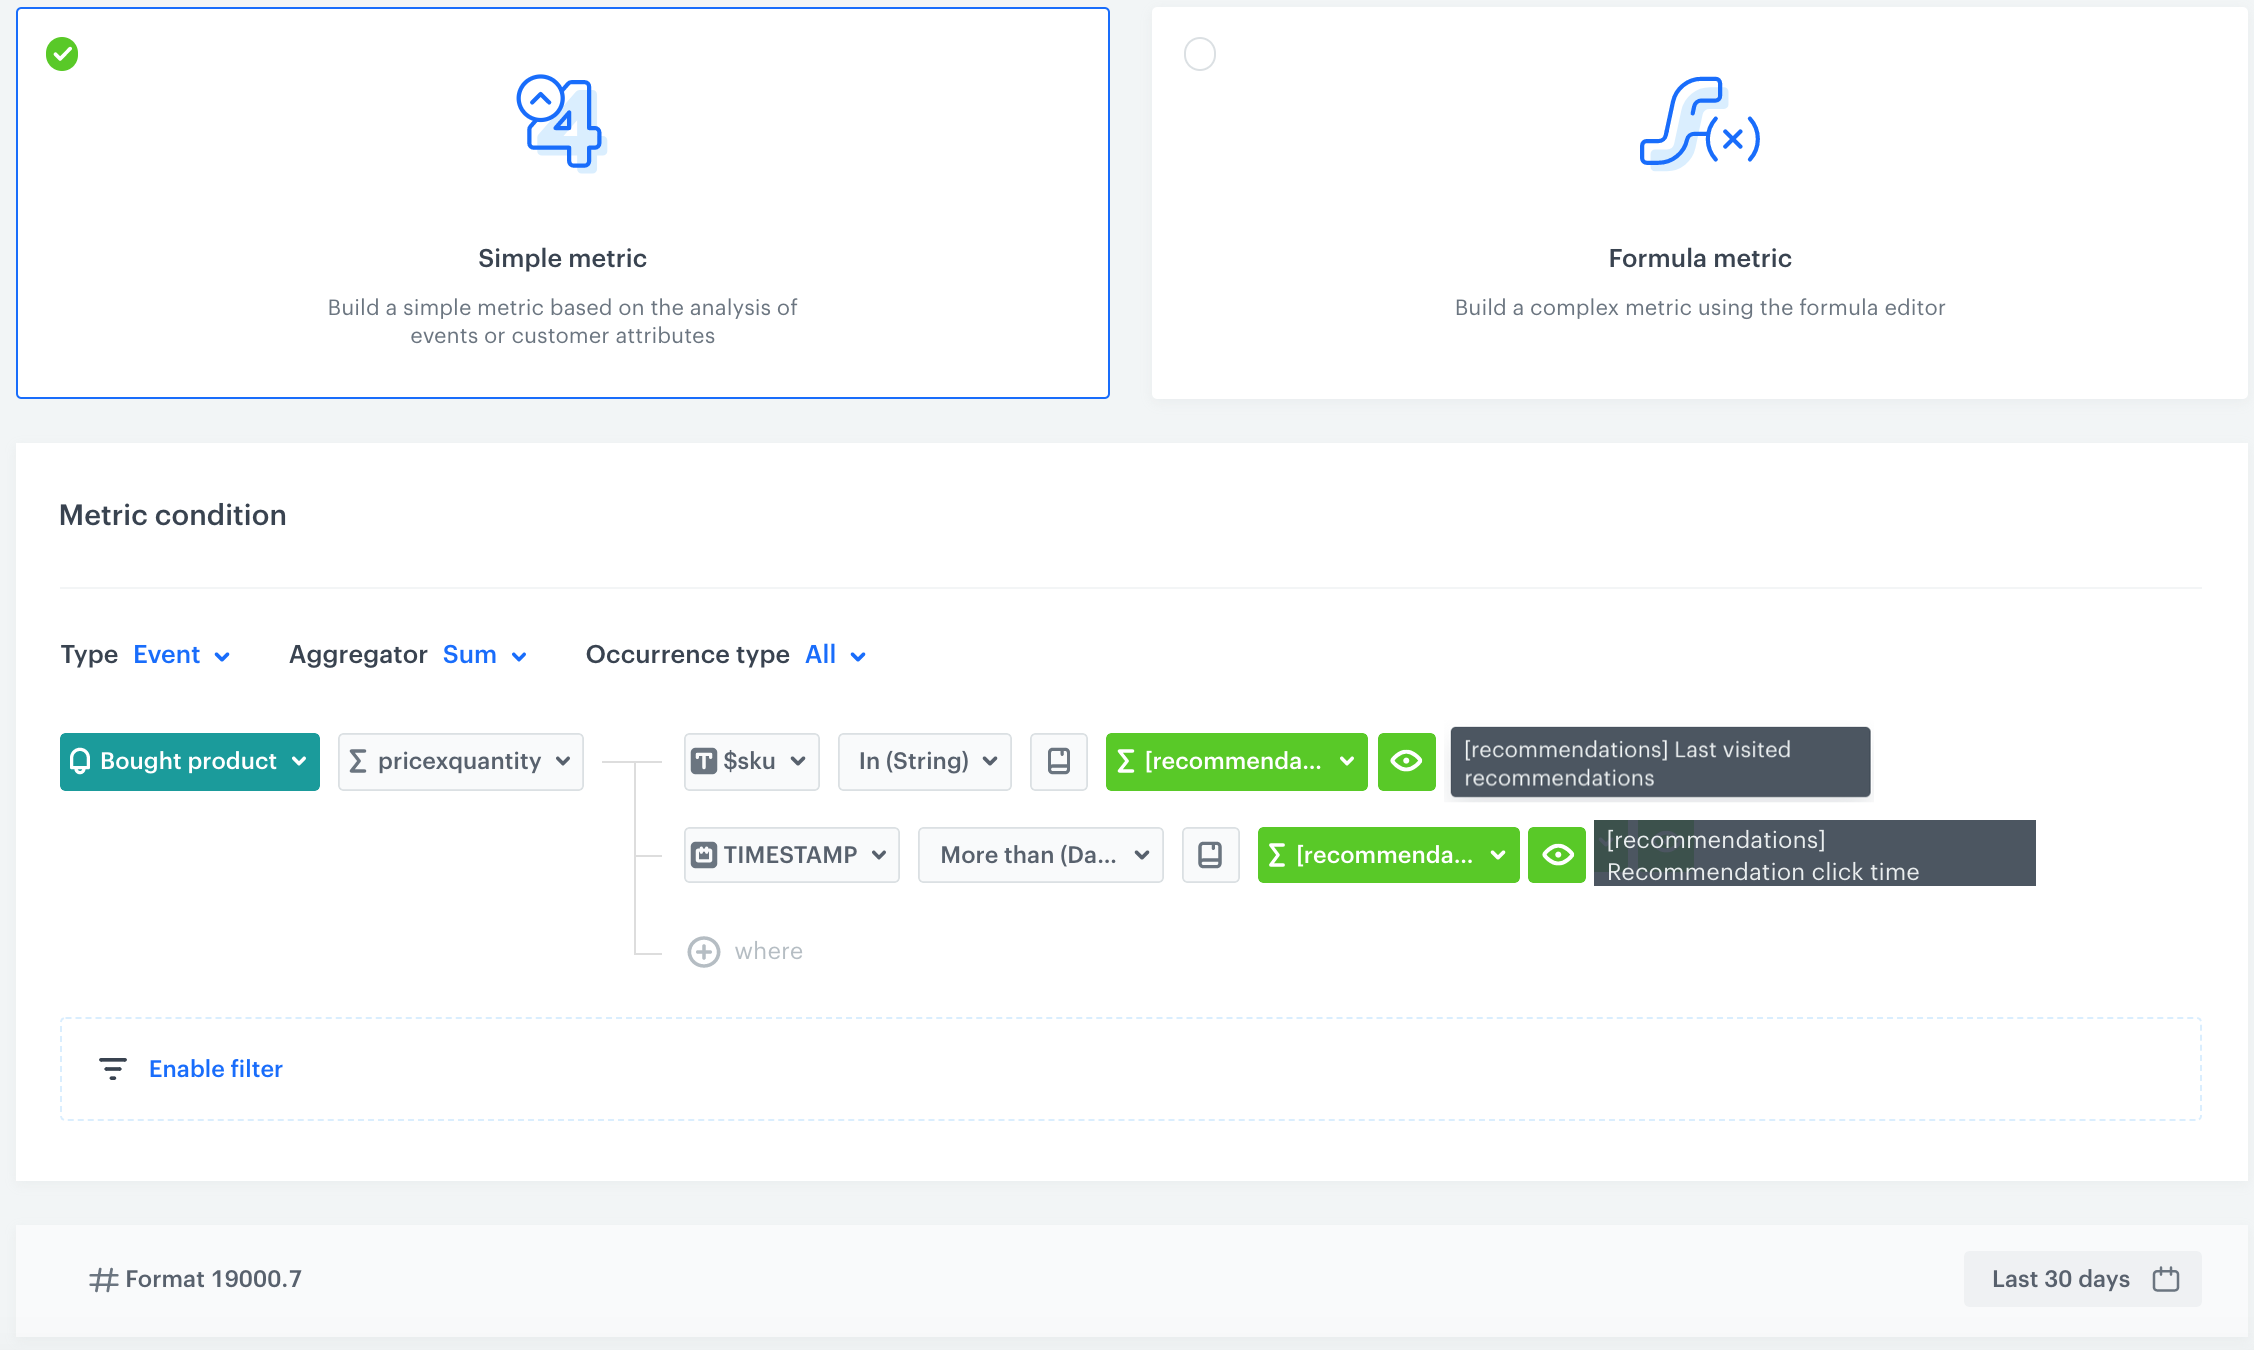
Click to see the metric for the sum of products bought after clicking a campaign
This metric returns the total sum of products bought after clicking a campaign. The metric uses the expression that multiplies the product price by the product quantity.
You can duplicate the metric that calculates the number of products bought after clicking a product, change the aggregator from Count to Sum and use the expression that multiplies the price by the quantity.
Go to Decision Hub > Metrics > New metric.
Enter the name of the metric.
As the aggregator type, select Sum.
Select the product.buy event.
Add the following parameters:
The expression that multiplies the product price by product quantity.
Select the $sku parameter.
Select the In operator.
Keep clicking the icon next to the logical operator until you get .
Select the date range of the metric (for example, last 30 days).
Save the metric by clicking Save.
Configuration of the metric
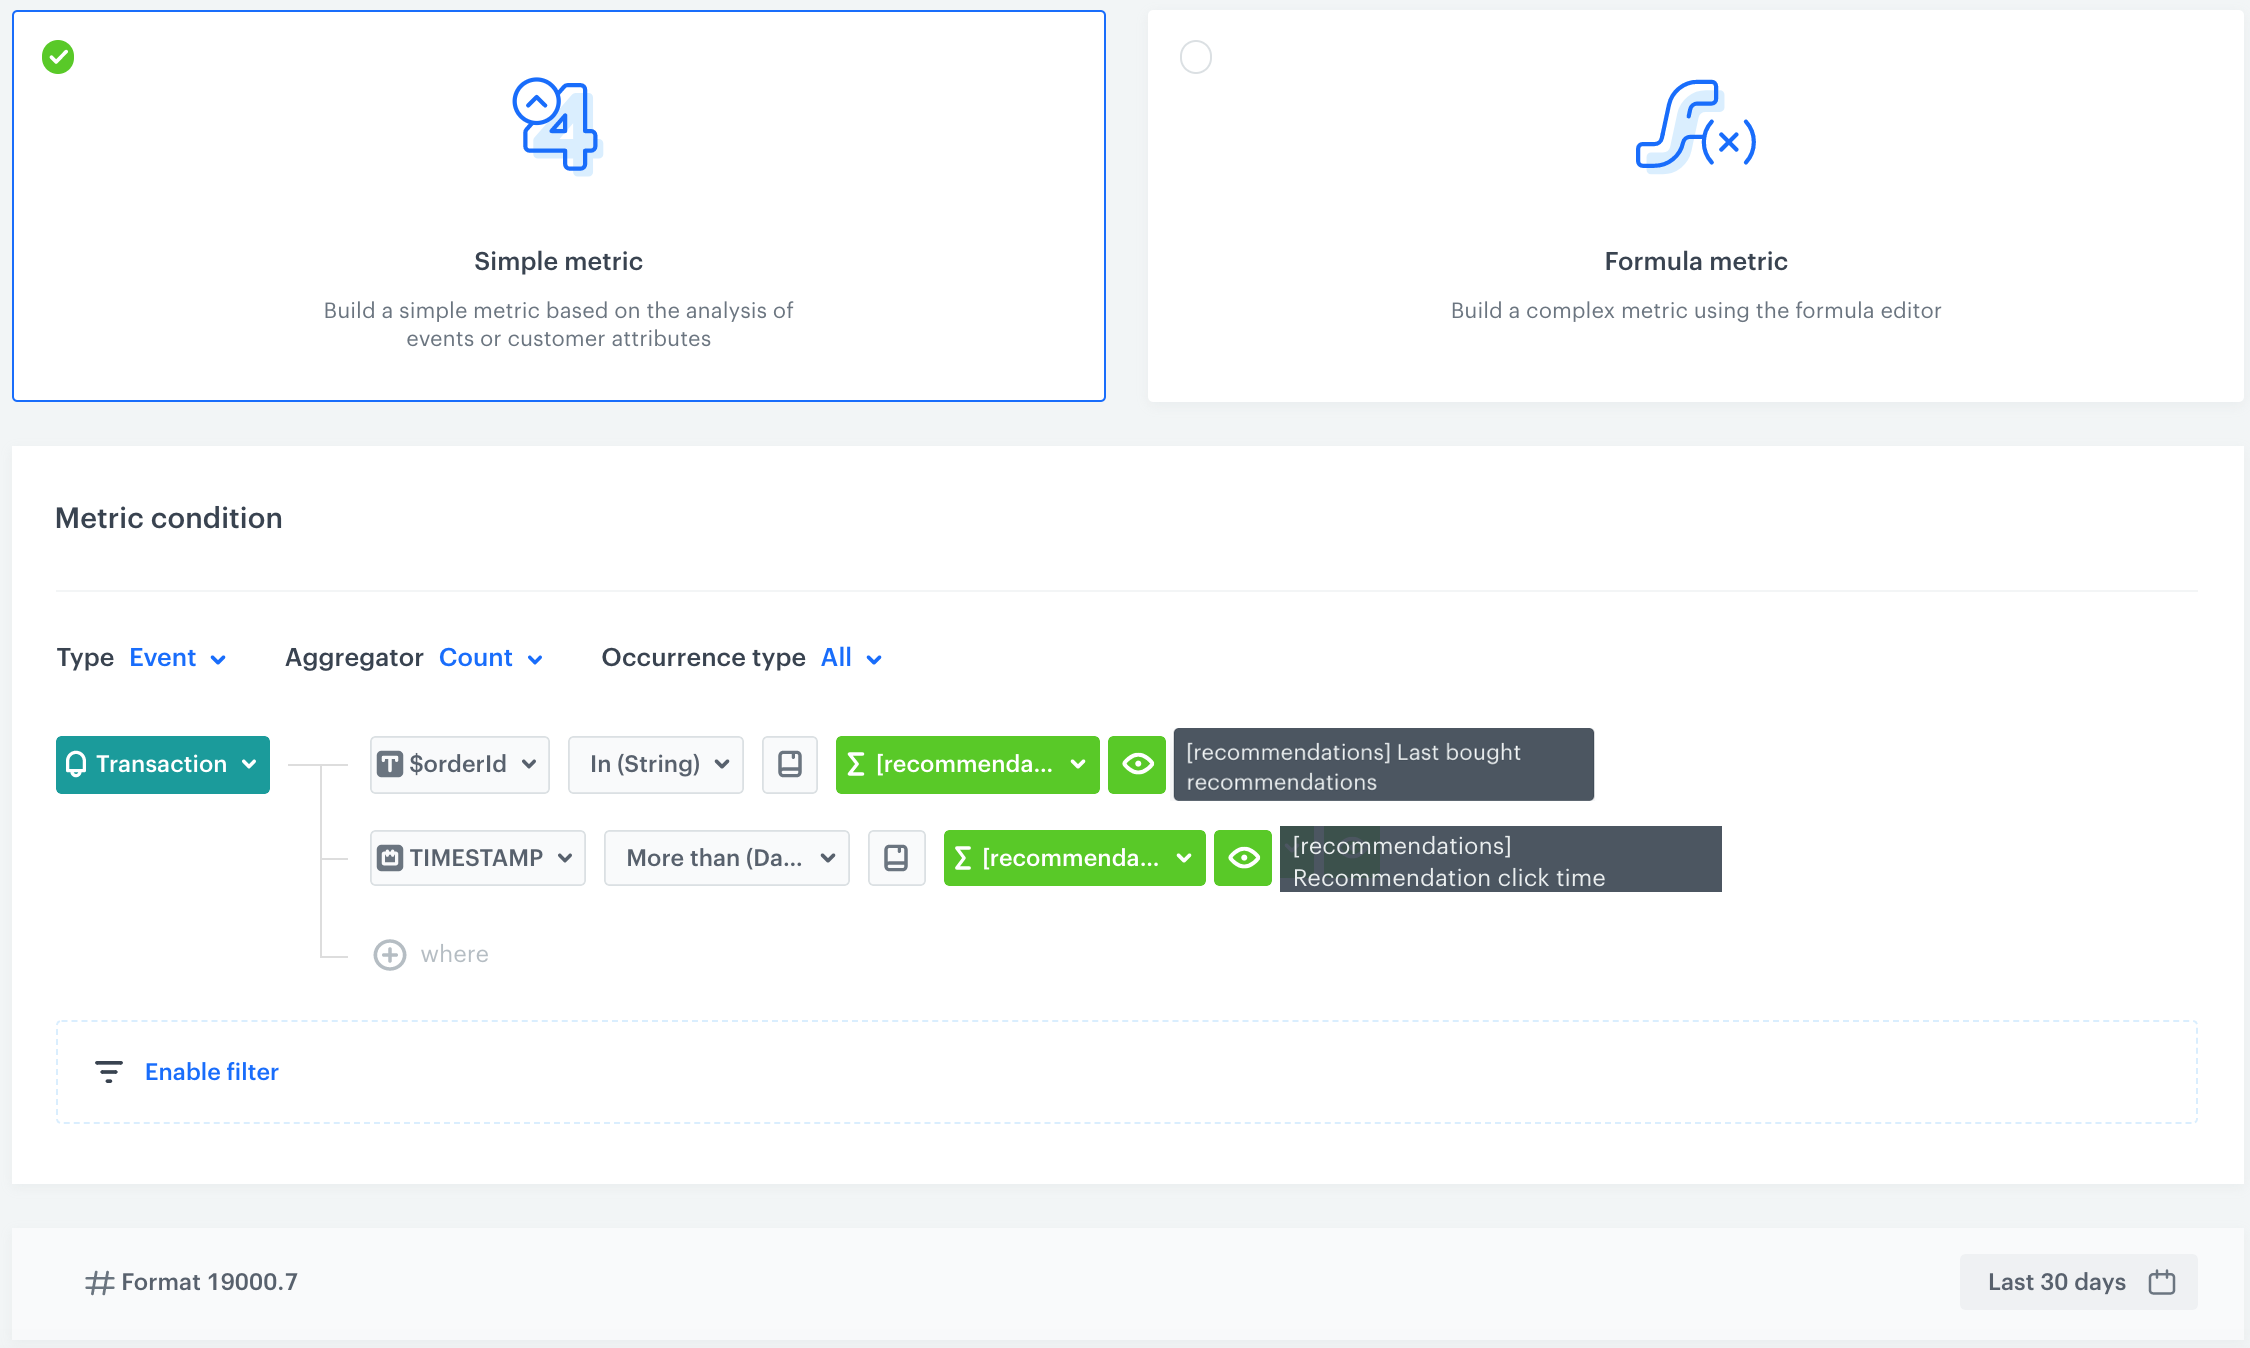
Click to see the metric for the number of transactions with the products bought after clicking a campaign
This metric is based on the transaction.charge event (this event collects an array of products included in the transaction). The metric reuses the aggregate that returns the list of products bought after clicking the campaign to check if the order ID of the product is included in the transaction. The scope of the metric is narrowed down by the aggregate that returns the timestamp of the first visit at the product page.
Go to Decision Hub > Metrics > New metric.
Enter the name of the metric.
Leave the Aggregator to default (Count).
Select the transaction.charge event.
Add the following parameters:
Add the $orderID parameter.
Select the In operator.
Keep clicking the icon next to the logical operator until you get
Select the date range of the metric (for example, last 30 days).
Save the metric by clicking Save.
Configuration of the metric
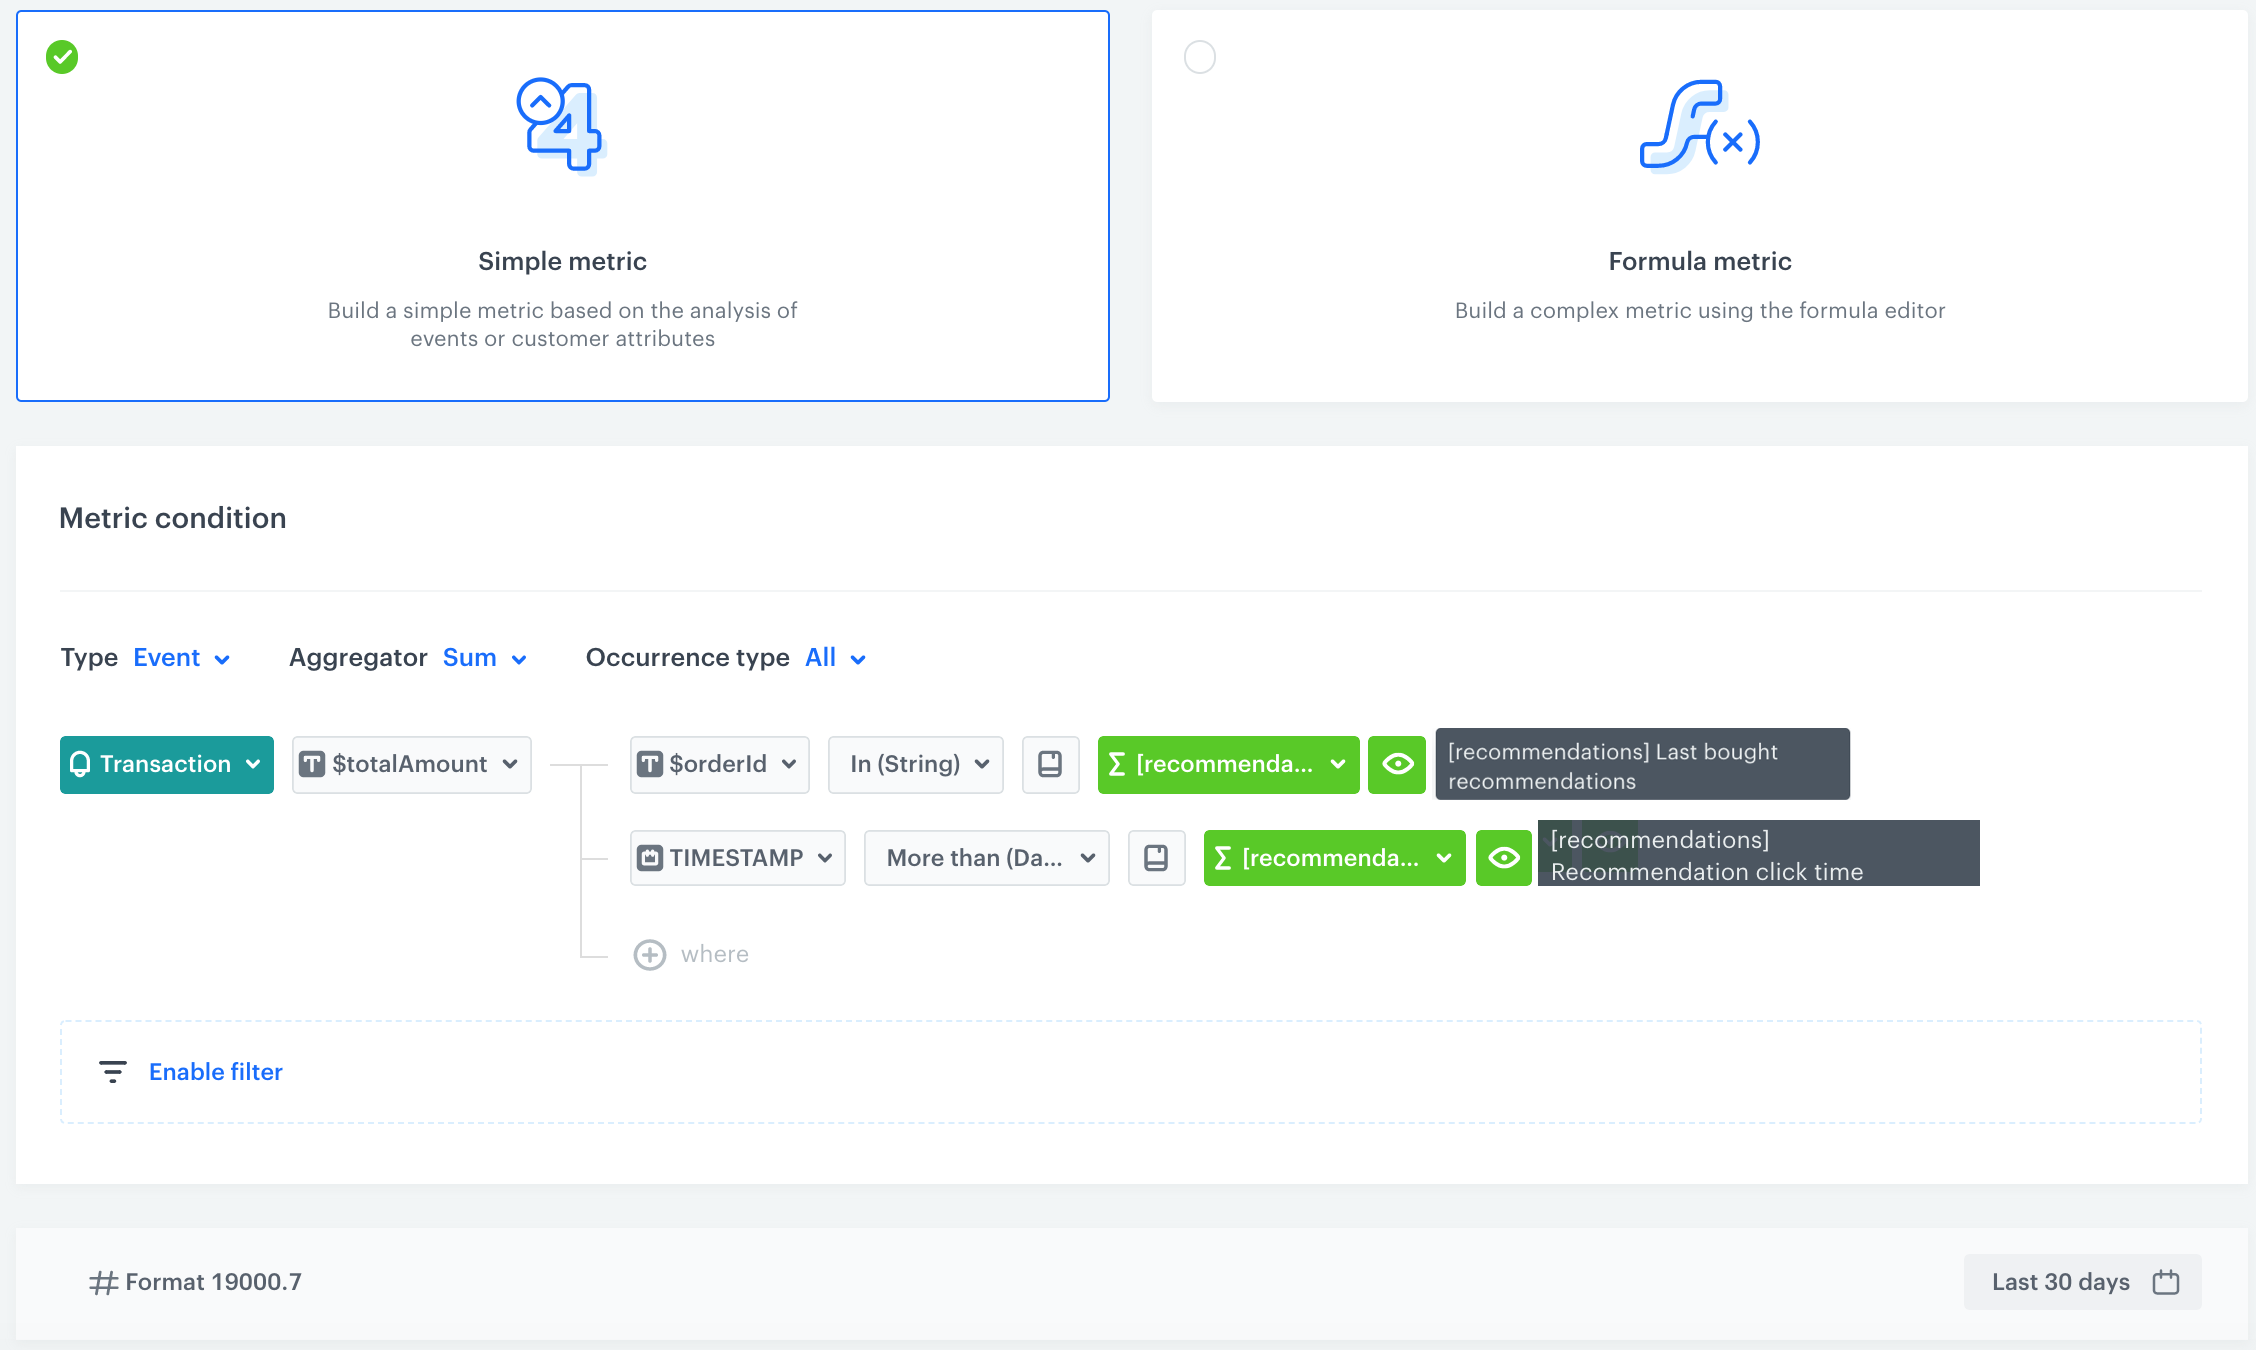
Click to see the metric for the sum of transactions with the products bought after clicking a campaign
This metric is based on the transaction.charge event (this event collects an array of products included in the transaction). The metric reuses the aggregate that returns the list of products bought after clicking the campaign to check if the order ID of the product is included in the transaction. The scope of the metric is narrowed down by the aggregate that returns the timestamp of the first visit at the product page.
If you have already created a metric for the number of transactions with the products bought after clicking a campaign, you can duplicate it and change the aggregator type and use the totalAmount parameter.
Go to Decision Hub > Metrics > New metric.
Enter the name of the metric.
As the Aggregator type, select Sum.
Select the transaction.charge event.
Add the following parameters:
Add the $totalAmount parameter.
Select the In operator.
Keep clicking the icon next to the logical operator until you get
Select the date range of the metric (for example, last 30 days).
Save the metric by clicking Save.
Configuration of the metric
## What's next
---
You can display created metrics on the [dashboard](/docs/analytics/analytics-dashboard), which help you present them in useful and readable form.
## Check the use case set up on the Synerise Demo workspace
---
You can check the created metrics directly in Synerise Demo workspace:
- [Number of products bought after clicking the campaign](https://app.synerise.com/analytics/metrics/2603b814-57e6-4bfd-ad4f-f73677003117)
- [The sum of products bought after clicking a campaign](https://app.synerise.com/analytics/metrics/cada2f5c-5295-4b88-9a29-be74f0cf2044)
- [The number of transactions with the products bought after clicking a campaign](https://app.synerise.com/analytics/metrics/7c105ed8-1c55-438c-bebb-40cdaf06d792)
- [The sum of transactions with the products bought after clicking a campaign](https://app.synerise.com/analytics/metrics/e0058e97-b130-4632-b4aa-5500c369cda9)
If you’re our partner or client, you already have automatic access to the **Synerise Demo workspace (1590)**, where you can explore all the configured elements of this use case and copy them to your workspace.
If you’re not a partner or client yet, we encourage you to fill out the contact [form](https://demo.synerise.com/request) to schedule a meeting with our representatives. They’ll be happy to show you how our demo works and discuss how you can apply this use case in your business.
## Read more
---
- [Aggregates](/docs/analytics/aggregates)
- [Recommendations](/docs/ai-hub/recommendations-v2/creating-recommendation-campaign)