You can use expressions to examine the most frequently visited category of items for every customer. This expression can be used later in an analytical dashboard to monitor the results for the expression.
## Prerequisites
---
- Implement [tracking code](/developers/web/installation-and-configuration#creating-a-tracking-code) on your website.
## Process
---
In this use case, you will go through the following steps:
1. [Create aggregates](/use-cases/most-visited-category#create-aggregates) that count the number of page visits of items in two specific categories - each aggregate calculates page visits to one category.
2. [Create an expression](/use-cases/most-visited-category#create-an-expression) that returns values: `women`, `men`, and `unknown` depending on the number of page visits in the categories selected in the aggregates.
3. [Create an analytical dashboard](/use-cases/most-visited-category#create-an-analytical-dashboard).
## Create aggregates
---
In this part of the process, create two aggregates that count the number of page visits of items in two specific categories - each aggregate calculates page visits to one category.
1. Go to **Behavioral Data Hub > Live Aggregates > Create aggregate**.
2. As the aggregate type, select **Profile**.
2. Enter the name of the aggregate.
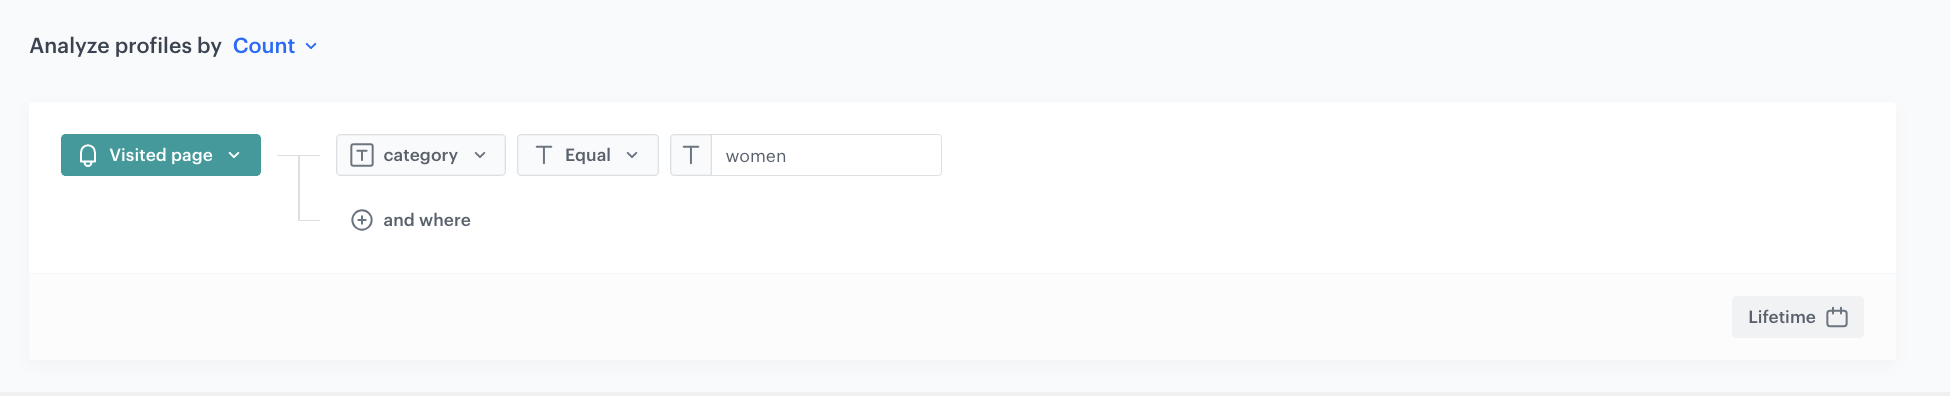
3. Set **Analyze profiles by** to **Count**.
3. Click **Choose event**.
4. From the dropdown list, select **page.visit**.
5. Click **+ where**.
6. Find the **category** parameter.
7. From the logical operator dropdown list, select **Equal**.
8. In the text field, enter `women`.
Modify this name of the parameter according to the actual values of the category parameter you send to Synerise.
9. As the time range, select **Lifetime**.
10. Click **Save**.
The construction of the first aggregate
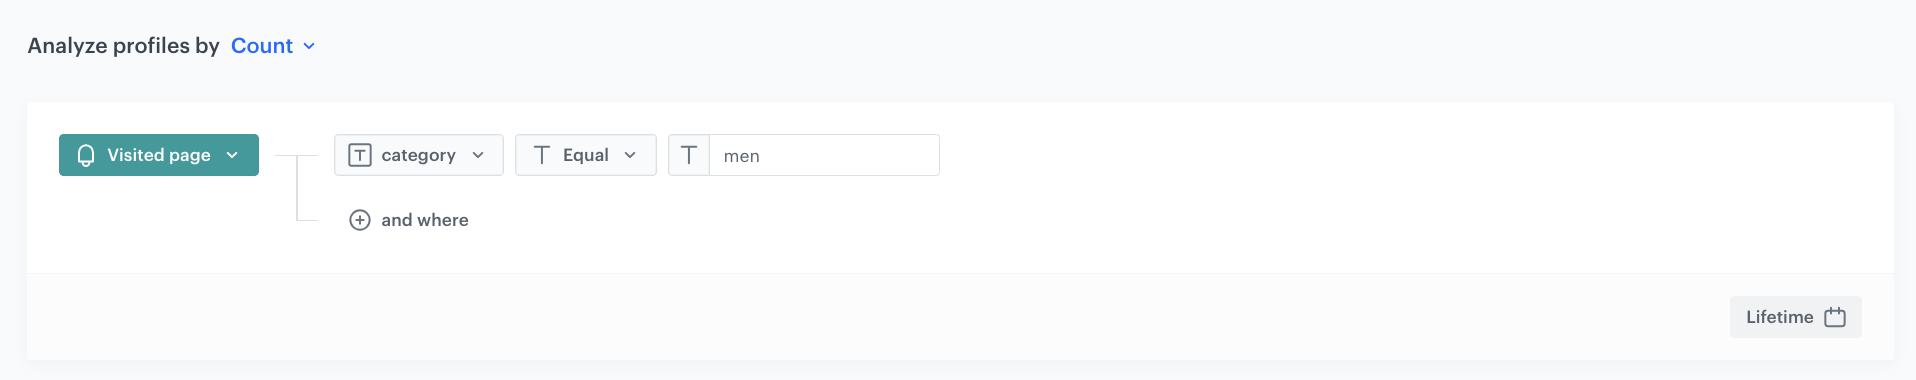
11. Repeat steps from 1 to 11. In step 8, replace `women` with `men`.
The construction of the second aggregate
## Create an expression
---
In this part of the process, create an expression that returns values: `women`, `men`, and `unknown` depending on the number of page visits in the categories selected in the aggregates.
1. Go to **Behavioral Data Hub > Expressions > New expression**.
2. Enter the name of the expression.
2. Leave the selection of the **Expression for** option at default (**Attribute**).
3. Create the following formula:
The construction of the expressionExplanation of the expression logic
The expression creates the following logic:
If the number of page visits in the women category is higher, return women.
If the above condition is not met:
If the number of page visits in the men category is higher, return men.
If the above condition is not met, return unknown.
4. To complete the expression, click **Save**.
5. To check the result of the expression for individual customers, click the **Preview tab**. In the search box, enter the email of a customer.
## Create an analytical dashboard
---
You can add this expression to the analytical dashboard and monitor the result of the expression for individual customers.
1. Go to **Decision Hub > Dashboards > New dashboard**.
2. Click the icon on the dashboard.
2. Double-click the expression added to the dashboard.
3. On the right side, from the dropdown list, select the expression you created.
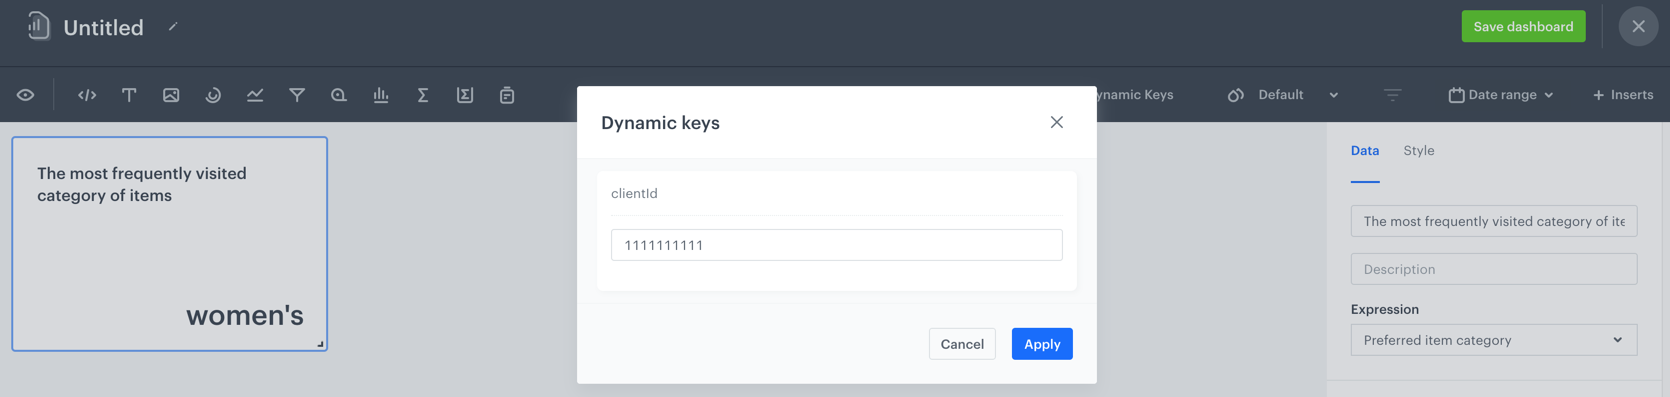
5. Click the icon.
6. Enter the ID of a customer.
7. Click **Apply**.
The result of the expression in the analytical dashboard for an example customer
## Check the use case set up on the Synerise Demo workspace
---
Check the configuration of analyses created in this expressions on Synerise Demo workspace:
- [Aggregate that returns the number of page visits to women's category](https://app.synerise.com/analytics/aggregates/150a51cd-c175-3b33-94cb-c2e778330576).
- [Aggregate that returns the number of page visits to men's category](https://app.synerise.com/analytics/aggregates/f23889e9-b915-3c40-b97f-2662660d9c0a).
- [Expression that returns preferred item category](https://app.synerise.com/analytics/expressions/a9f8f10b-f25c-4ecd-88cf-96e2068dc6e3).
- [Analytical dashboard that uses the expression](https://app.synerise.com/analytics/dashboards/839d3cea-4da9-4927-b343-be1cc59df31b?clientId=11111111111).
If you’re our partner or client, you already have automatic access to the **Synerise Demo workspace (1590)**, where you can explore all the configured elements of this use case and copy them to your workspace.
If you’re not a partner or client yet, we encourage you to fill out the contact [form](https://demo.synerise.com/request) to schedule a meeting with our representatives. They’ll be happy to show you how our demo works and discuss how you can apply this use case in your business.
## Read more
---
- [Aggregates](/docs/analytics/aggregates)
- [Expressions](/docs/analytics/expressions)