Answering a question such as *"Which campaigns drive engagement? Which stores perform best? How do loyalty tiers affect purchase behavior?"* usually requires building three or four separate reports and comparing them manually, or writing an API query.
A single report can include several metrics of the same type, displayed side by side and split by one dimension. Instead of exporting multiple CSV files and combining them in a spreadsheet, you get one report, multiple columns, and one table.
This applies to any scenario where you need three to four KPIs of the same type, split by a single dimension such as campaign, store, segment, or channel.
## Example - Campaign effectiveness
---
**Business question:** *"Which email campaigns drive the most opens AND clicks - and which just burn volume?"*
**Why this matters:** The number of messages sent does not indicate campaign quality on its own. A campaign with a high send volume but a low click-through rate may perform worse than a smaller campaign with strong engagement (for example, a campaign with 100k sends and a 1% CTR is less effective than one with 10k sends and a 20% CTR). By combining Sent, OR, CTR, and CTOR in a single report, you can evaluate the full performance of each campaign in one view, rather than analyzing each metric separately.
**What the report shows:**
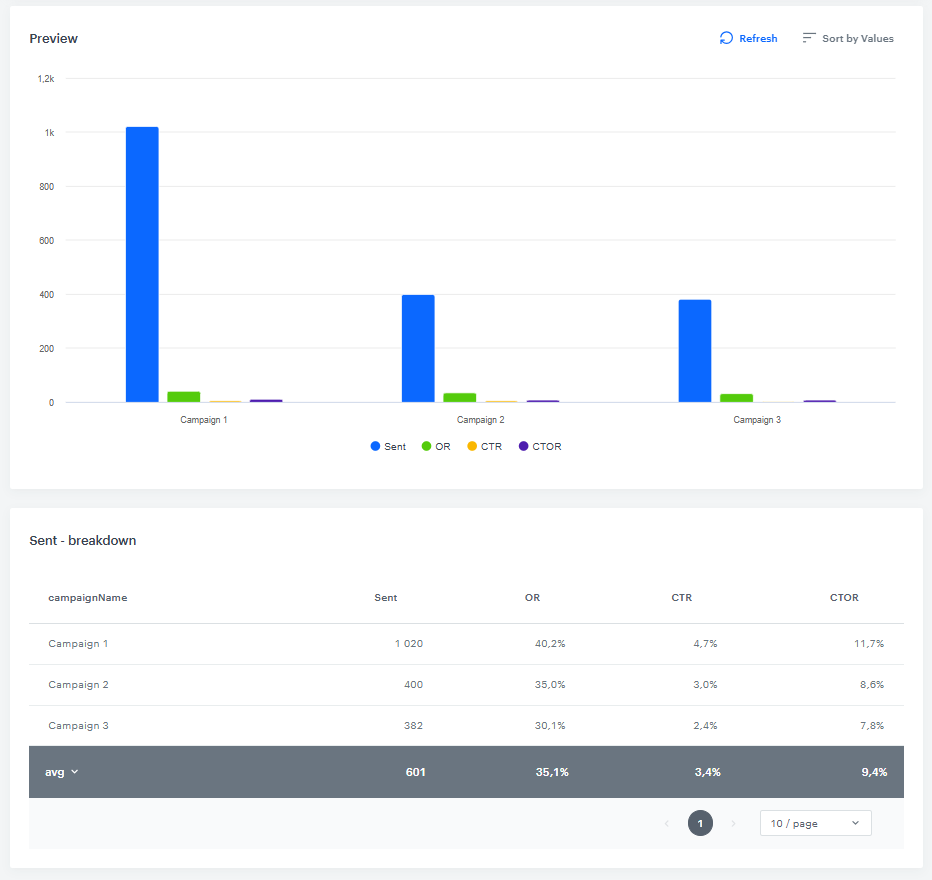
- campaignName
- Sent - count of message.send
- OR - open rate in %
- CTR - click-through rate in %
- CTOR - click-to-open rate in %
Report preview with a chart and a breakdown table split by campaignName
**Based on this report, you can:**
- Reduce investment in campaigns with high send volumes but low engagement.
- Identify subject line or content patterns shared by the best-performing campaigns.
- Support decisions to pause or rework specific campaigns with data rather than assumptions.
The process below builds this campaign effectiveness report step by step. The same steps apply to other scenarios — only the metrics and the dimension change. For more examples, see [Other applications](#other-applications).
## Prerequisites
---
- The metrics you want to compare must be the **same type** — all profile-based or all event-based. Different metric types cannot be mixed in one report.
- You need a **dimension to split the results by**, for example `campaignName`, `retailStoreID`, `customerLoyaltyTier`, or `campaignId` - in this case, `campaignName`.
- The metrics you want to display must already exist in the workspace. For information on building metrics, see [Creating metrics](https://hub.synerise.com/docs/analytics/metrics/). To reuse the rate metrics referenced in this use case (`Open Rate`, `CTR`, `CTOR`), see [Calculate CTR, OR, and CTOR based on unique event occurrences](https://hub.synerise.com/use-cases/calculate-ctr-or-ctor/).
## Process
---
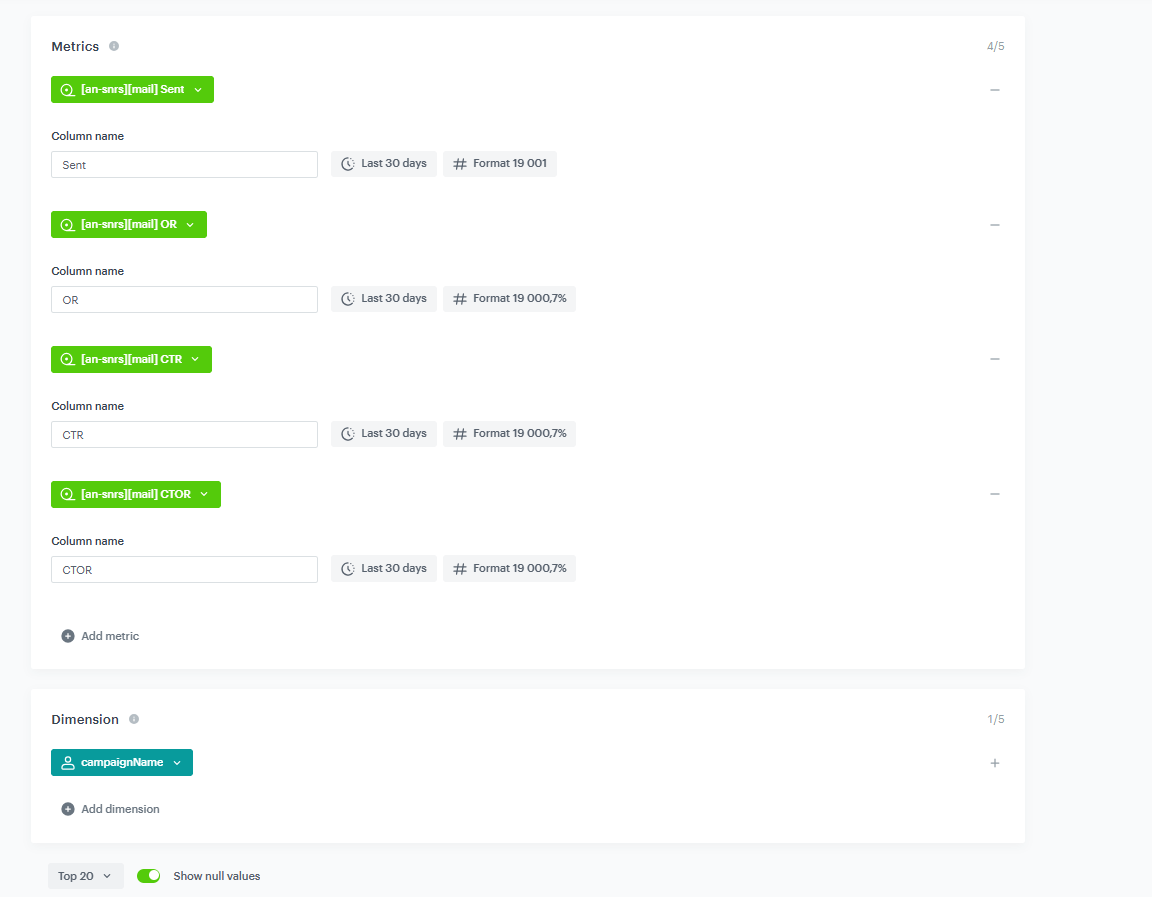
Configuration of the metrics and dimension
In this use case, you will go through the following steps:
1. Create the report.
2. Add the dimension `campaignName`.
3. Add the metrics using [existing formulas](https://hub.synerise.com/use-cases/calculate-ctr-or-ctor/).
4. Rename columns and format as percentages.
5. Preview the results.
6. Save the report.
## What's Next
---
After saving the report, you can:
- Monitor it weekly on a dashboard.
- Share with your team inside and outside of Synerise.
- Export for analysis in other tools.
## Other applications
---
The same report-building steps apply to other analyses. Only the metrics and the dimension change. The scenarios below show common variations.
### Store Performance
**Business question:** *"Which physical stores sell the most - and which have the best basket quality?"*
**Why this matters:** A store with an average transaction count but a high Average Order Value (AOV) represents a different situation than a store with many transactions and a low Average Order Size (AOS). Analyzing all three metrics together provides the context needed to make accurate operational decisions.
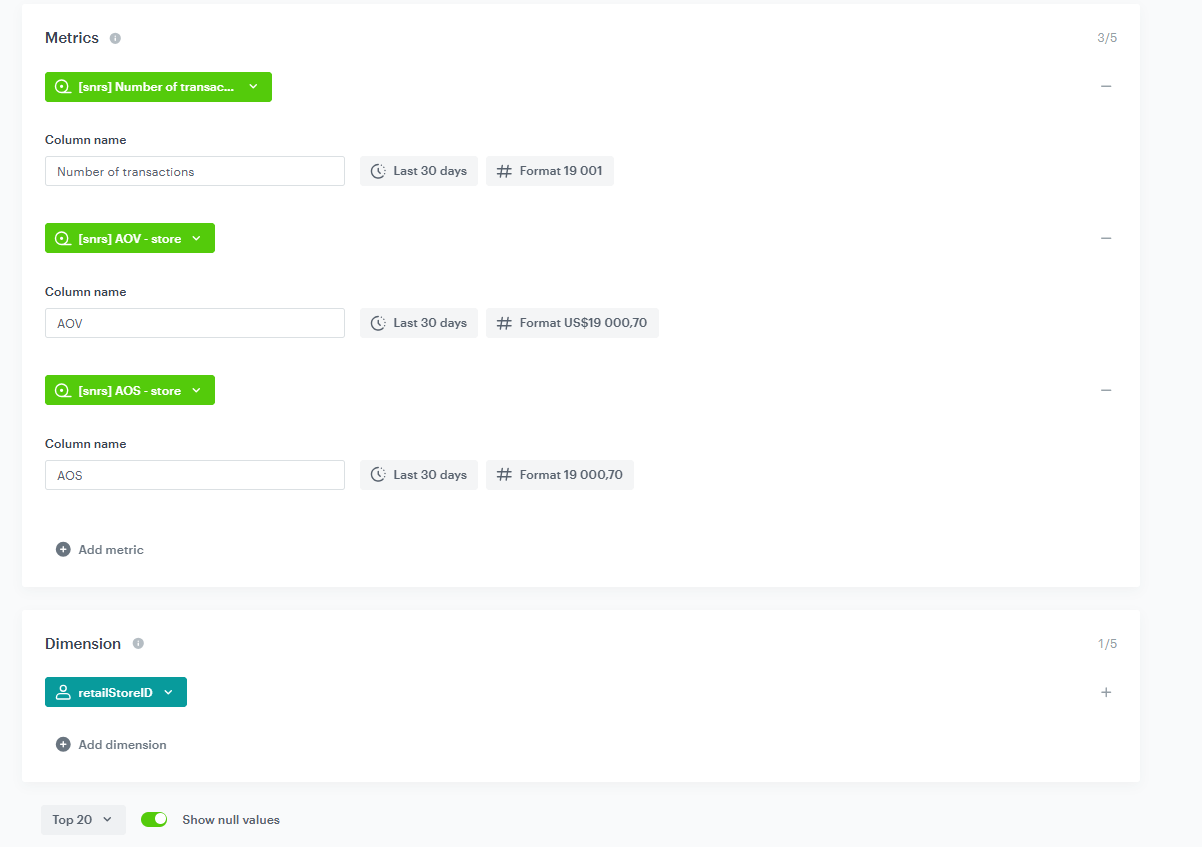
Configuration of the metrics and dimension
Each metric describes a different aspect of store performance:
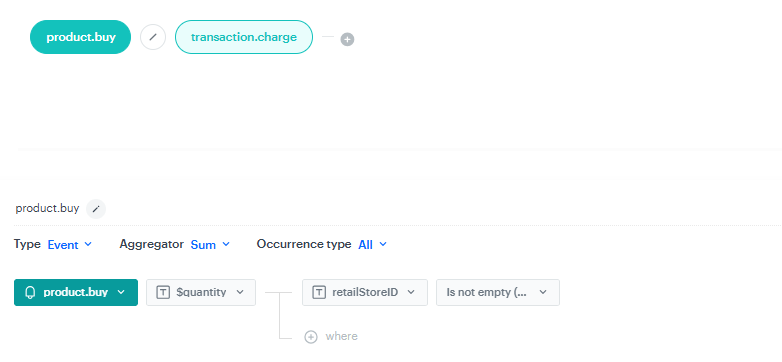
- Transaction count reflects traffic.
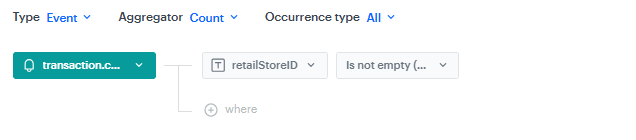
Configuration of the Number of transactions metric
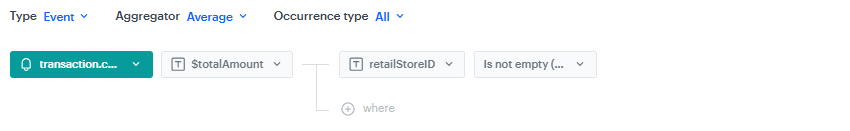
- AOV reflects basket size.
Configuration of the AOV metric
- AOS reflects the number of items per purchase.
Configuration of the AOS metric
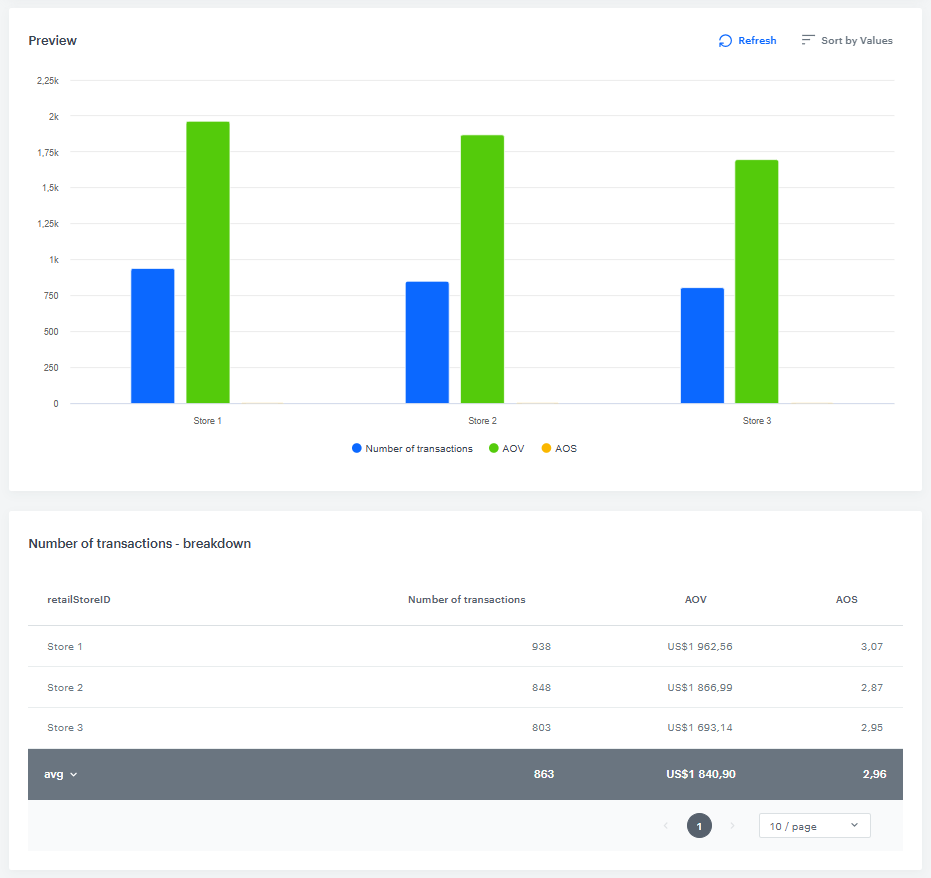
**What the report shows:**
Report preview with a chart and a breakdown table split by retailStoreID
**Based on this report, you can:**
- Identify stores that may benefit from upsell training (high traffic, low AOV).
- Recognize stores outperforming others in their region (high AOV and high AOS).
- Share a single report view with store operations teams, without exporting data to external tools.
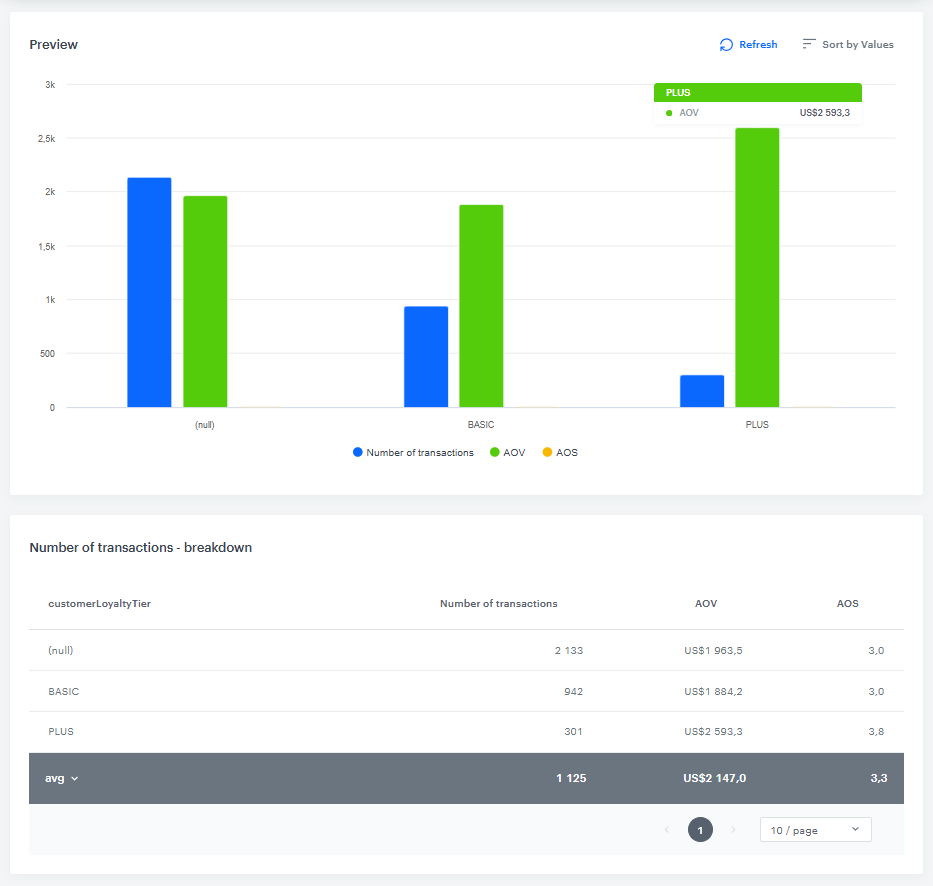
### Loyalty Tier Analysis
**Business question:** *"Do loyalty members spend more than non-members, and is the program worth maintaining?"*
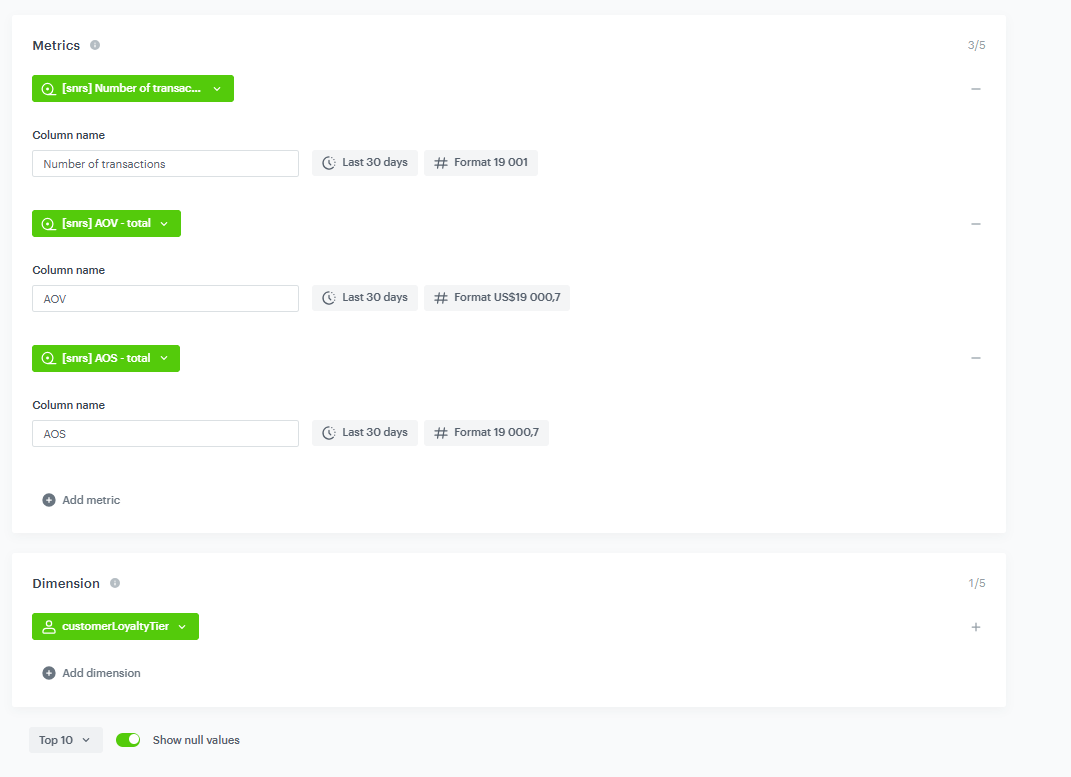
**Why this matters:** Without this comparison, the return on investment of a loyalty program is difficult to assess. Viewing Transactions, AOV, and AOS split by loyalty tier (basic, plus, and non-members) in a single table provides the data needed to support or challenge the program investment during business reviews.
Configuration of the metrics and dimension
**What the report shows:**
Report breakdown table split by customer loyalty tier
**Based on this report, you can:**
- Confirm or disprove that loyalty members generate higher basket value.
- Determine whether the program primarily drives purchase frequency (Transactions) or order value (AOV).
- Use the results to justify program costs or to support changes to the tier benefit structure.
## Read more
---
- [Reports](https://hub.synerise.com/docs/analytics/reports/)
- [Creating reports](https://hub.synerise.com/docs/analytics/reports/creating-reports/)
- [Metrics](https://hub.synerise.com/docs/analytics/metrics/)
- [Dashboards](https://hub.synerise.com/docs/analytics/dashboards/)