Often when working with big datasets and collecting huge amounts of data, it happens that many outliers end up in the database. In general, outliers are not beneficial to analysis and while representing true data points, they can obscure insights in the data.
Here we demonstrate two examples how you use outliers exclusion in analytics using quantiles.
The first case is creating a segmentation of clients with typical purchases, and the second one is an example how to calculate a metric that only calculates typical (without outliers) values.
## Prerequisites
---
- Implement [tracking code](/developers/web/installation-and-configuration#creating-a-tracking-code) on your website.
- Implement [transactions](/developers/web/transactions-sdk).
## Process
---
In this use case, you will go through the following steps:
1. [Create segmentation](/use-cases/outlier-exclude#create-segmentation-of-clients-with-typical-purchases) of clients with typical purchases.
2. [Create aggregate](/use-cases/outlier-exclude#create-aggregate-to-define-outliers) to define outliers.
3. [Create segmentation](/use-cases/outlier-exclude#create-segmentation-for-customers-who-are-not-outliers) for customers who are not outliers.
4. [Create metric](/use-cases/outlier-exclude#calculate-the-sum-of-transactions-without-outliers) to calculate the sum of transactions without outliers.
## Create segmentation of clients with typical purchases
---
We aim to create a segment of clients and include only typical behaviors with regards to the selected analytic. For example, a segment of clients that made typical purchases in a given time period.
In this example, "typical" means that the value of purchases is between 5th and 95th percentiles, however this may be adjusted as needed.
## Create aggregate to define outliers
---
You need to create two separate aggregates (outliers/high and outliers/low) to define the quantile which denotes outlier values.
1. Go to **Behavioral Data Hub > Live Aggregates > Create aggregate**.
2. As the aggregate type, select **Profile**.
2. Enter the name of the aggregate.
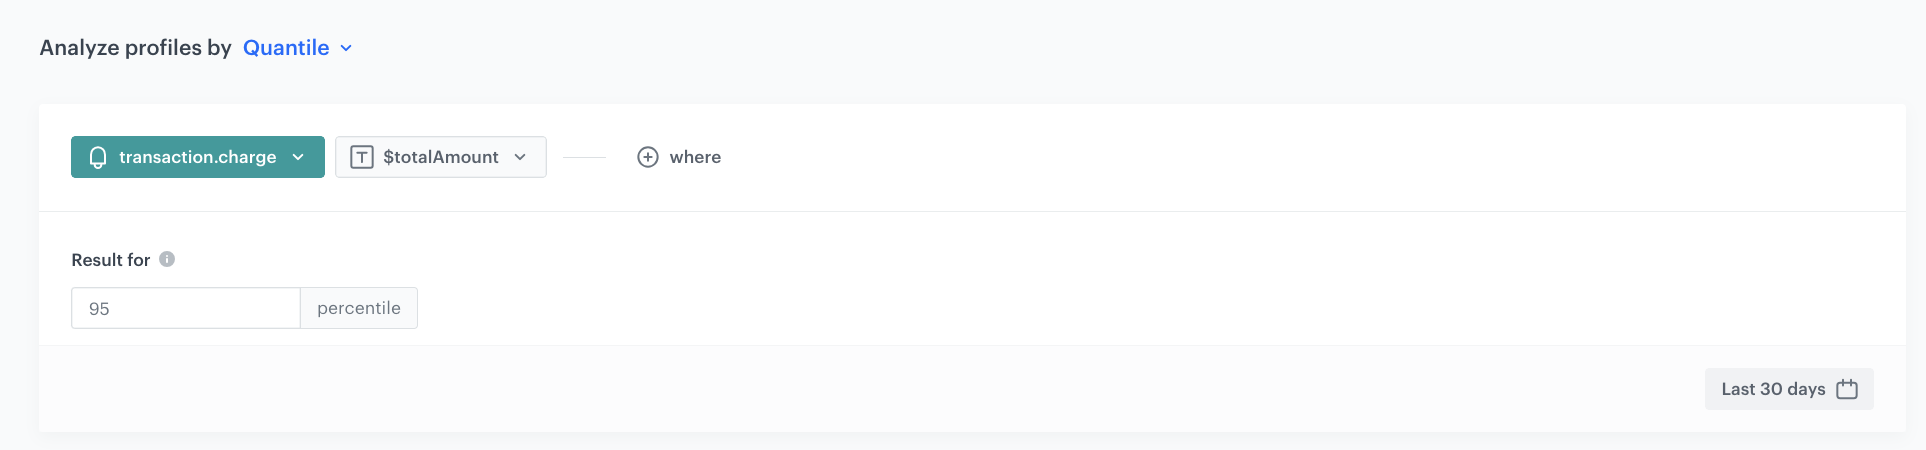
3. Set the **Analyze profiles by** option to **Quantile** and select the appropriate value (in this case `95` for high outliers or `5` for low outliers).
4. Click **Choose event**.
5. From the dropdown list, select **transaction.charge**.
Events may have different labels between workspaces, but you can always find them by their action name (in this step, it's **transaction.charge**).
6. Select the **totalAmount** attribute.
7. Save the aggregate.
8. Repeat steps 1-7 to create the other aggregate.
A single aggregate should look more or less like this:
Outliers
## Create segmentation for customers who are not outliers
---
In this stage, you create a segmentation that list the customers who are *not* outliers.
6. Go to **Decision Hub > Segmentations > New segmentation**.
7. Enter the name of the segmentation.
9. On the canvas, click **Choose filter**.
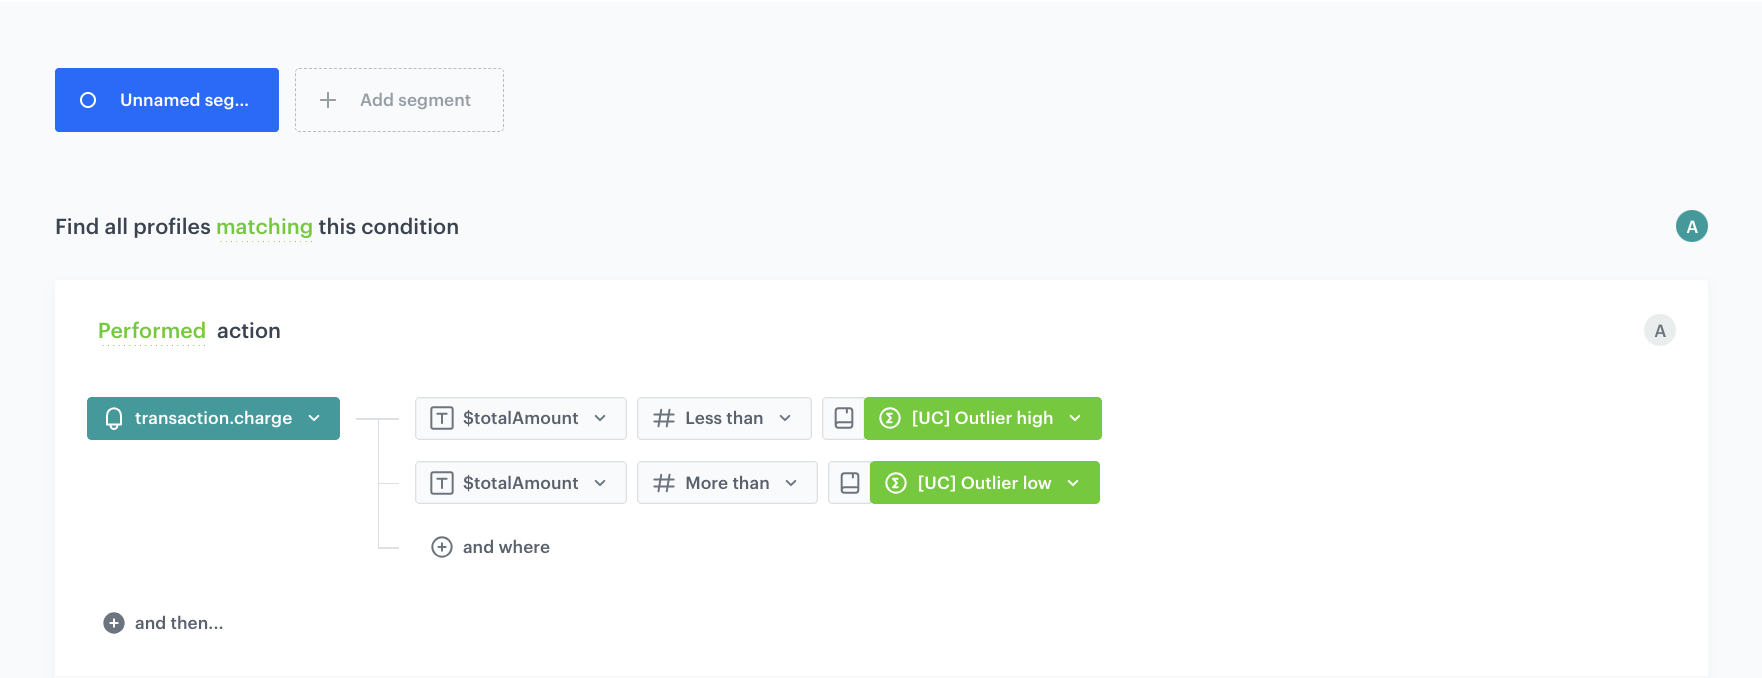
10. From the dropdown list, select the **transaction.charge** event.
11. Click the **where** input that appeared on the canvas.
12. Click **$totalAmount**.
If the attribute is not visible in the list, you can use the search field.
13. Choose the **More than** number operator.
14. Click the icon until it changes to dictionary
15. From the list of available dictionaries, select the low outlier aggregate you create earlier.
16. Add the high outlier aggregate by repeating steps 5-9, but change the operator to **Less than**.
17. Save the segmentation.
The end result should look more or less like this:
Outliers
## Calculate the sum of transactions without outliers
---
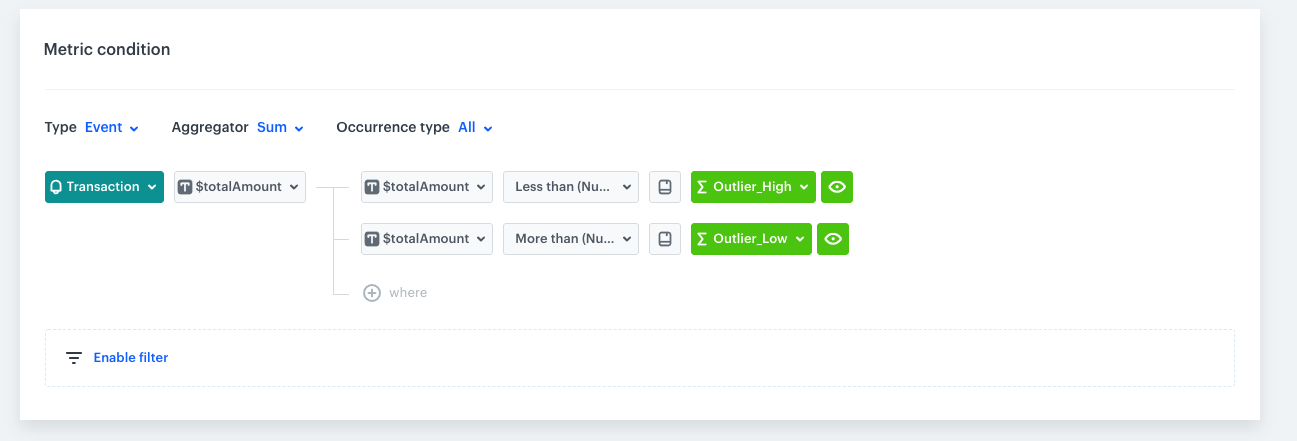
In this part, create a simple metric that calculates the sum of transactions for a given time range, without outliers in the transactions.
1. Go to **Decision Hub > Metrics > New Metric**.
You can find the detailed instructions on creating simple metrics [here](/docs/analytics/metrics/creating-simple-metrics).
2. Enter the name of the metric.
3. As the aggregator, select **Sum**.
10. From the dropdown list, select the **transaction.charge** event.
11. Click the **where** input that appeared on the canvas.
12. Click **$totalAmount**.
If the attribute is not visible in the list, you can use the search field.
13. Choose the **More than** number operator.
14. Click the icon until it changes to dictionary
15. From the list of available dictionaries, select the low outlier aggregate you create earlier.
16. Add the high outlier aggregate by repeating steps 5-9, but change the operator to **Less than**.
17. Save the metric.
Metric without outliers
## Check the use case set up on the Synerise Demo workspace
---
You can check the analyses created in this use case in our Synerise Demo workspace:
- [Segmentation of customers who made purchase in last 30 days](https://app.synerise.com/analytics/segmentations/7b96db59-0d8d-4d5c-9b74-0107a5d866fa).
- [Outlier high aggregate](https://app.synerise.com/analytics/aggregates/427c31e3-8038-3f0c-889d-4cd60e308c71)
- [Outlier low aggregate](https://app.synerise.com/analytics/aggregates/9a6bd735-39fe-37de-a62a-e161bdb656b0)
- [Segmentation of customers who are not outliers](https://app.synerise.com/analytics/segmentations/2a9a47a4-6202-4fd1-a9cc-ac59c703236a)
- [Metric that counts the sum of transactions without outliers](https://app.synerise.com/analytics/metrics/223a8310-51a3-4ad1-a7b3-794f3d86dbeb).
If you’re our partner or client, you already have automatic access to the **Synerise Demo workspace (1590)**, where you can explore all the configured elements of this use case and copy them to your workspace.
If you’re not a partner or client yet, we encourage you to fill out the contact [form](https://demo.synerise.com/request) to schedule a meeting with our representatives. They’ll be happy to show you how our demo works and discuss how you can apply this use case in your business.
## Read more
---
- [Metrics](/docs/analytics/metrics)
- [Segmentation](/docs/analytics/segmentations)