
Each store can identify customers who return or exchange products more often than others. In this case, we are dealing with "serial returners" - shoppers responsible for excessive returns. Some of them may have insincere intentions, while the others may suffer from controlling their buying behavior. Typically, these customers cost sellers a lot of money, so it’s helpful to know which customers are likely to return and to plan the steps to prevent frequent returns and save the company time and money.

This use case describes the process of creating a segmentation of customers with the highest propensity for returns. This segmentation can later be excluded from selected campaigns that provide promotional codes or other discounts, helping a company optimize the cost of planned campaigns that are oriented toward customers who will benefit from such a promotion and enjoy the purchase. 

## Prerequisites
---

- [Integrate JS SDK](/developers/web/installation-and-configuration) or implement Synerise SDK in your [mobile application](/developers/mobile-sdk) - greater data collection will allow the model to be better trained and produce better results.
- Implement transaction events using [SDK](/developers/web/transactions-sdk) or [API](https://developers.synerise.com/DataManagement/DataManagement.html#operation/CreateATransaction).
- [Enable the Lookalike prediction type](/docs/ai-hub/predictions/enabling-predictions#enabling-lookalikes).
- [Implement a custom event](https://developers.synerise.com/DataManagement/DataManagement.html#operation/CustomEvent) that refers to the returned products. As an example, such an event could be named `product.return`. The exemplary event is available below:
   
    
  <pre><code class="language-javascript">
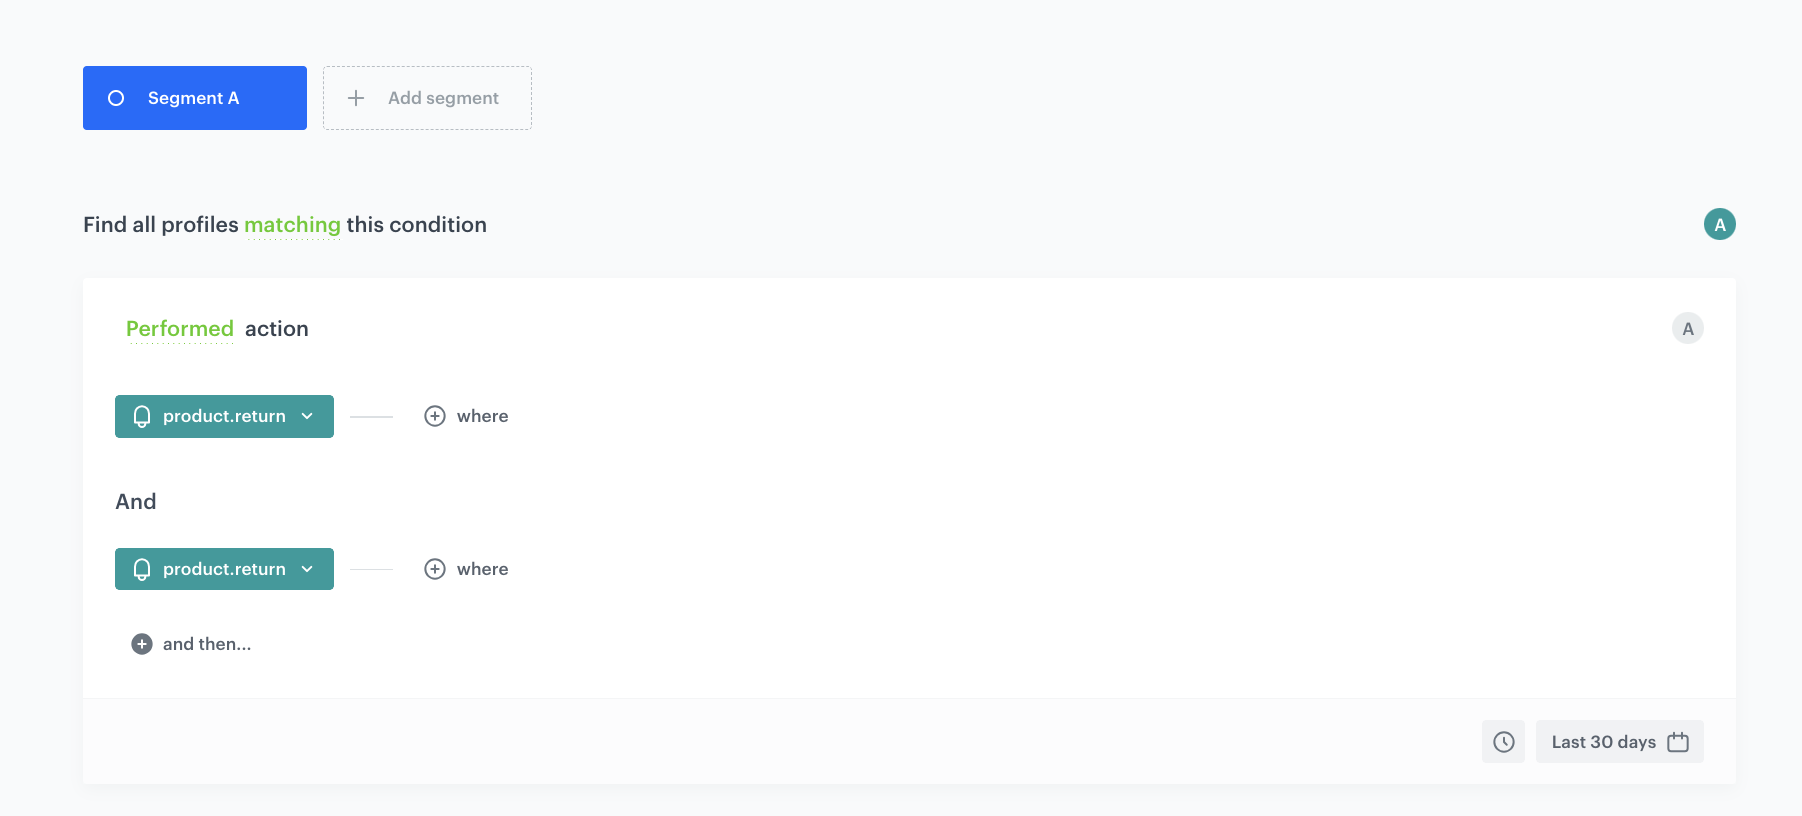
SR.event.trackCustomEvent { "label": "The customer returned product", 
                              "client": { "email": "testDoc@synerise.com" }, 
                              "action": "product.return", 
                              "params": { "product_sku": "xxx", "orderId": "xxx", 
                              "reason_of_return": "shoes were too small" } }</code></pre>


## Process
---

1. Create a [target segmentation](/use-cases/predicting-returns#create-a-target-segmentation).
2. Create a [source segmentation](/use-cases/predicting-returns#create-a-source-segmentation).
3. [Create a prediction](/use-cases/predicting-returns#create-a-prediction).

## Create a source segmentation
---

In this part of the process, create a source segmentation that contains customers who will be compared with the customers in the target segmentation. This segmentation includes customers who have made at least two returns in the last 30 days. The fastest way to make such a segmentation is to create a `product.return` event funnel.

1. Go to <img src="/api/docs/image/54176ad07f146575310749eba44b7c2f42c1b327/icons/decision-hub-icon.svg" alt="Decision Hub icon" class="icon" > **Decision Hub > Segmentations > New segmentation**.  
2. Enter the name of the segmentation.
3. From the **Add condition** dropdown list, select the `product.return` event.
4. From the **and then** dropdown list, select the same event.
5. As the time range, set **Last 30 days**.  

    
   <div class="admonition admonition-note"><div class="admonition-icon"><svg xmlns="http://www.w3.org/2000/svg" fill="none" viewBox="0 0 24 24" stroke="currentColor" stroke-width="2.5"><path stroke-linecap="round" stroke-linejoin="round" d="M13 16h-1v-4h-1m1-4h.01M21 12a9 9 0 11-18 0 9 9 0 0118 0z" /></svg></div><div class="admonition-body"><div class="admonition-content">

   You can freely manage the number of events in the funnel and the selected time range to create conditions that suit your business objectives.

   </div></div></div>


6. Save the segmentation. 

<figure>
<img src="/api/docs/image/54176ad07f146575310749eba44b7c2f42c1b327/use-cases/all-cases/_gfx/target-segment.png" alt="Configuration of the target segmentation"  class="full">
<figcaption>Configuration of the target segmentation</figcaption>
</figure> 

## Create a target segmentation
---

Create a segment of customers among whom you want to find those most likely to make a return. 

1. Go to <img src="/api/docs/image/54176ad07f146575310749eba44b7c2f42c1b327/icons/decision-hub-icon.svg" alt="Decision Hub icon" class="icon" > **Decision Hub > Segmentations > New segmentation**.  
2. Enter the name of the segmentation.
3. From the **Add condition** dropdown list, select the `product.buy` event.
4. As the time range, set **Last 30 days**.
5. Save the segmentation. 

<figure>
<img src="/api/docs/image/54176ad07f146575310749eba44b7c2f42c1b327/use-cases/all-cases/_gfx/source-segment.png" alt="Configuration of the source segment"  class="full">
<figcaption>Configuration of the source segment</figcaption>
</figure> 

## Create a prediction
---
In this part of the process, create a Lookalikes prediction which compares the two segmentations - the engine looks for customers in the target segmentation who are most similar to the customers in the source segmentation. On the profile cards of all customers from the target segmentation, a `snr.lookalike.score` event is generated. In the details of the event, you can find the **score_label** parameter that describes the similarity of a customer to the customers in the source segmentation. The **score_label** parameter for this particular prediction takes two values: low or high.

1. Go to <img src="/api/docs/image/54176ad07f146575310749eba44b7c2f42c1b327/icons/ai-hub-icon.svg" alt="AI Hub icon" class="icon" > **AI Hub > (AI Predictions) Models > New prediction**.
2. In the **Select prediction type** window that appears, click **Lookalikes**.
3. Click **Apply**.
4. In the **Audience** section, click **Define**.  
5. In the **Source segmentation** subsection, click **Choose segmentation**. 
6. From the dropdown list, select the [source segmentation](/use-cases/predicting-returns#create-a-source-segmentation) you created before.
7. In the **Target segmentation** subsection, click **Choose segmentation**.
8. From the dropdown list, select the [target segmentation](/use-cases/predicting-returns#create-a-target-segmentation) you created before.
9. Confirm by clicking **Apply**.
10. In the **Settings** section, click **Change**.
11. Enable the **Set up recurring prediction calculation** option.
12. Set the recalculation of the prediction every 30 days. The segmentation is recalculated before a prediction is recalculated - recalculation of the segmentation concerns recurring predictions which intervals are longer than several hours. 

    
    <div class="admonition admonition-note"><div class="admonition-icon"><svg xmlns="http://www.w3.org/2000/svg" fill="none" viewBox="0 0 24 24" stroke="currentColor" stroke-width="2.5"><path stroke-linecap="round" stroke-linejoin="round" d="M13 16h-1v-4h-1m1-4h.01M21 12a9 9 0 11-18 0 9 9 0 0118 0z" /></svg></div><div class="admonition-body"><div class="admonition-content">

    You can define a different recalculation time that better fits your business goals.

    </div></div></div>


13. Select the **2-point scale**.
14. Confirm by clicking **Apply**.  
15. Click **Save & Calculate**. 

## What's next
---
Based on the `snr.lookalike.score` event, create a segmentation for cusomers with the highest lookalike score (customers who are most likely to return). To define the size of the recipient group, you can use the `score_label` parameter of the `snr.lookalike.score` with the `score` value set to `High`. Below you can find an example of the `snr.lookalike.score` event that appears in the customer profile. 

<figure>
<img src="/api/docs/image/54176ad07f146575310749eba44b7c2f42c1b327/use-cases/all-cases/_gfx/snr.lookalike.score_high.png" alt="Example of event `snr.lookalike.score`"  class="large">
<figcaption>Example of event `snr.lookalike.score`</figcaption>
</figure> 

An example of the segmentation of customers with the highest probability to return is shown in the following screen:

<figure>
<img src="/api/docs/image/54176ad07f146575310749eba44b7c2f42c1b327/use-cases/all-cases/_gfx/snr.lookalike.score_segmentation.png" alt="Example of segmentation based on lookalike prediction score"  class="full">
<figcaption>Example of segmentation based on lookalike prediction score</figcaption>
</figure> 

Later, you can use this segmentation to exclude it for example from email or SMS promotional campaigns, saving campaign costs on customers who are likely to return products purchased within these campaigns.

## Check the use case set up on the Synerise Demo workspace
---

You can check the configuration of each step from this use case in our Synerise Demo workspace.

- [Source segmentation](https://app.synerise.com/analytics-v2/segmentations/77193186-ce52-499e-b490-e5d46653ad73)
- [Target segmentation](https://app.synerise.com/analytics-v2/segmentations/18ded12e-5ffa-46de-a4a6-60e90beaf42a)
- [Prediction](https://app.synerise.com/ai-v2/predictions/lookalike/tiaxsmgucdrg)

Go to the Predictions tab, on the left menu select Lookalikes, and then paste the URL of [this prediction](https://app.synerise.com/ai-v2/predictions/lookalike/rugfywvfwijp).

If you’re our partner or client, you already have automatic access to the **Synerise Demo workspace (1590)**, where you can explore all the configured elements of this use case and copy them to your workspace.  

If you’re not a partner or client yet, we encourage you to fill out the contact [form](https://demo.synerise.com/request) to schedule a meeting with our representatives. They’ll be happy to show you how our demo works and discuss how you can apply this use case in your business.

## Read more
---

- [Email campaigns](/docs/campaign/e-mail)
- [Predictions](/docs/ai-hub/predictions)
- [Segmentation](/docs/analytics/segmentations)
- [SMS campaigns](/docs/campaign/SMS)

