
Adding products to a favorites list is a great way for customers to keep track of items they're interested in. It's also a valuable marketing tool for businesses, as it can help promote items that are popular among customers. 

There are a few ways you can use favorites lists to your advantage. First, you can send alerts to your marketing team with the list of items most often added to favorites. This is a great way to keep the team updated and help them make decisions about future promotions, price changes, or increasing the number of those products in stock. You can also use favorites lists to promote products. For example, you can create a list of the most popular items added to favorites and use this to promote special offers or discounts. This is a great way to boost sales and encourage customers to take advantage of your products. Finally, you can use favorites lists to improve your customer service. By keeping track of items added to favorites, you can quickly identify any trends or issues. This can help you resolve problems more quickly and improve your overall customer service.

An alert can be sent via any channel, for example as an email, SMS or to an external tool such as Microsoft Teams or Slack. Additionally, the number of product or the frequency of sending the alert is fully configurable. You may also include products added to the basket, frequency of product visits/products added to cart, and so on.


This particular use case shows how to send an alert with 20 products most often added to favorites last week. 
This alert is sent once a week in the form of an email.

## Prerequisites 
---
- Implement a [custom event](https://developers.synerise.com/DataManagement/DataManagement.html#operation/CustomEvent) of adding products to favorites. Implement custom events in your [mobile application](/developers/mobile-sdk/event-tracking#product-added-to-cart) or [website](/developers/web/event-tracking#declarative-tracking-custom-events), 
In this use case, this event is named `product.addToFavorites`.
- Create a [segmentation](/docs/analytics/segmentations) of users who will be the recipients of this email alert. This segmentation will be used later in the [workflow](#create-a-workflow).
- Create a workspace [API Key](/docs/settings/tool/api) and assign the `ANALYTICS_BACKEND_REPORT_READ` permission which allows to [retrieve a summary of all reports in the workspace](https://developers.synerise.com/AnalyticsSuite/AnalyticsSuite.html#operation/previewAllGroupingsCSVPOST_v4).

## Process
---

In this use case, you will go through the following steps:
1. [Create a metric](/use-cases/report-add-to-favorites#create-a-metric) which counts the number of products added to favorites during last 7 days.
2. [Create a report](/use-cases/report-add-to-favorites#create-a-report) based on the metric created earlier.
3. [Create an email template](/use-cases/report-add-to-favorites#create-an-email-template) with the Jinjava insert which injects the report results from the last 7 days.
4. [Create a workflow](/use-cases/report-add-to-favorites#create-a-workflow) which sends the email alert every 7 days with the latest report results.

## Create a metric
---
In this part of the process, create a metric that calculates the number of all products added to favorites in the last 7 days.

1.  Go to <img src="/api/docs/image/54176ad07f146575310749eba44b7c2f42c1b327/icons/decision-hub-icon.svg" alt="Decision Hub icon" class="icon"> **Decision Hub > Metrics > New metric**.
2. Enter the name of the metric.
3. As a metric kind, select **Simple metric**.
4. As the metric type, select **Event**.
3. As the aggregator, set **Count**.
4. As the occurrence type, set **All**. 
5. From the **Choose event** dropdown list, select `product.addToFavorites`.
6. To select a specific time range, click the calendar icon. In our case it will be **last 7 days**. Confirm your choice with the **Apply** button.
7. Click **Save**.

<figure>
<img src="/api/docs/image/54176ad07f146575310749eba44b7c2f42c1b327/use-cases/all-cases/_gfx/addedtofav.png" alt="Metric settings"  class="WYBIERZ ROZMIAR:full">
<figcaption>Metric settings</figcaption>
</figure> 


## Create a report
---

In this part of the process, create a report to clearly show the list of 20 products which were added most frequently to favorites in last 7 days.

1. Go to <img src="/api/docs/image/54176ad07f146575310749eba44b7c2f42c1b327/icons/decision-hub-icon.svg" alt="Behavioral Data Hub icon" class="icon"> **Decision Hub > Report > New report**.
2. Enter the name of the report.
3. Select the metric you created in [the previous part of the process](/use-cases/report-add-to-favorites#create-a-metric).
4. From the **Range** dropdown list, select the number of top (the most frequently added to favorites) products to be shown in the preview of the report. In this case it will be **TOP 20** products.
5. In the **Dimension** section, from the dropdown list select **Events > Parameters**. To be able to show products name in the report, choose **name**.
6. Click **Add dimension**.
7. From the list, choose **sku**.

    
   <div class="admonition admonition-note"><div class="admonition-icon"><svg xmlns="http://www.w3.org/2000/svg" fill="none" viewBox="0 0 24 24" stroke="currentColor" stroke-width="2.5"><path stroke-linecap="round" stroke-linejoin="round" d="M13 16h-1v-4h-1m1-4h.01M21 12a9 9 0 11-18 0 9 9 0 0118 0z" /></svg></div><div class="admonition-body"><div class="admonition-content">

   In this particular use case, we use two dimensions: name and SKU. This way, we will receive the SKU and name of the products in the report. You can use any number of dimensions based on your business needs.

   </div></div></div>


6. In the date range, select the time that will be analyzed. In this case it will be **7 days**.
    
   <div class="admonition admonition-important"><div class="admonition-icon"><svg xmlns="http://www.w3.org/2000/svg" fill="none" viewBox="0 0 24 24" stroke="currentColor" stroke-width="2.5"><path stroke-linecap="round" stroke-linejoin="round" d="M12 8v4m0 4h.01M21 12a9 9 0 11-18 0 9 9 0 0118 0z" /></svg></div><div class="admonition-body"><div class="admonition-content">

   Select the same date range as you selected for the metric and the segmentation (if you used there date range).

   </div></div></div>

7. Save the report.
8. Click preview to see the results.

    <figure>
    <img src="/api/docs/image/54176ad07f146575310749eba44b7c2f42c1b327/use-cases/all-cases/_gfx/addedtofav1.png" alt="Report settings"  class="full">
    <figcaption>Report settings</figcaption>
    </figure> 

### Download the code of the report

To be able to use this report in the automation process, download the code using the developer console and save it in your notepad.
1. Go to **Decision Hub > Reports** and find the [report](/use-cases/report-add-to-favorites#create-a-report) created in the previous step.
2. Open the developer console in your browser: Click in the upper-right-hand corner (3 dots) of the browser window and select **More Tools > Developer Tools**.
3. Open the **Network** tab.
4. Open the preview of the report results.
5. In the console, in the filter box, paste `preview`. 
6. Click on the event which appeared on the list, choose the tab **Payload** and copy the code. 
7. Copy this code to the notepad. You will use it [in the next step](/use-cases/report-add-to-favorites#create-a-workflow).
   
    <figure>
    <img src="/api/docs/image/54176ad07f146575310749eba44b7c2f42c1b327/use-cases/all-cases/_gfx/addtofav6.png" alt="Downloading the code"  class="full">
    <figcaption>Developer tool settings</figcaption>
    </figure> 

## Create an email template
---
In this part of the process, create an email template with a Jinjava code which inserts the current results from the report created in the [previous part of the process](/use-cases/report-add-to-favorites#create-a-report).

1. Go to <img src="/api/docs/image/54176ad07f146575310749eba44b7c2f42c1b327/icons/experience-hub-icon.svg" alt="Image presents the Experience Hub icon" class="icon"> **Experience Hub > Email**.  
2. On the left pane, click **Templates**.  
3. Select the wizard:  
    - **Drag&drop builder** - use ready-made components to build an email template. 
    - **Code editor** - use HTML, CSS and JS to build an email template from scratch.
4. Build a template.  
5. Add the Jinjava code presented below. This code includes a context of the node from the [workflow](/developers/inserts/automation#context) you will create in the next part of the process. Thanks to this context, the latest results of the report will be injected to the email template.

    
   <details class="accordion"><summary>Check the Jinjava code</summary><div class="accordion-content"><pre><code class="language-jinjava">{% set raportParams = automationPathSteps['waitReport'].event.params %} {% set final = [] %} {% for item in raportParams["body.data[0].values[0]"] %} {% do final.append({ "name":item.name[0], "sku": item.value, }) %} {% endfor %} {% for item in final %} {{final.name}} - {{final.sku}} &lt;p&gt; {%endfor%}</code></pre></div></details>


6. Save the template.

## Create a workflow
---
In this part of the process, you will create the workflow which sends an email every 7 days with the current report results.

1. Go to <img src="/api/docs/image/54176ad07f146575310749eba44b7c2f42c1b327/icons/automation-hub-icon.svg" alt="Automation Hub icon" class="icon" > **Automation Hub > Workflows > New workflow**.  
2. Enter the name of the workflow.  

### Add the Audience node 

In this step you will create the audience who will get the report you have created.

1. Click **Add trigger**.
2. From the dropdown list, select **Audience**.  
3. Click the node.  
4. Set the **Run trigger** to repeatable. 
5. Define the frequency of launching the workflow (the **Interval** field) and when your workflow will be launched for the first time (the **Begin at** field).
4. In the **Define audience**, select the segmentation you created as a part of [prerequisites](/use-cases/report-add-to-favorites#prerequisites).
5. Click **Apply**.

<figure>
<img src="/api/docs/image/54176ad07f146575310749eba44b7c2f42c1b327/use-cases/all-cases/_gfx/addtofav3.png" alt="Audience node"  class="full">
<figcaption>Audience node settings</figcaption>
</figure> 

### Add the Outgoing Integration node

This webhook will be used to calculate the results of the report created in the [previous step](/use-cases/report-add-to-favorites#create-a-report). We use the method from [API documentation.](https://developers.synerise.com/AnalyticsSuite/AnalyticsSuite.html#operation/previewAllGroupingsCSVPOST_v4)

1. Select the **Custom webhook** tab. 
2. In the **Webhook name** field, enter `report.preview`.
3. Select the **POST** method.
4. Enter the endpoint.
4. Leave the **content-type** at default (`application / json`). 
5. In the request body, paste the payload of [the report you received in this part of the process](/use-cases/report-add-to-favorites#create-a-report).

   
   <details class="accordion"><summary>Check the examplary JSON body of the report</summary><div class="accordion-content"><pre><code class="language-json">
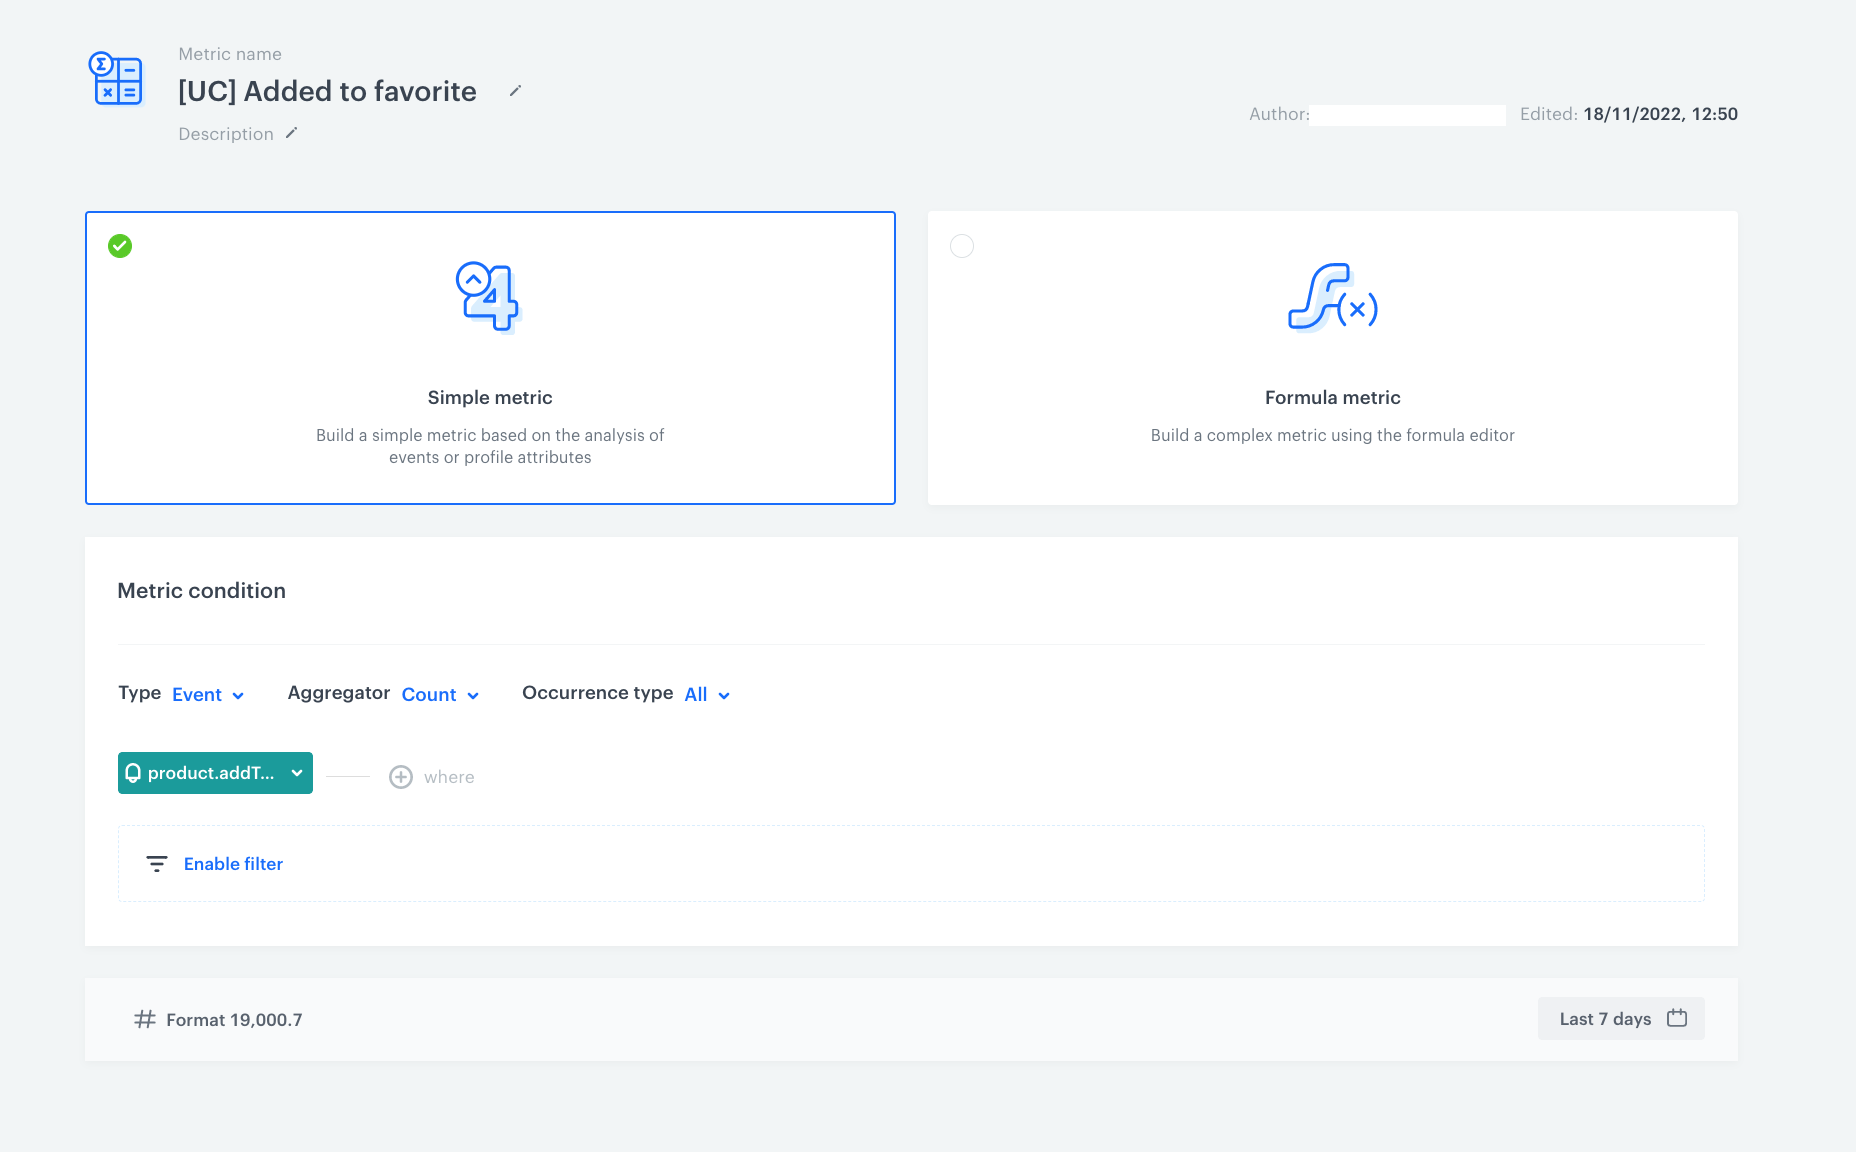
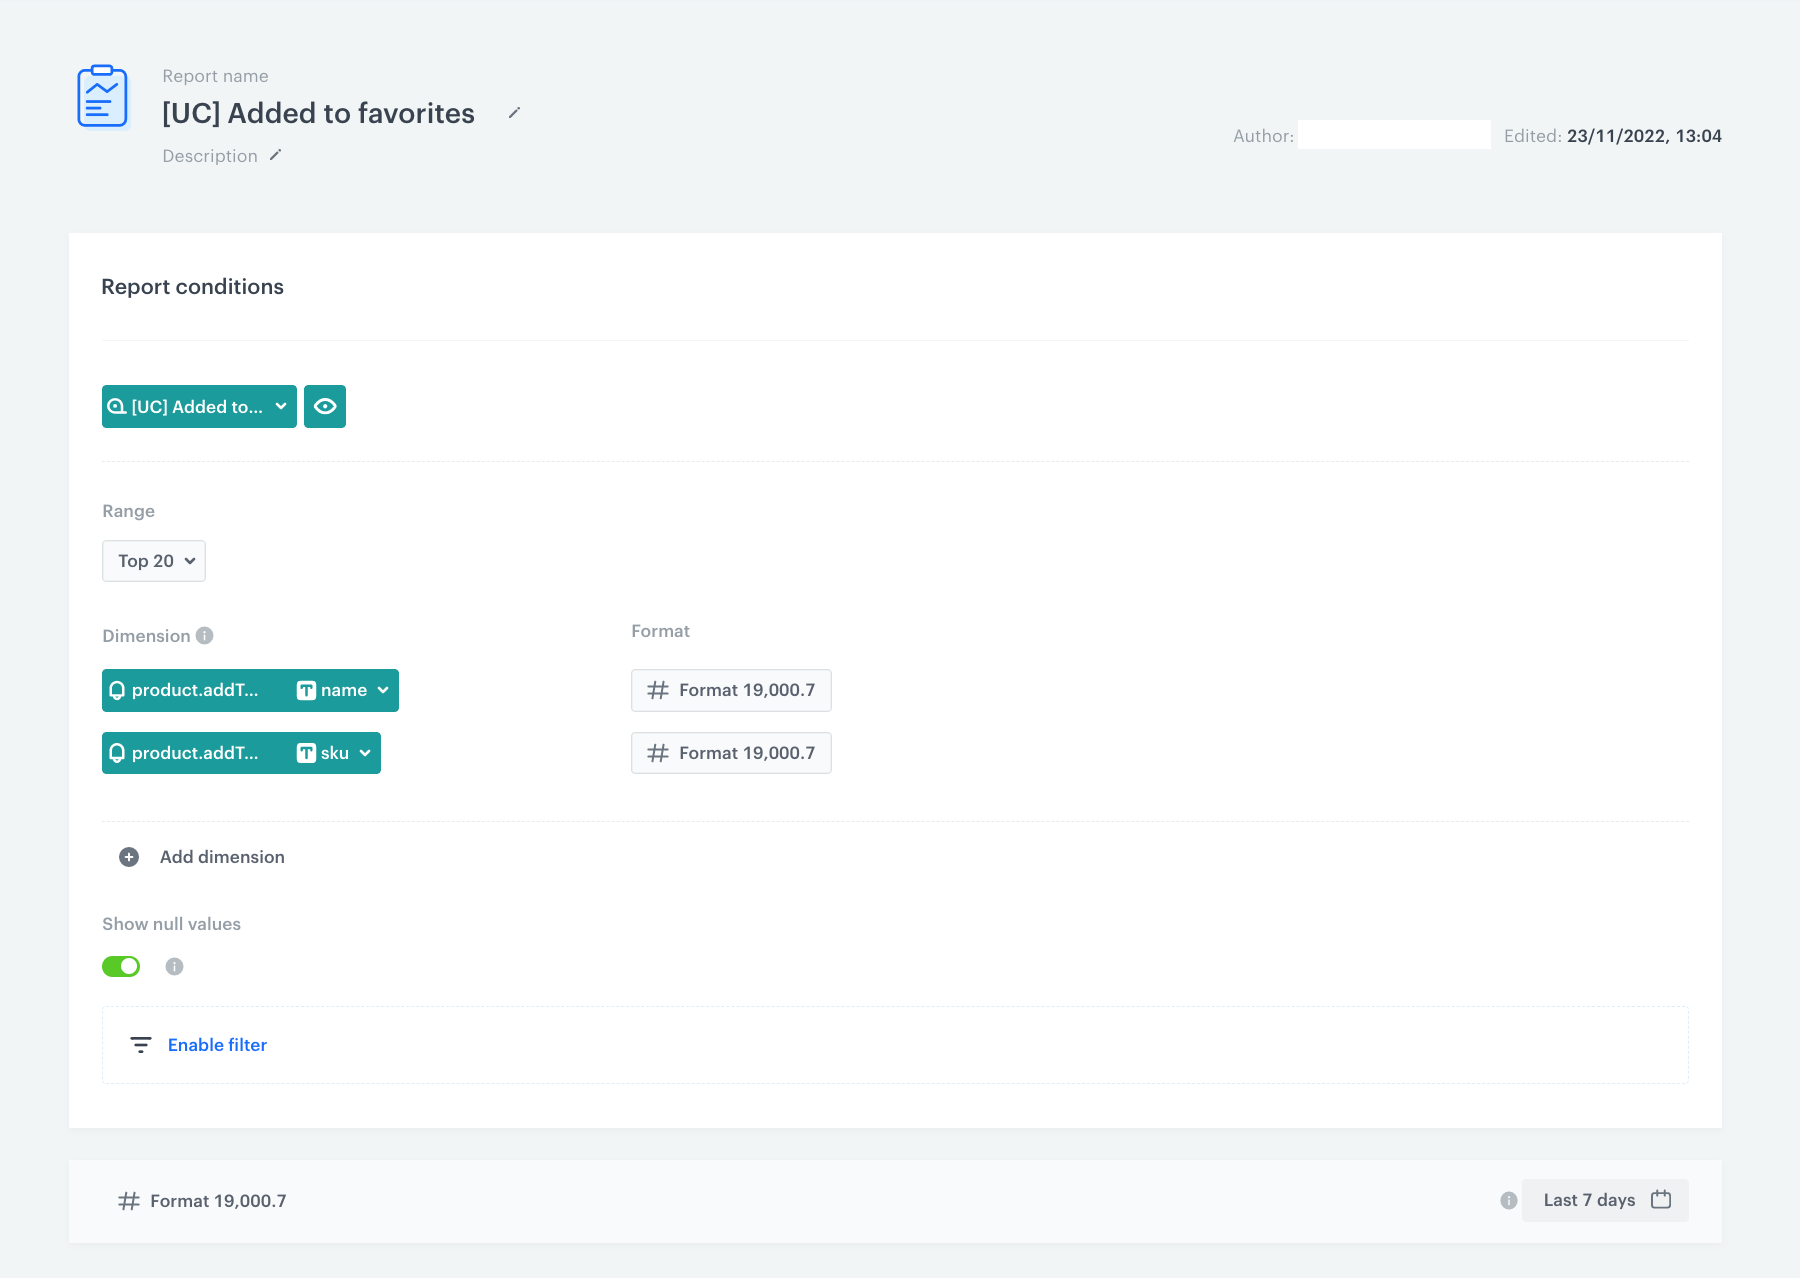
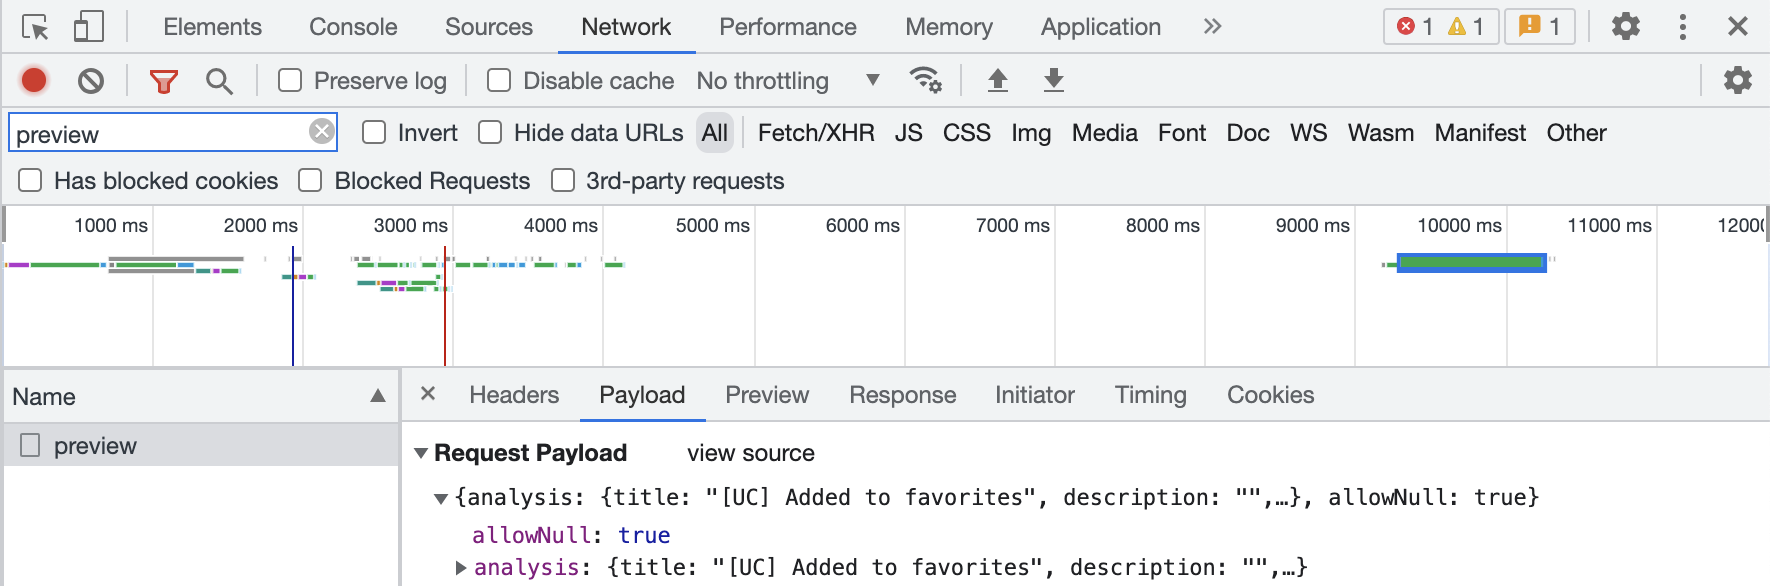
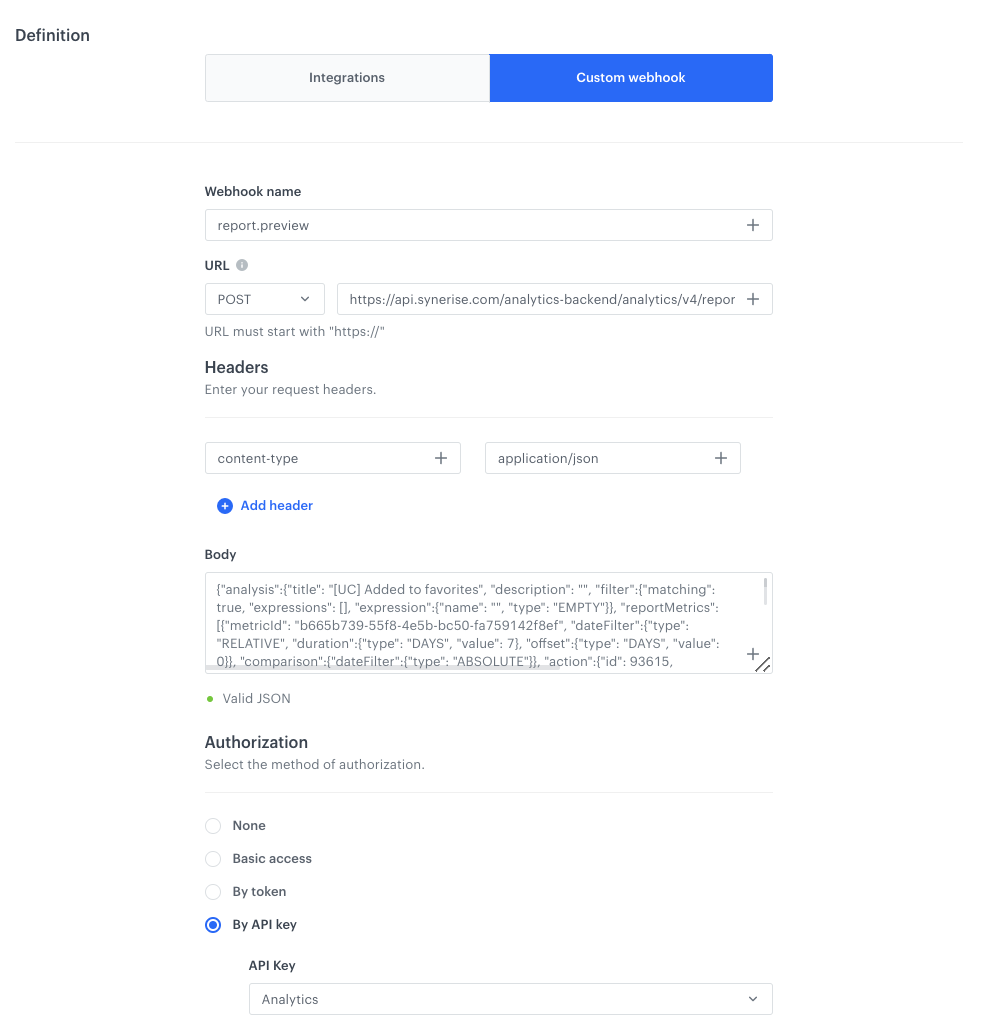
{"analysis": {"title": "[UC] Added to favorites", "description": "", "filter":{"matching": true, "expressions": [], "expression":{"name": "", "type": "EMPTY"}}, "reportMetrics": [{"metricId": "b665b739-55f8-4e5b-bc50-fa759142f8ef", "dateFilter":{"type": "RELATIVE", "duration":{"type": "DAYS", "value": 7}, "offset":{"type": "DAYS", "value": 0}}, "comparison":{"dateFilter":{"type": "ABSOLUTE"}}, "action":{"id": 93615, "name": ""}, "format":{"dataFormat": "numeric", "useSeparator": true, "compactNumbers": false, "fixedLength": 1}, "grouping":{"type": "TOP", "top": 20}, "groups": [{"title": "name", "type": "EVENT", "format":{"dataFormat": "numeric", "useSeparator": true, "compactNumbers": false, "fixedLength": 1}, "attribute":{"type": "PARAM", "param": "name"}},{"title": "product.addToFavorite sku", "type": "CLIENT", "format":{"dataFormat": "numeric", "useSeparator": true, "compactNumbers": false, "fixedLength": 1}, "attribute":{"type": "AGGREGATE", "id":"db965f80-1be4-3adb-9568-2282df80e9c8", "uuid":"db965f80-1be4-3adb-9568-2282df80e9c8"}}]}]}, "allowNull": true}</code></pre></div></details>


7. Select the method of authorization as **by API key**.
8. From the dropdown list, select the API key you created as a [part of prerequisites](#prerequisites).
7. Click **Apply**.

<figure>
<img src="/api/docs/image/54176ad07f146575310749eba44b7c2f42c1b327/use-cases/all-cases/_gfx/addtofav4.png" alt="Webhook settings"  class="WYBIERZ ROZMIAR:full">
<figcaption>Webhook settings</figcaption>
</figure> 

### Define the Event Filter node
---
This node will let you get the report results from the last 7 days. Based on that, you will be able to add it to the email. 

1. As the next node, add **Event Filter**. In the configuration of the node: 
    1. As the name of the node, enter `waitReport`. It is important to add it, as the Jinjava code in the email template contains a reference to the name of this node (`{% set raportParams = automationPathSteps['waitReport'].event.params %}`).
    2. Set the **Check** option to **for period of time**.
    2. Set the time range. In our case, it is **10 minutes**.
    3. In the **Define conditions** section, from the **Choose event** dropdown menu, choose `webhook.response` event.
    4. From **Choose parameter** dropdown menu, choose **name**.    
    5. From the **Choose operator** dropdown, choose **String**, and then select **Equal**.
    6. In the next field, type the `report.preview`.
    7. Click the + where button and from **Choose parameter** dropdown menu, choose **status**.    
    5. From the **Choose operator** dropdown, choose **Number**, and then select **Equal**.
    6. In the next field, type the `200`.
4. Confirm by clicking **Apply**.

<figure>
<img src="/api/docs/image/54176ad07f146575310749eba44b7c2f42c1b327/use-cases/all-cases/_gfx/addtofav5.png" alt="Event Filter node settings"  class="full">
<figcaption>Event Filter node settings</figcaption>
</figure> 

### Configure the Send Email node
---
In this part of the process, the workflow sends an email which contains the report with 20 products most frequently added to favorites during last 7 days.

1. For the **Matched** path, add the **Send Email** node.
2. In the settings of the node:  
    1. Define the settings of the **Sender details** section.
    2. In the **Content** section, enter the subject of the email and select the template you [prepared in the previous part of the process](/use-cases/report-add-to-favorites#create-an-email-template).
    3. Optionally, define the settings in the [UTM & URL parameters](/docs/campaign/e-mail/creating-email-campaigns#define-utm-and-url-parameters) and [Additional parameters](/docs/campaign/e-mail/creating-email-campaigns#adding-custom-parameters) sections.
2. Click **Apply**.

### Prepare the final settings 
---

1. After **Send Email**, add the **End** node as well as to the **Not matched** path.
2. Optionally, define capping.
3. Optionally, add titles to each node so the workflow will be more understandable to your colleagues.
4. Activate the workflow by clicking **Save & Run**.

<figure>
<img src="/api/docs/image/54176ad07f146575310749eba44b7c2f42c1b327/use-cases/all-cases/_gfx/addtofav2.png" alt="Workflow settings"  class="full">
<figcaption>Workflow settings</figcaption>
</figure> 


## What's next
---

Information from this report might be used in the following campaigns: 
- Special promotions for products most frequently added to favorites
- Price regulations


## Check the use case set up on the Synerise Demo workspace
---
You can check the [metric](https://app.synerise.com/analytics/metrics/b665b739-55f8-4e5b-bc50-fa759142f8ef), [report](https://app.synerise.com/analytics/reports/58ef5a60-6632-4742-b89b-53aa051e087b) and [workflow configuration](https://app.synerise.com/automations/automation-diagram/54f79939-473f-4324-9aef-0feb76d82f9b) directly in Synerise Demo workspace. 

If you’re our partner or client, you already have automatic access to the **Synerise Demo workspace (1590)**, where you can explore all the configured elements of this use case and copy them to your workspace.  

If you’re not a partner or client yet, we encourage you to fill out the contact [form](https://demo.synerise.com/request) to schedule a meeting with our representatives. They’ll be happy to show you how our demo works and discuss how you can apply this use case in your business. 

## Read more
---

- [Automation Hub](/docs/automation)
- [Email campaigns](/docs/campaign/e-mail)
- [Metrics](/docs/analytics/metrics)
- [Reports](/docs/analytics/reports)


