Synerise allows you to create a report of the most frequently clicked links in an email campaign. To display links without UTM parameters, create an expression that formula sets the logic of displaying links.
## Prerequisites
---
- Make sure the links in the email templates contain the [tracking parameters](/developers/inserts/email#adding-utm-and-tracking-parameters-to-links).
## Process
---
In this use case, you will go through the following steps:
1. [Create a metric](/use-cases/report-with-neat-links#create-a-metric) that calculates the occurrences of the `newsletter.click` event.
2. [Create an expression](/use-cases/report-with-neat-links#create-an-expression) that will be available as a variable when including the `newsletter.click` event in analytics.
3. [Create a report](/use-cases/report-with-neat-links#create-a-report).
## Create a metric
---
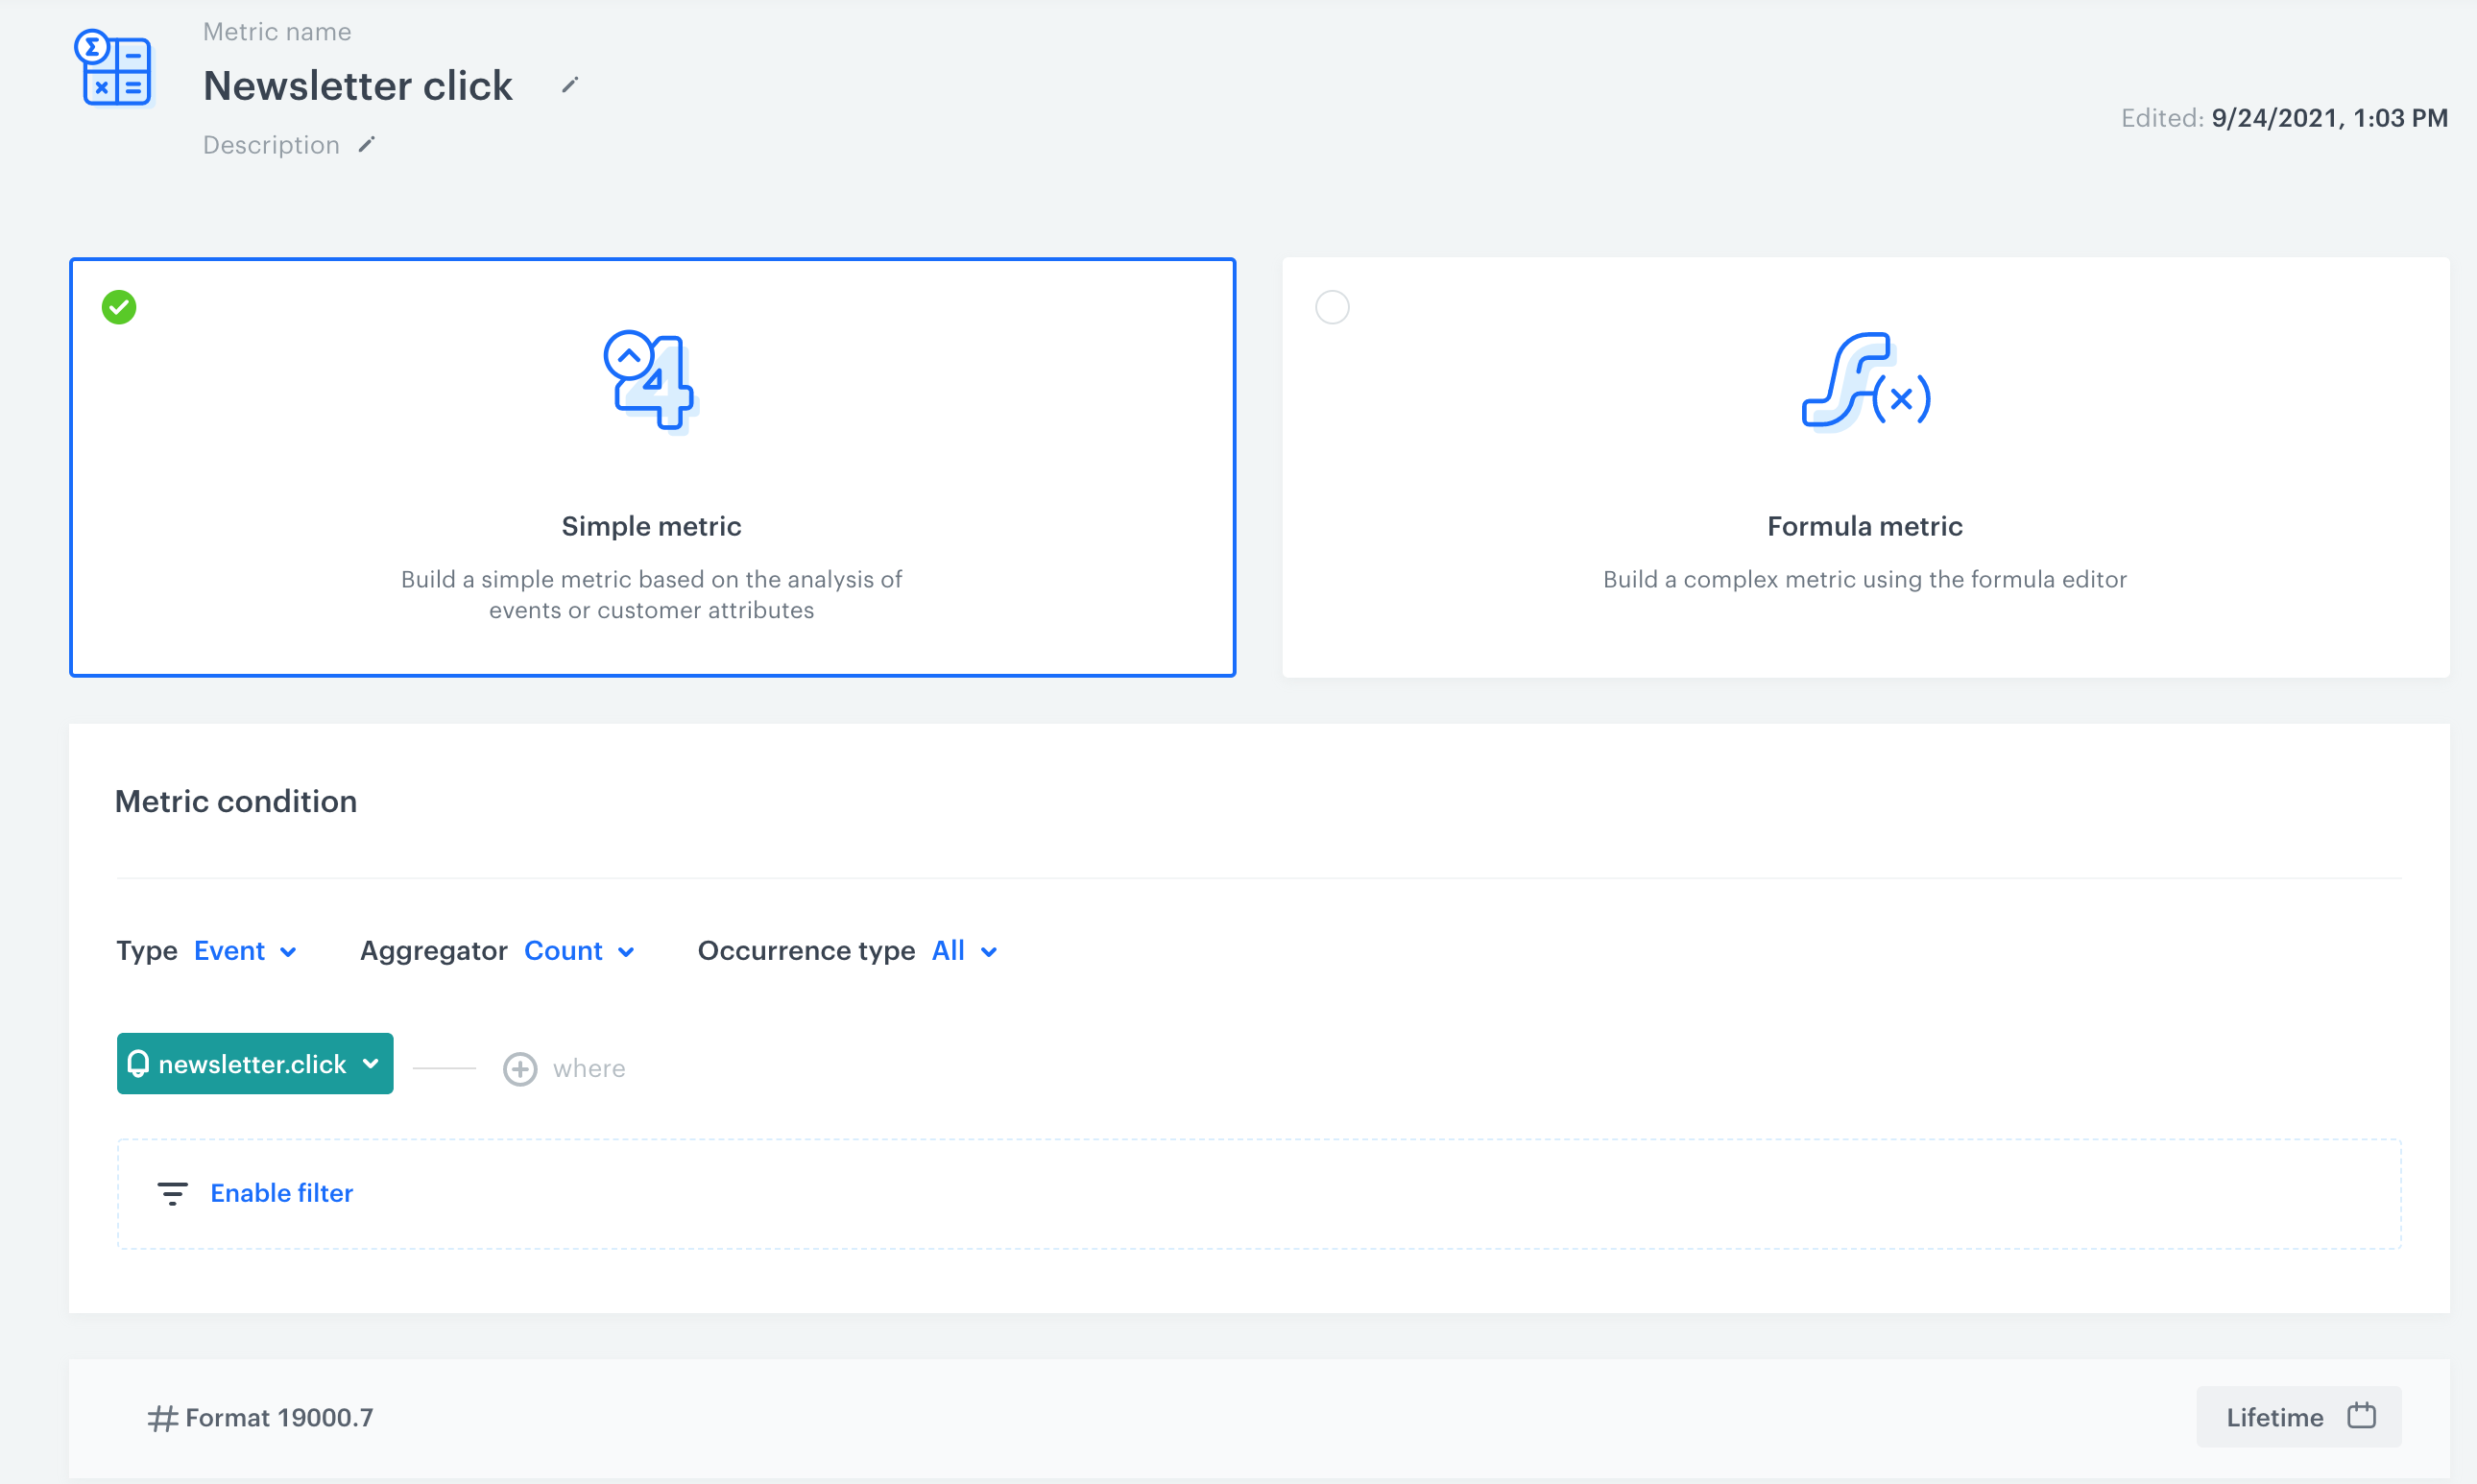
As the first part of the process, create a metric that calculates the occurrences of the `newsletter.click` event.
1. Go to **Decision Hub > Metrics > New metric**.
2. Enter the name of the metric.
3. Leave the metric kind at default (**Simple metric**).
4. As **Aggregator**, select **Count**.
5. Leave **Event** and **Occurrence type** at default.
6. From the **Choose event** dropdown list, select **newsletter.click**.
7. As the date range, select **Lifetime**.
8. Click **Save**.
Formula of the metric
## Create an expression
---
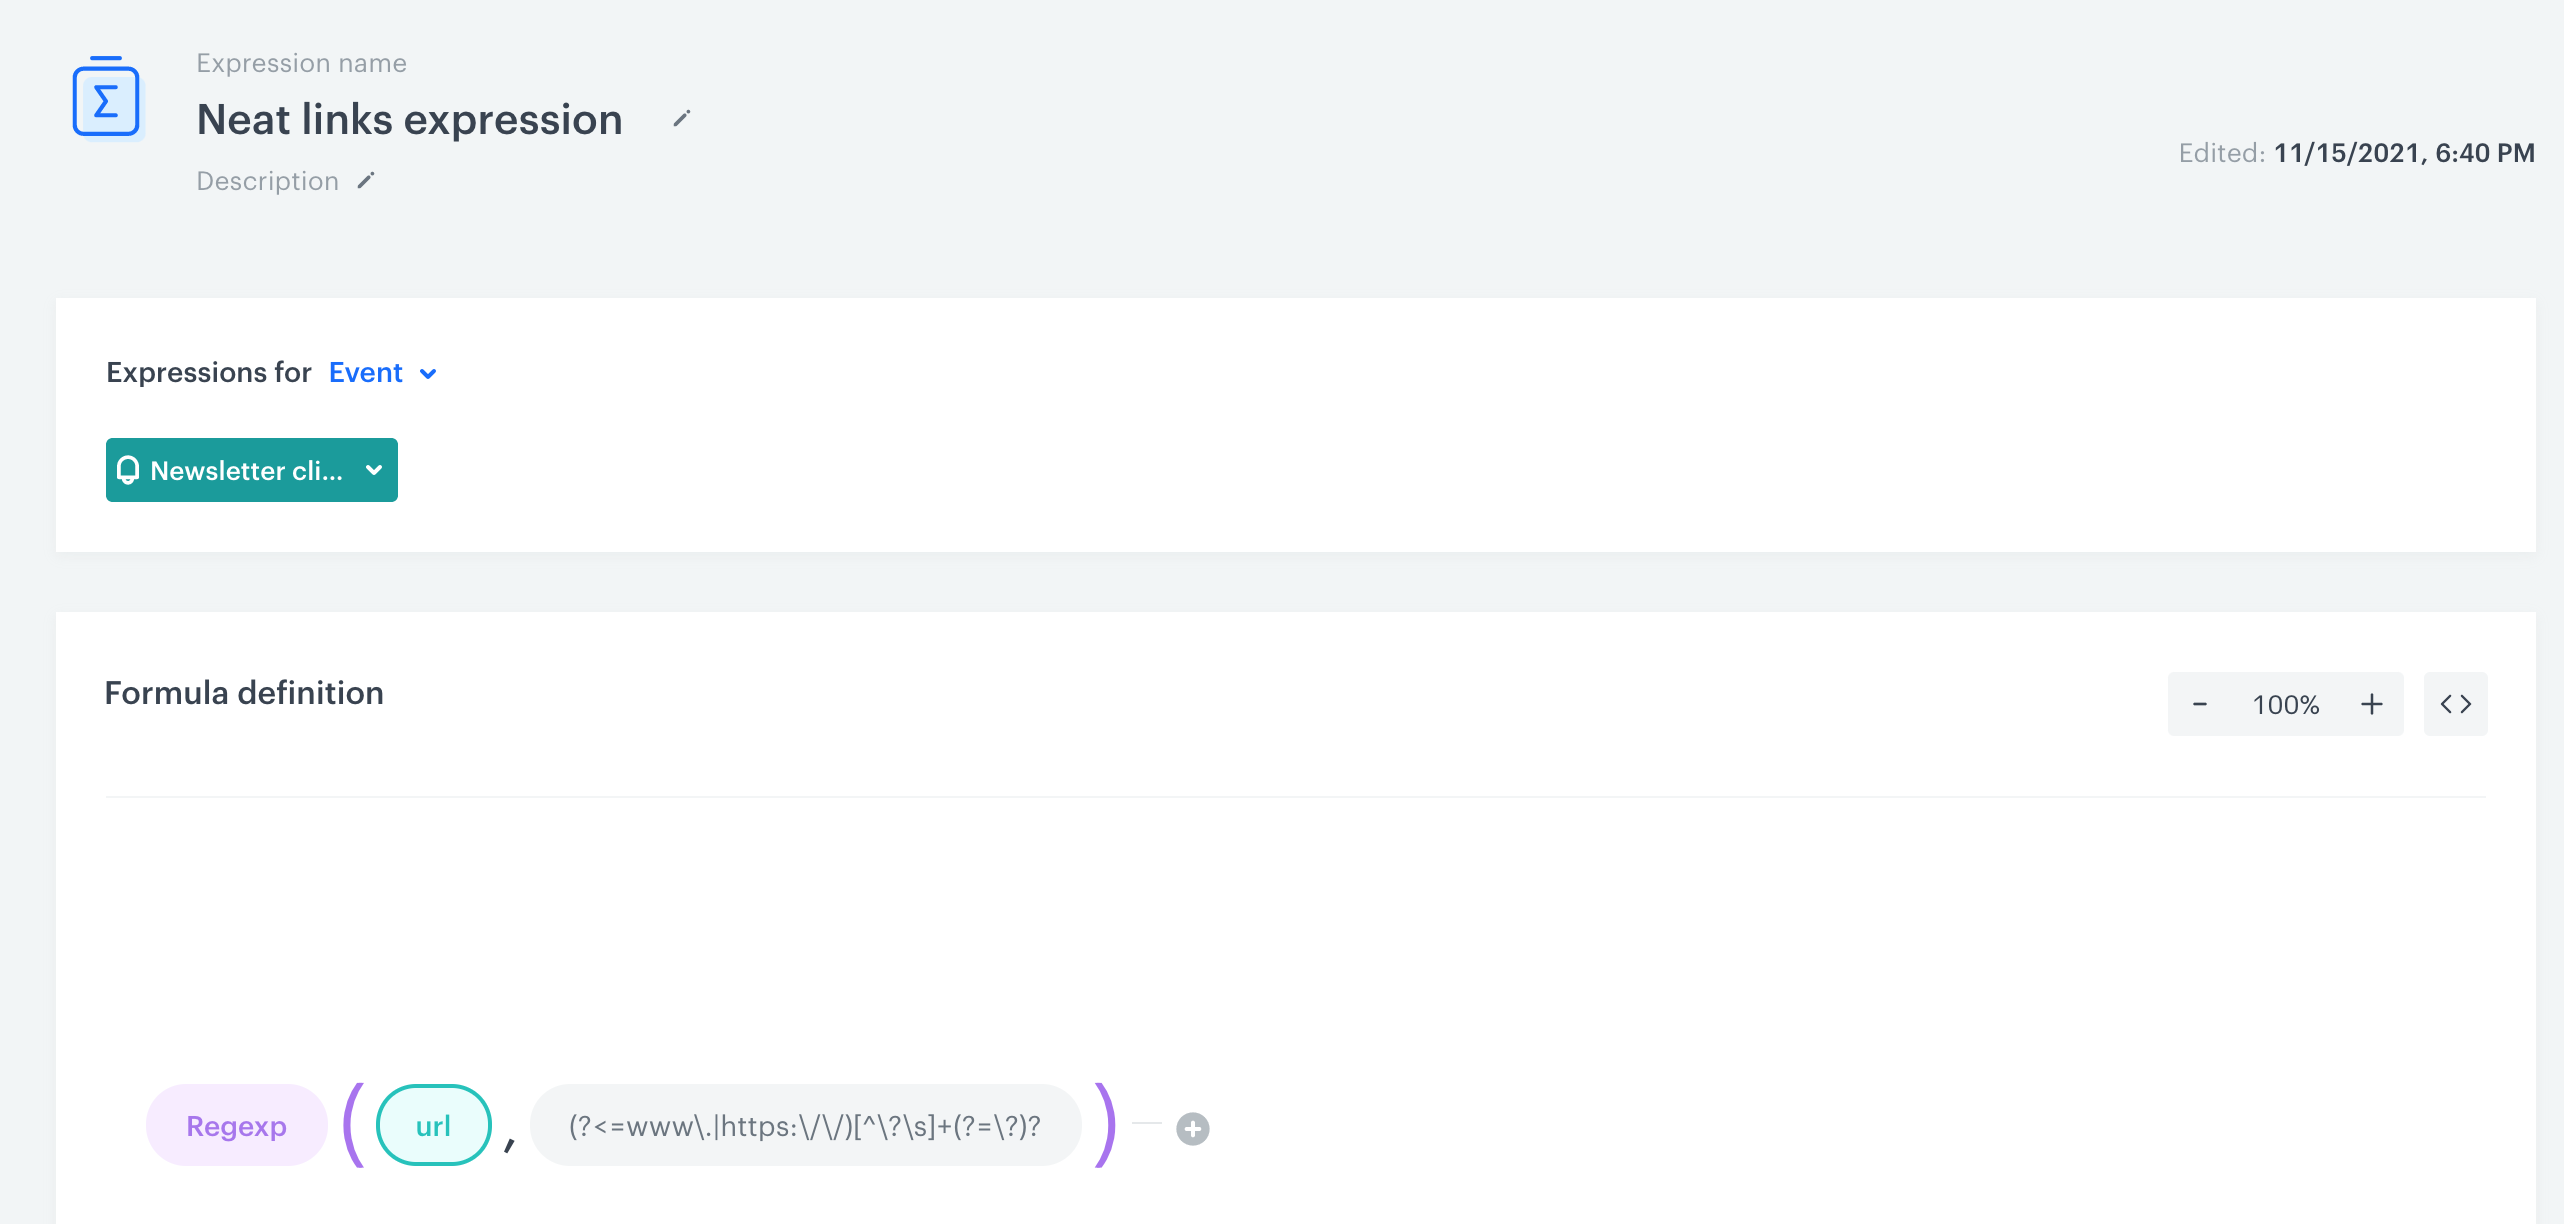
In this part of the process, create an expression that will be available as a variable when including the `newsletter.click` event in analytics. The formula of the expression contains the regular expression for the URL parameter of the `newsletter.click` event. As a result, the expression removes UTM parameters from the link.
1. Go to **Behavioral Data Hub > Expression > New expression**.
2. Enter the name of the expression.
3. Set the **Expression for** option to **Event**.
4. From the dropdown list, select **newsletter.click**.
5. Build the formula of the expression:
1. On the dashboard, click **Select**.
2. From the dropdown list, select **Function > Regexp**.
3. In the left **Select** field, select **Event attribute**.
4. From the dropdown list, select **url**.
5. In the right dropdown list, select **Constant**.
6. Enter the following formula: `(?<=www\.|https:\/\/)[^\?\s]+(?=\?)?`
Formula of the expression
6. Save the expression.
## Create a report
---
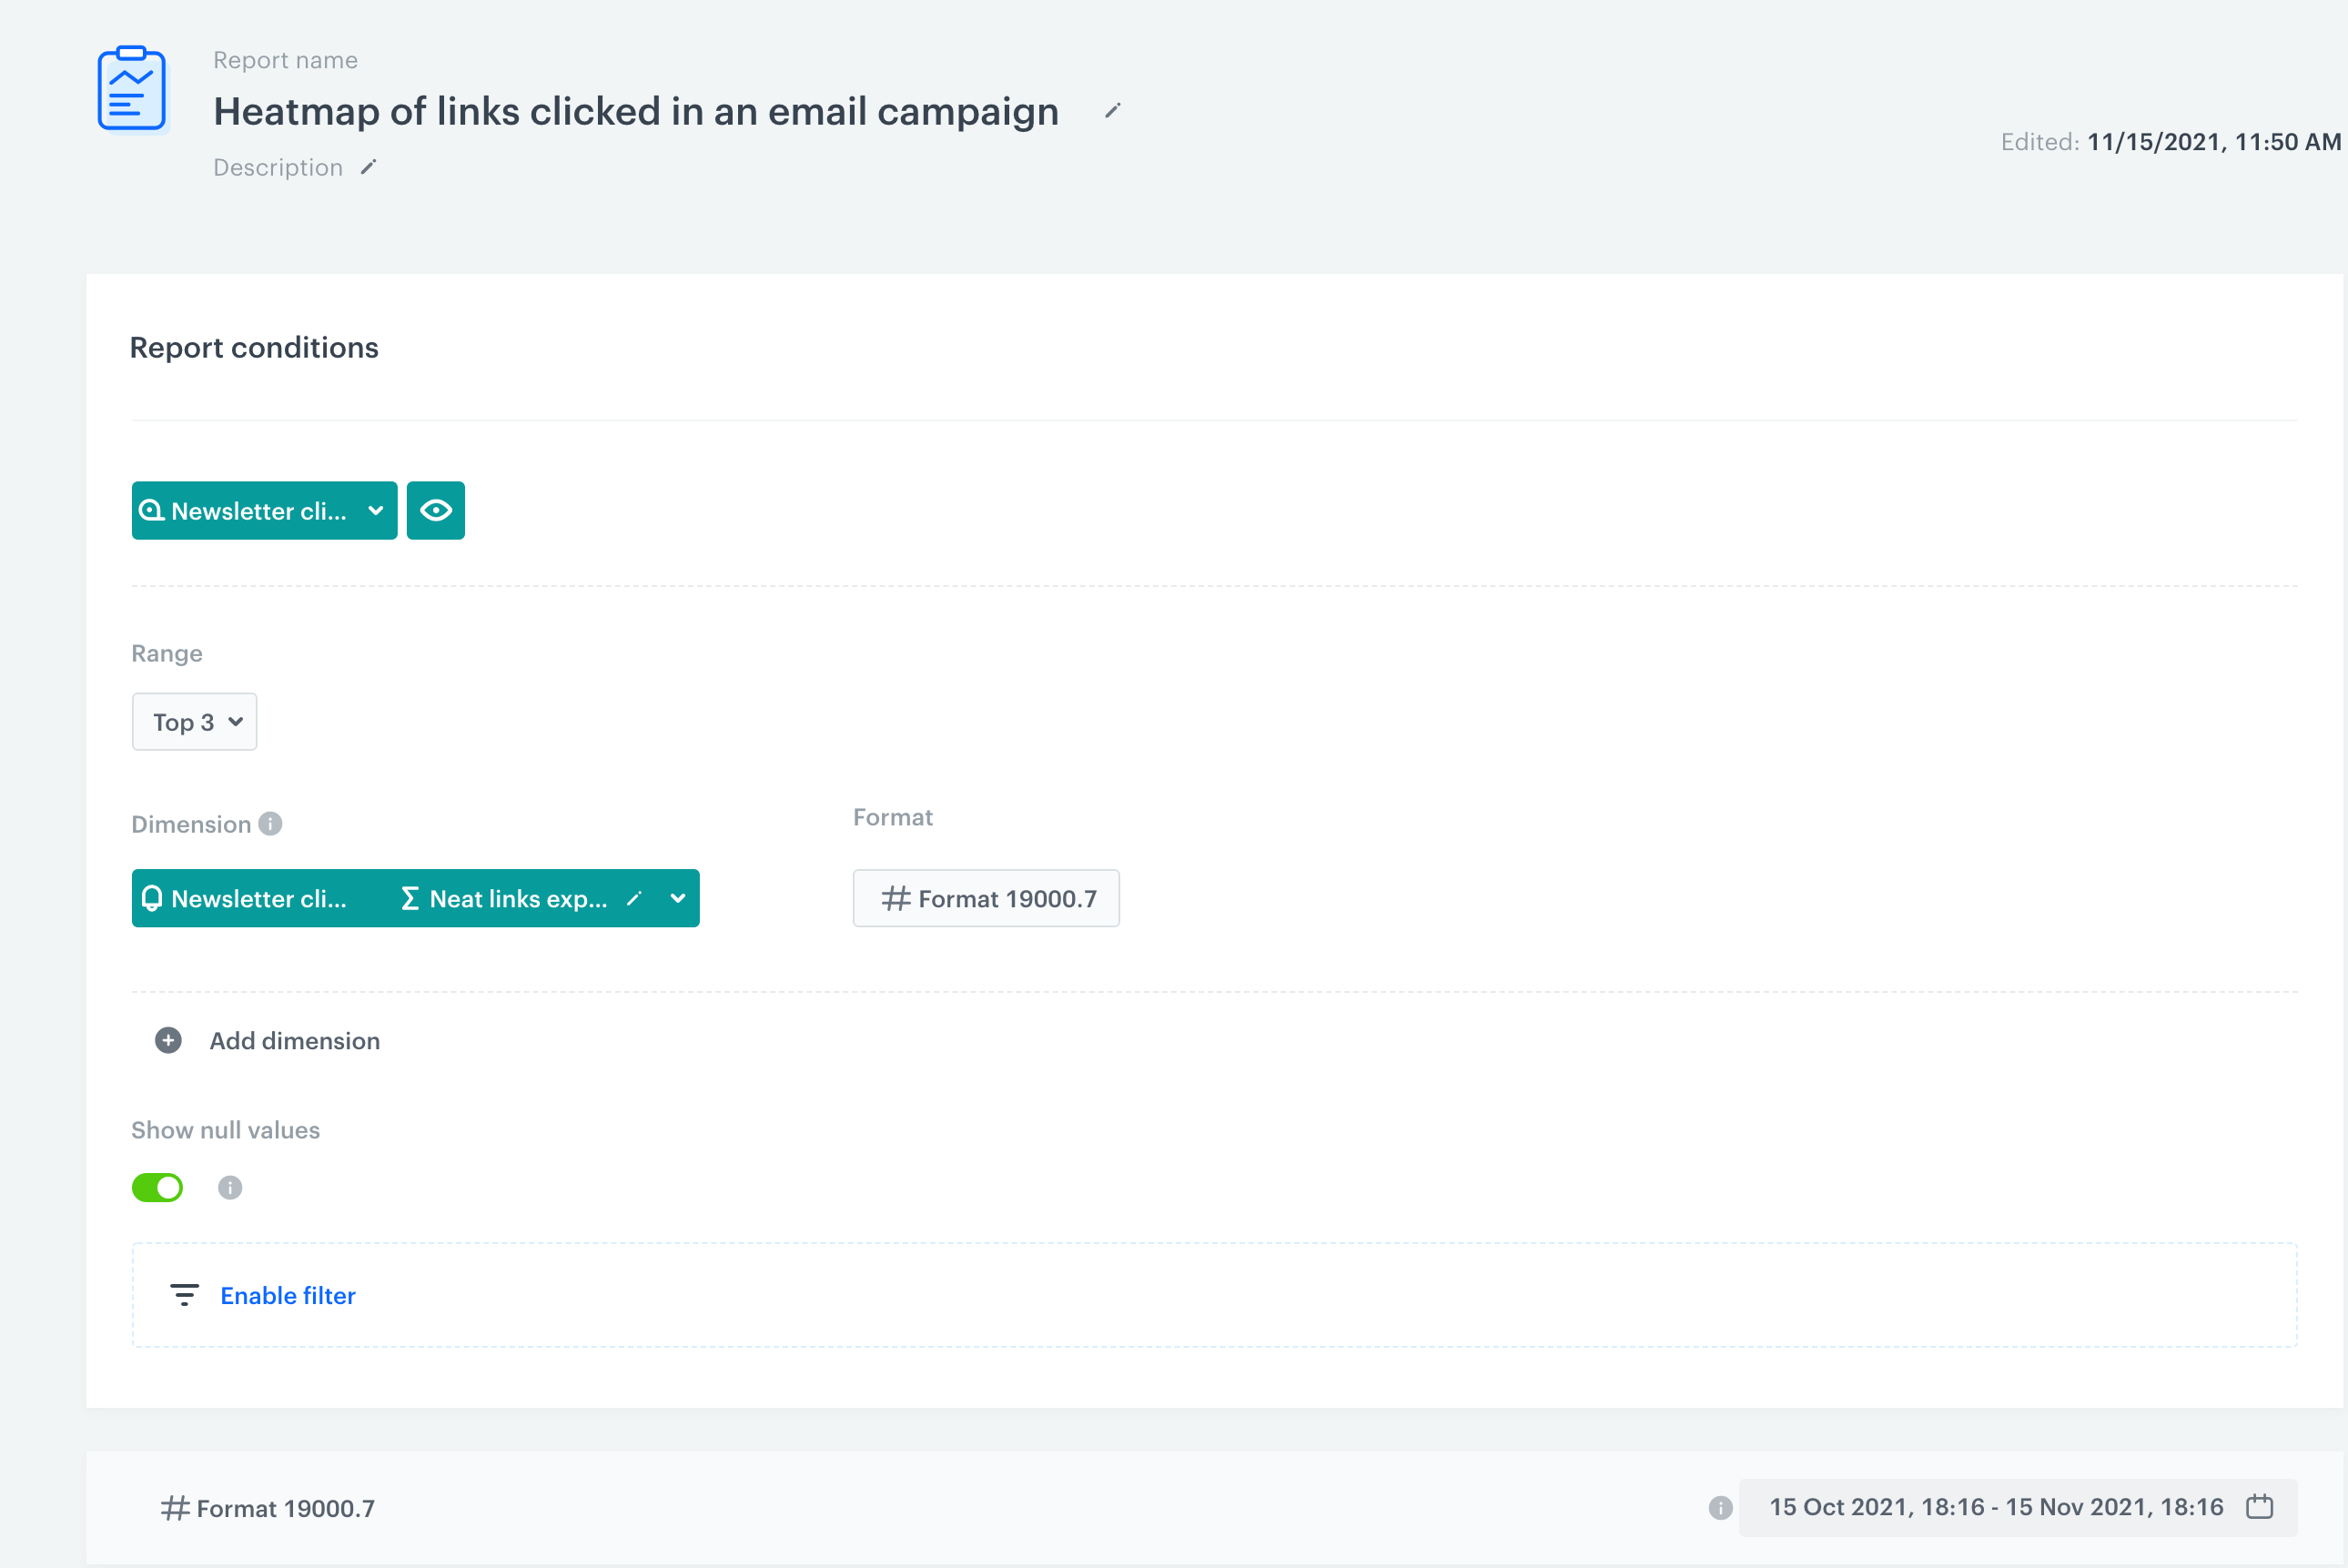
In this part of the process, create a report based on the metric and expression you prepared before. The result of the report is a table with the top/last links clicked in email campaigns and the number of clicks for each link.
1. Go to **Decision Hub > Reports > New report**.
2. Enter the name of the report.
3. Select the metric you created in this [part](/use-cases/report-with-neat-links#create-a-metric) of the process.
4. From the **Range** dropdown list, select the number of top (the most frequently clicked) or last (the least frequently clicked) results to be shown in the preview of the report.
5. In the **Dimension** section, select the expression you created in [this part](/use-cases/report-with-neat-links#create-an-expression) of the process.
6. In the date range, select the time that will be analyzed.
Configuration of the report
7. Save the report.
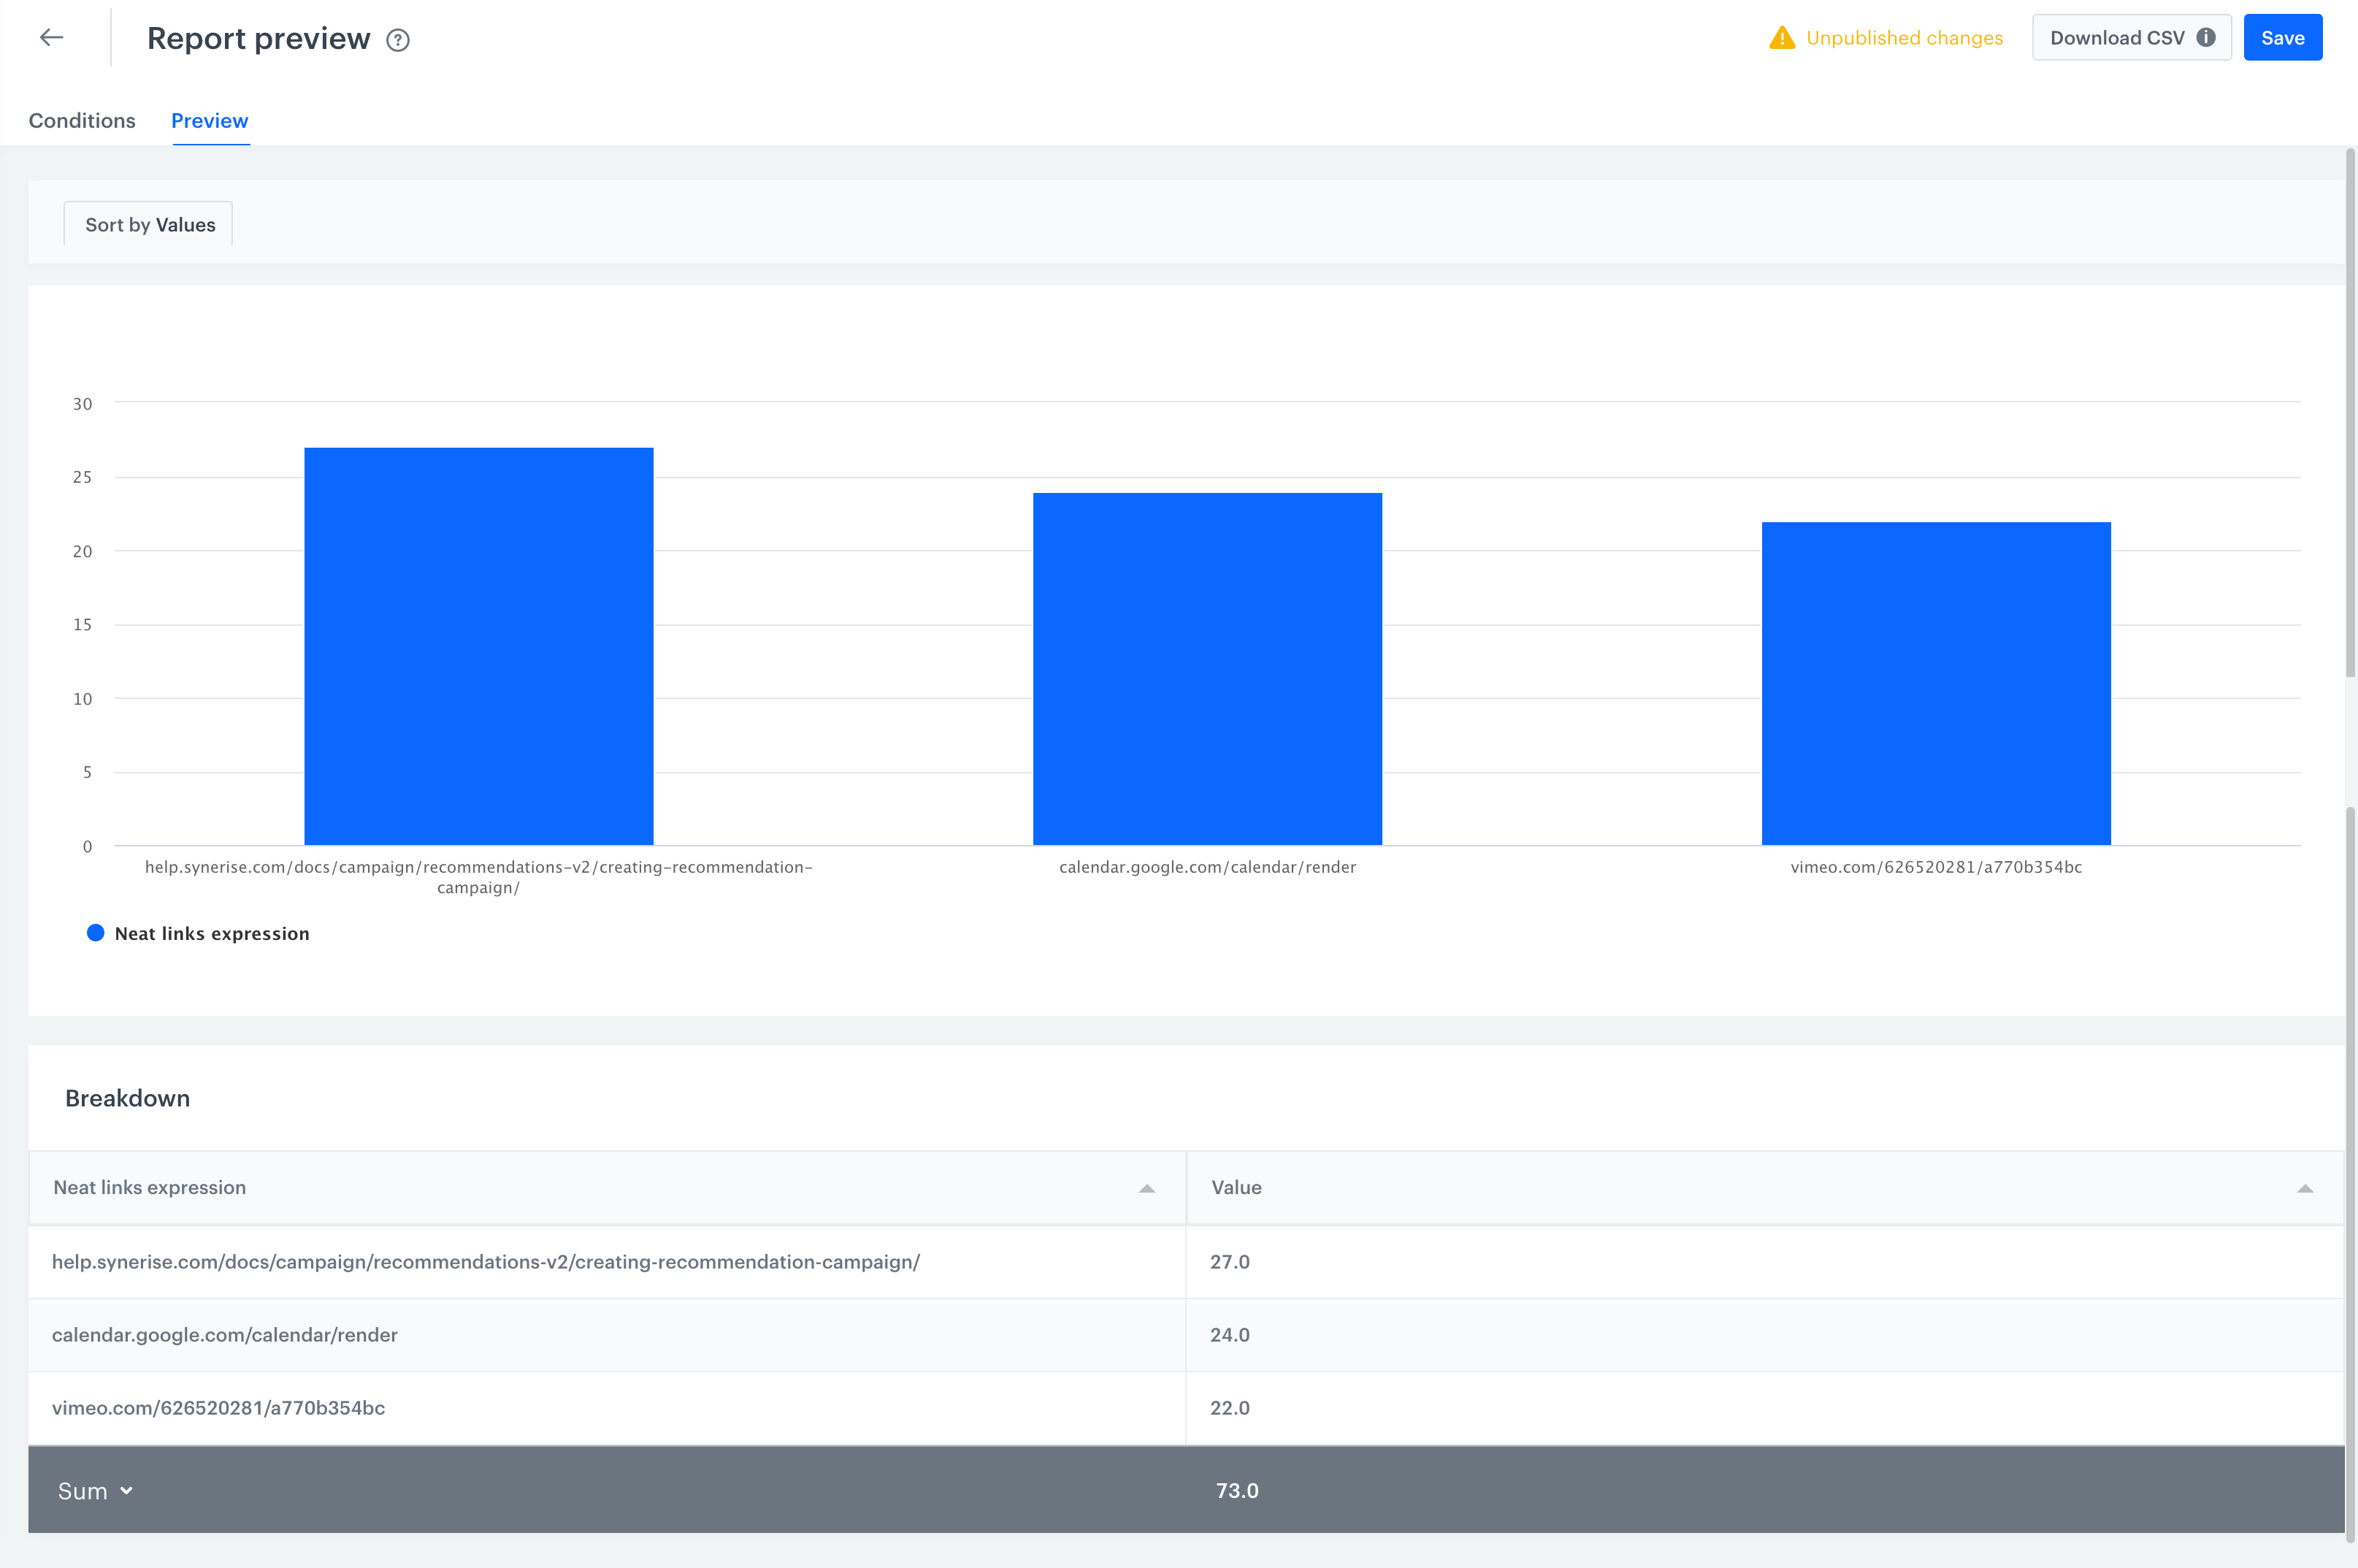
8. Click **Preview** to see the results.
Report presents the top 3 clicked links and the number of clicks in the links
## Check the use case set up on the Synerise Demo workspace
---
You can check the analyses created in this use case in our Synerise Demo workspace:
- [Metric that returns the number of clicked links in emails](https://app.synerise.com/analytics/metrics/61110a06-af76-4227-a6bf-d7ab5238a176).
- [Expression that returns a neat link](https://app.synerise.com/analytics/expressions/8a3b2f05-4972-47ef-a03c-04670a55bbb8).
- [Report with a heatmap of links clicked in an email](https://app.synerise.com/analytics/reports/f5a529c4-2d37-49f2-bfbb-2f4dc0c1e232).
If you’re our partner or client, you already have automatic access to the **Synerise Demo workspace (1590)**, where you can explore all the configured elements of this use case and copy them to your workspace.
If you’re not a partner or client yet, we encourage you to fill out the contact [form](https://demo.synerise.com/request) to schedule a meeting with our representatives. They’ll be happy to show you how our demo works and discuss how you can apply this use case in your business.
## Read more
---
- [Expressions](/docs/analytics/expressions)
- [Metrics](/docs/analytics/metrics)
- [Reports](/docs/analytics/reports)