Tracking top purchased products for each store offers a valuable way to understand customer behavior and optimize product exposure. This use case shows how to generate daily reports that calculate and display the 10 best-selling products for every individual store (represented as profiles in the CRM), based on transaction data.
The report is created dynamically and filtered with flexible business rules. Once generated, these results can be used for many purposes, for example:
– you might send the top products to an external tool and display them as personalized banners in a given store or use them in targeted campaigns.
- top-product reports can be used to adjust local inventory planning.
- items that perform well in a particular store can be positioned more prominently.
- you can create discounts offers based on each store's top performers.
Knowing what sells best in each store gives you an edge – not just for backend analytics, but for improving the customer journey. You can highlight bestsellers on local pages, power in-store digital signage, or inform stock planning. It enables better personalization and relevance across channels and improves business responsiveness to customer demand in specific locations.
This specific use case was used by our customer to present top 10 products per store in digital signage in offline stores. Displaying top-performing products on screens inside the store draws customer attention to popular items, reinforces social proof, and can drive impulse purchases.
Prerequisites
- Implement a tracking code.
- Implement the transaction events. Your transactions must be properly tracked and include identifiers of the shop (
StoreId) to enable product-level reporting. - Stores must be created as individual profiles in the CRM. Every store profile must include a
StoreIdparameter – this should be a unique identifier for each store. It is required to group transaction data and generate reports per store. Additionally we assign profile tags to all stores (in our case,store-top-products) to make it easier to find and extract them. To correctly identify the store in the system:- Add a
custom_identifyfield to the store’s profile with the same value asStoreId. In the Synerise platform, this will appear as Custom identifier. - You can use Jinjava that references a store through the
custom_identifyparameter (for example, when sending events through an outgoing integration). This setup ensures consistent and reliable store identification across processes.
- Add a
- Create a workspace API Key and assign the following permissions:
ANALYTICS_BACKEND_REPORT_READ- it lets you retrieve a summary of all reports in the workspace. Make sure the API Key used for sending events has the necessary event send permissions enabled.API_BATCH_EVENTS_CREATE
Process
In this use case, you will go through the following steps:
- Create a metric which counts the number of transactions for each store. Thanks to setting a dynamic key, in the following steps we will be able to properly filter events within a given store.
- Create a report based on the metric created earlier, which lists the top 10 purchased products per store.
- Create a workflow that dynamically refers to the report, retrieves the top 10 products for each store based on defined business conditions (e.g., availability), and generates an event for each top product on the profile card of each store.
- Create a final metric based on events generated in the workflow.
- Create final report based on the metric whose conditions are built on the events generated in the workflow.
Create a metric
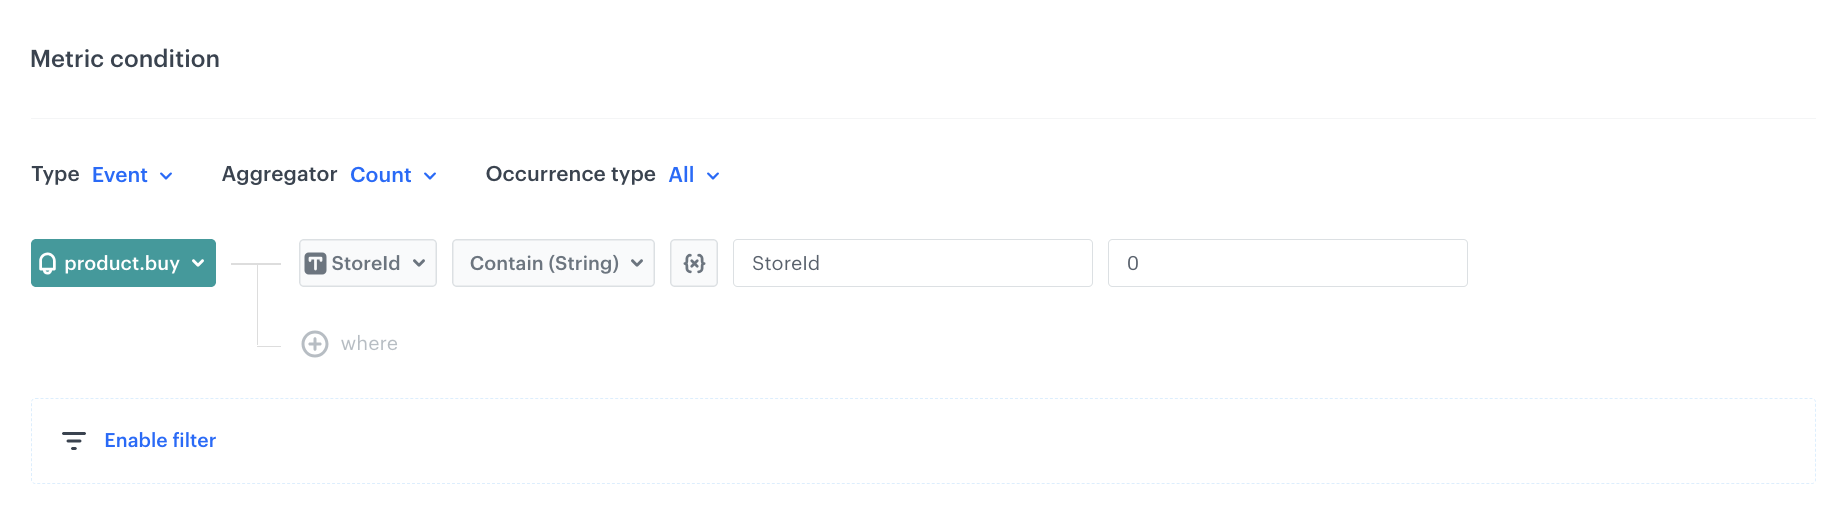
In this part of the process, create a metric which counts the number of transactions for each individual store.
- Go to
 Decision Hub > Metrics > New metric.
 - Enter the name of the metric.
- As a metric kind, select Simple metric.
- As the metric type, select Event.
- As the aggregator, set Count.
- As the occurrence type, set All.
- From the Choose event dropdown list, select
product.buy. - Click + where button and from the dropdown list, choose
StoreIdparameter. - From the Choose operator dropdown, select Contain (String).
- Click the icon next to the Equal operator two times to find dynamic key icon

- In the first box add
StoreIdand in the second add any value (in our case it might be0). - Define the period from which the metric will return products from the event as 7 days.
- Click Save.
Create a report
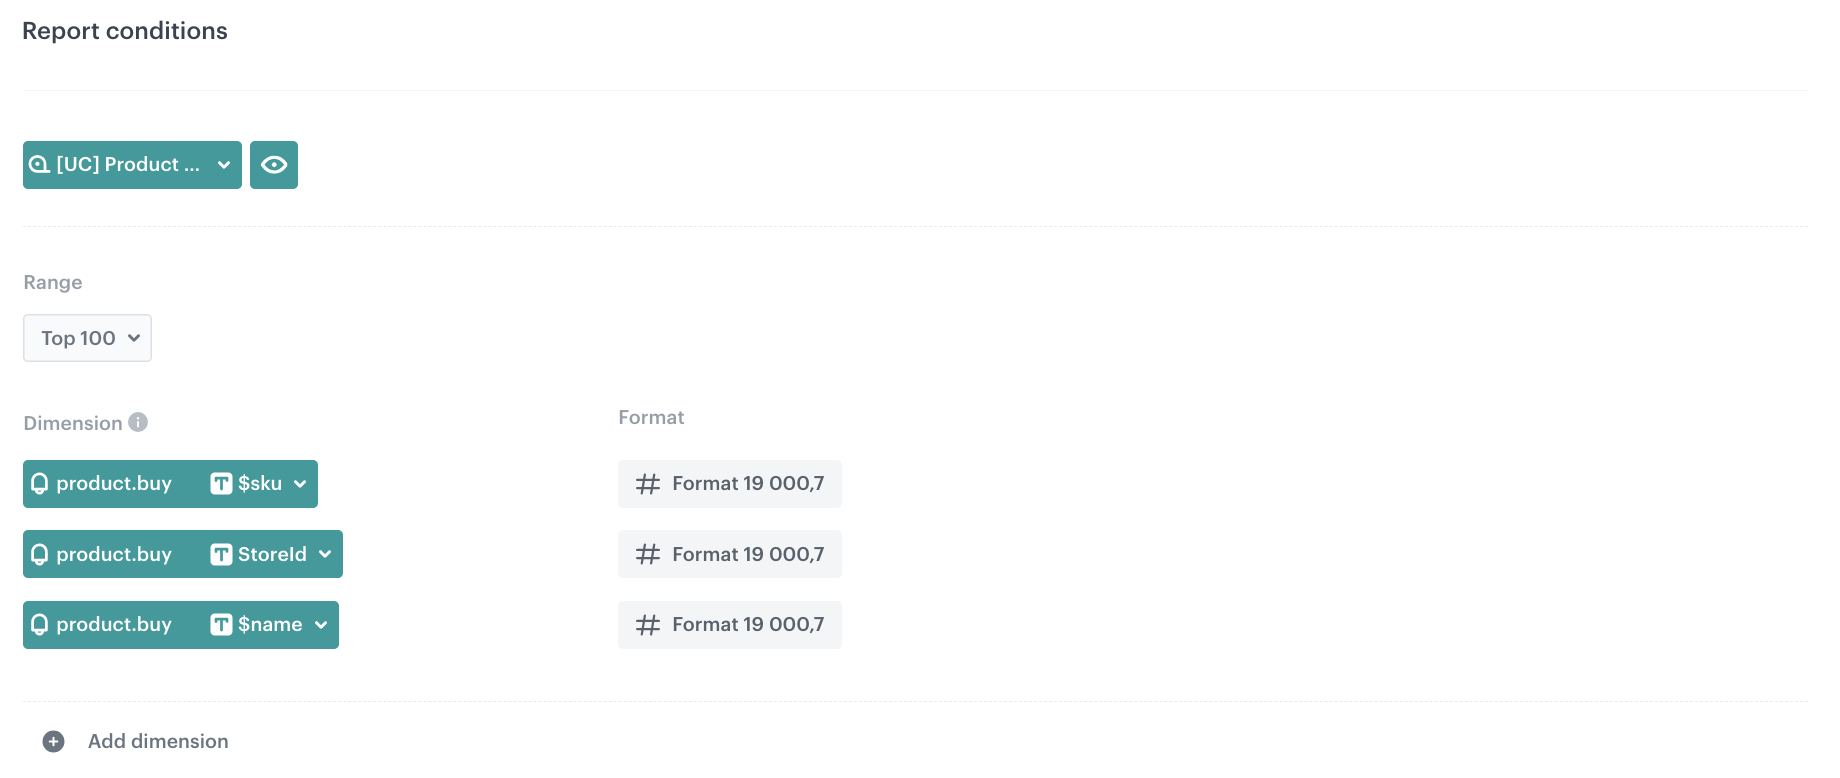
In this part of the process, create a report to clearly show the list of top products purchased in the shops.
- Go to Decision Hub > Report > New report.
- Enter the name of the report.
- Select the metric you created in the previous part of the process.
- From the Range dropdown list, select the number of top (the most frequently added to favorites) products to be shown in the preview of the report. In this case it will be TOP 100 products.
When creating a consolidated report of top-selling products across multiple stores, it is recommended to retrieve more than just the top 10 products (e.g., top 100 or more). This is because the combined list of bestsellers does not always reflect the top 10 products in each individual store. Some products that rank in the top 10 in specific stores might not appear in the overall top 10 list. By increasing the number of products included in the report, you ensure that local top-performing items are not missed and that it's possible to accurately identify the top 10 for each store.
- In the Dimension section, from the dropdown list select Events > Parameters. To be able to show products name in the report, choose
$name. - Click Add dimension.
- From the list, choose
$sku. - Below, add additional dimension -
StoreId.
In this particular use case, we use three dimensions: name, storeID and SKU. This way, we will receive the SKU and name of the products in the report and information in which shop it was bought. You can use any number of dimensions based on your business needs.
- In the date range, select the time that will be analyzed. In this case it will be 7 days.
Select the same date range as you selected for the metric.
- Save the report.
Report settings
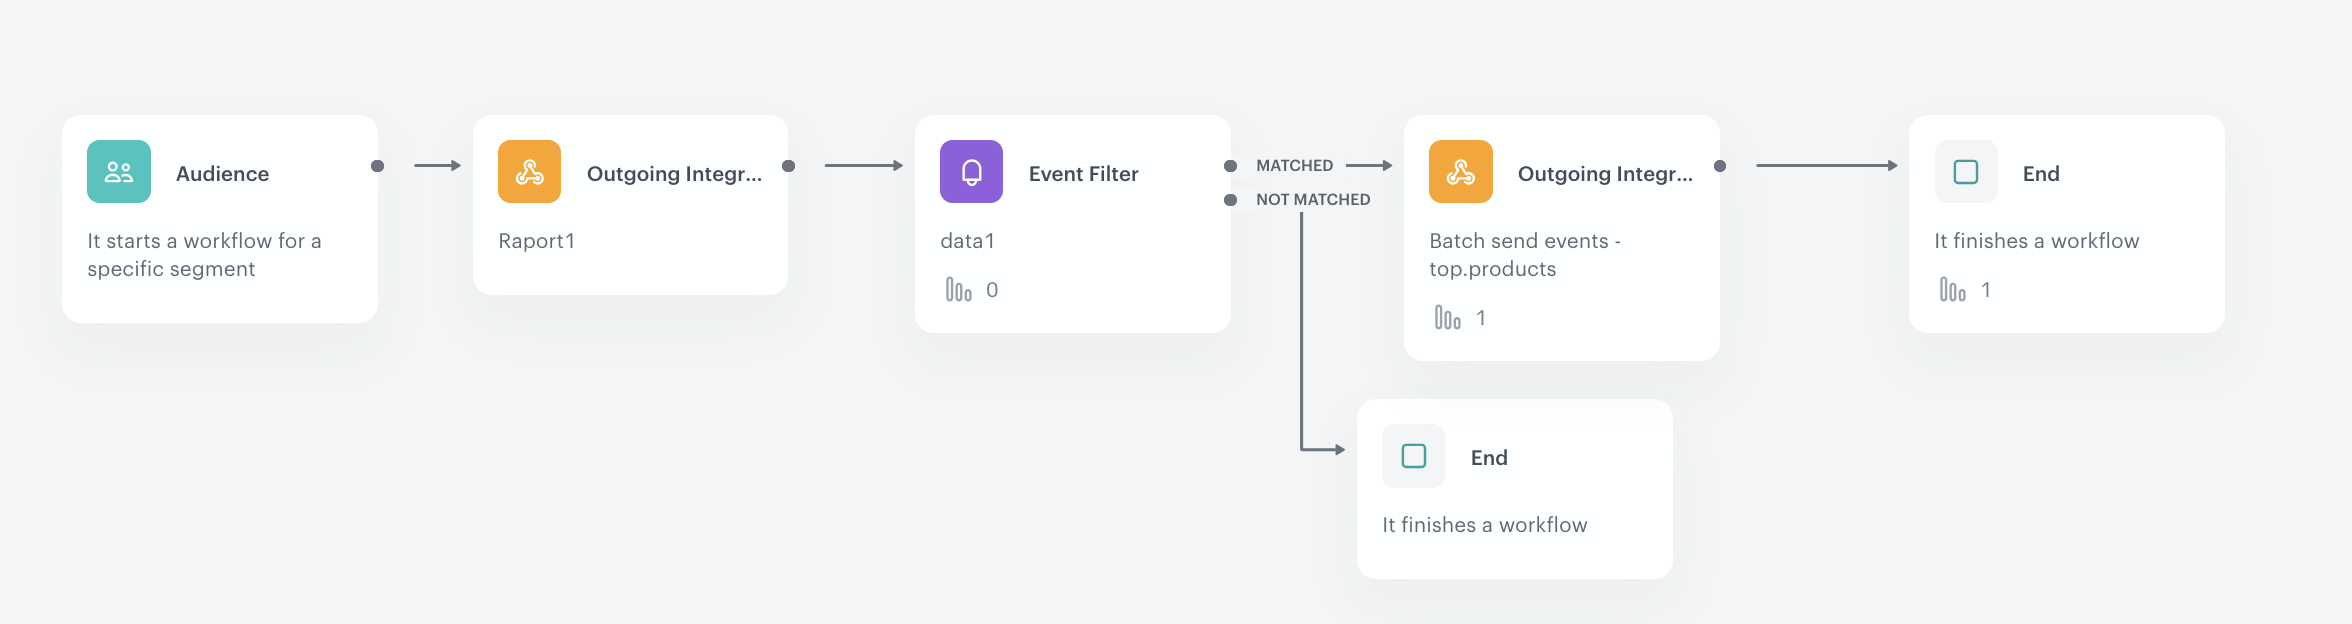
Create a workflow
In this part of the process, you will create the workflow which sends an event with the current top 10 products from each store.
- Go to
 Automation Hub > Workflows > New workflow.
 - Enter the name of the workflow.
Add the Audience node
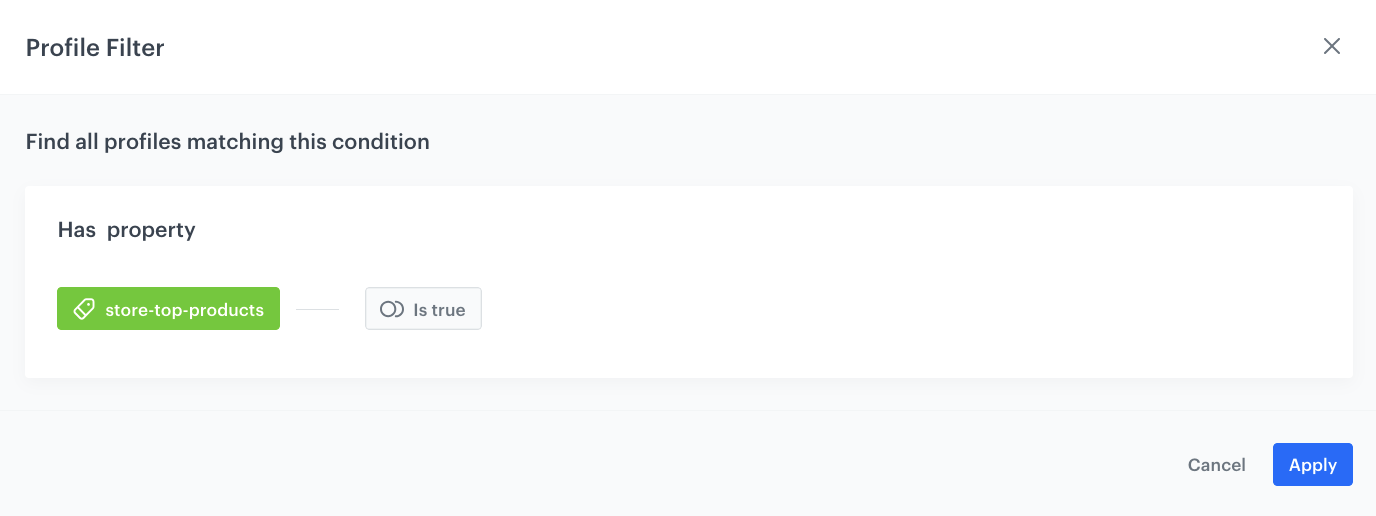
In this step you will create the audience who will get the report you have created.
- From the list of available triggers, select Audience.
- Click the node.
- Set the Run trigger to repeatable.
- Define the frequency of launching the workflow (the Interval field) and when your workflow will be launched for the first time (the Begin at field).
- In the Define audience, select the New audience. Choose the tag used to extract the group of stores -
store-top-productscreated as a part of prerequisites. - As the parameter choose Is true.
- Click Apply.
Add the Outgoing Integration node
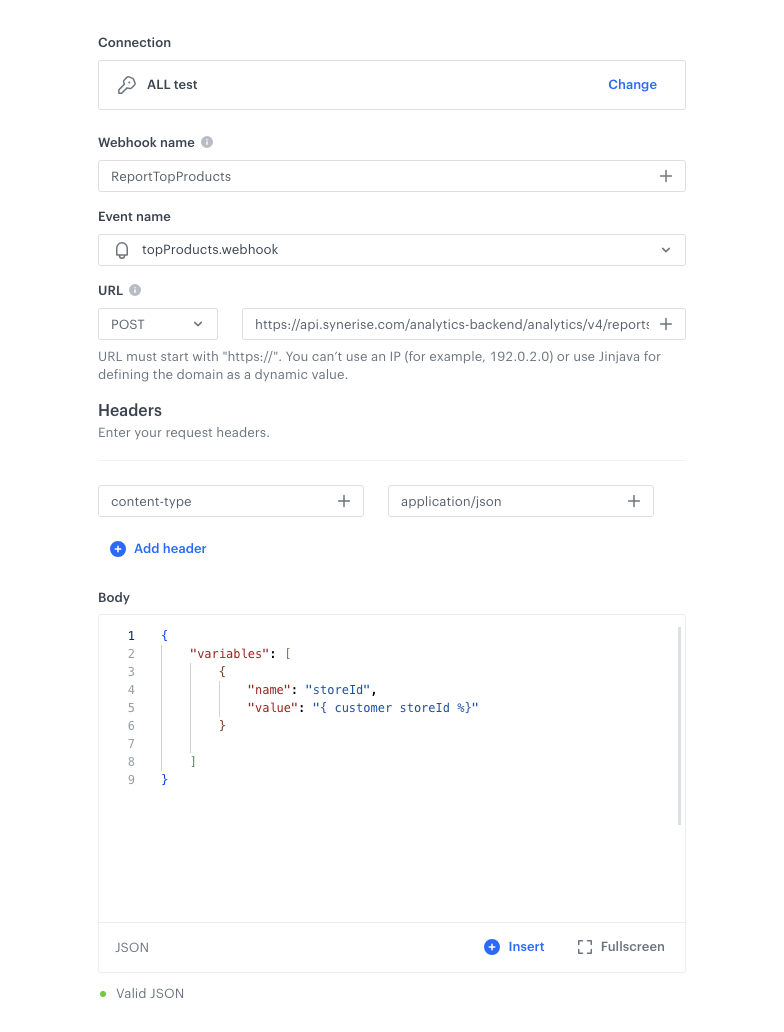
This webhook will be used to get the storeID from the report created in the previous step. We send here all top products, ID of the store and products. We will make a request to this endpoint.
This step uses a webhook to automatically retrieve the contents of the report via API, based on the store’s ID. This is necessary because:
- reports in Synerise are calculated dynamically,
- store-specific filtering must happen at runtime, per each store profile in the audience,
- the API enables automation – instead of downloading and filtering data manually, each store profile receives its own filtered results based on the same report definition. This makes the workflow scalable across hundreds of stores, ensures daily updates, and avoids manual effort.
- Select the Custom webhook tab.
- Select the method of authorization as Synerise API key.
- Click Select connection.
From the dropdown list, select the connection.
- If no connections are available or you want to create a new one, see Create a connection.
- If you selected an existing connection, proceed with the integration settings.
- In the Webhook name field, enter
ReportTopProducts. - Click on the Event name and choose Create event
- In Name, enter
topProducts.webhook. - In Display name, enter the label for the event.
- Select the POST method.
- Enter the endpoint:
https://hub.synerise.com/api-reference/analytics-suite#tag/Reports/operation/analytics2-recalculate-report-override- Replace with the unique ID of your own report. You can find the report ID in the URL when you open the report in Synerise (e.g., https://app.synerise.com/analytics/reports/32bf9328fb8). - Leave the content-type at default (
application / json). - In the request body, paste the code presented below.
Check the examplary JSON body of the report
{ "variables": [ { "name": "storeId", "value": "{ customer storeId %}" } ] }If you want to send more information about the products and transactions, just add them to the code on your own, based on your business needs.
- From the dropdown list, select the API key you created as a part of prerequisites.
- Click Apply.
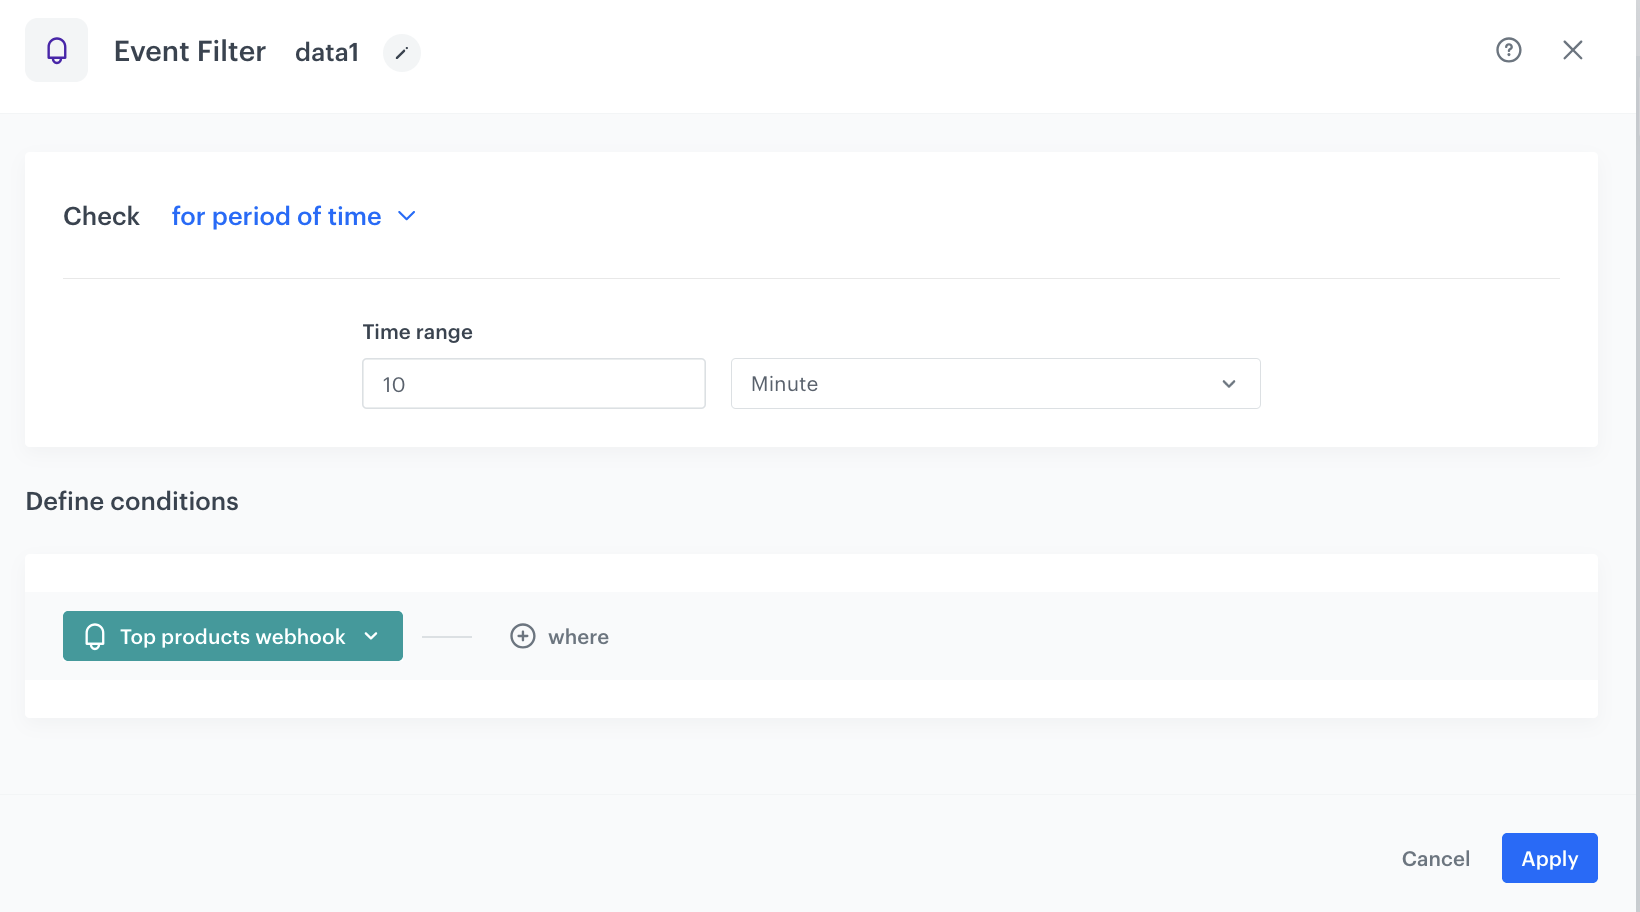
Define the Event Filter node
This node will wait for the webhook response.
- As the next node, add Event Filter. In the configuration of the node:
- Add the name of the node.
- Set the Check option to for period of time.
- Set the time range. In our case, it is 10 minutes.
- In the Define conditions section, from the Choose event dropdown menu, choose
topProducts.webhookevent.
- Confirm by clicking Apply.
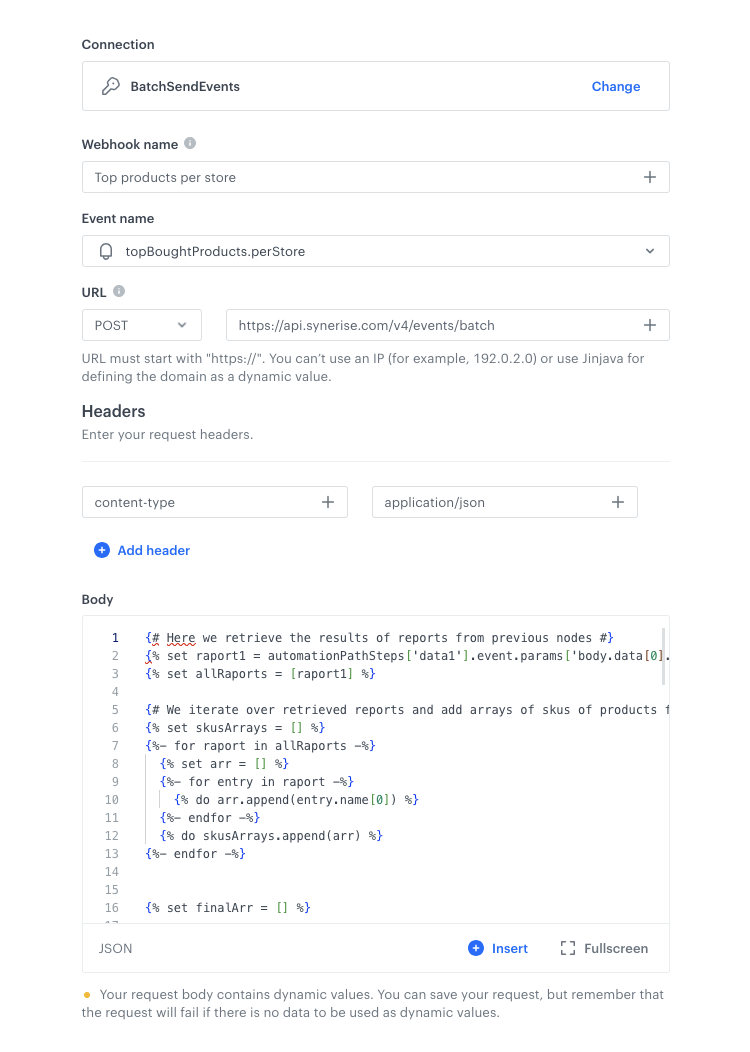
Add the Outgoing Integration node
To the matched path add the Outgoing Integration. In this node, we retrieve the results from reports generated by previous nodes in the workflow. The goal is to extract relevant product data (like SKU, name, URL, price, and brand) and construct a structured event that can be used downstream — for example, in product recommendations or messaging flows.
- Select the Custom webhook tab.
- Select the method of authorization as Synerise API key.
- Click Select connection.
From the dropdown list, select the connection.
- If no connections are available or you want to create a new one, see Create a connection.
- If you selected an existing connection, proceed with the integration settings.
- In the Webhook name field, enter
Top products per store. - Click on the Event name and choose Create event
- Add the new event.
- As the event name add
topBoughtProducts.perStore. - In Display name, enter the label for the event.
- Select the POST method.
- Enter the endpoint:
https://hub.synerise.com/api-reference/data-management#tag/Events/operation/BatchSendEvents - Leave the content-type at default (
application / json). In the request body, paste the code presented below.
Check the examplary JSON body of the report
{# Here we retrieve the results of reports from previous nodes #} {% set raport1 = automationPathSteps['data1'].event.params['body.data[0].values[0]'] %} {% set allRaports = [raport1] %} {# We iterate over retrieved reports and add arrays of skus of products from them to the skusArrays #} {% set skusArrays = [] %} {%- for raport in allRaports -%} {% set arr = [] %} {%- for entry in raport -%} {% do arr.append(entry.name[0]) %} {%- endfor -%} {% do skusArrays.append(arr) %} {%- endfor -%} {% set finalArr = [] %} {%- for skuArr in skusArrays -%} {%- for sku in skuArr -%} {%- if finalArr|length < 10 -%} {% catalogitemv2.store-1(sku) allowEmpty=True %} {% set prod = catalog_result %} {%- if prod.name and prod.brand -%} {#Here we can add conditions to check#} {%- do finalArr.append({ 'sku': sku, 'name': prod.name, 'productUrl': prod.productUrl, 'price': prod.price, 'brand': prod.brand.label }) -%} {%- endif -%} {% endcatalogitemv2 %} {%- endif -%} {%- endfor -%} {%- endfor -%} {% set data = [] %} {# Here we set the final object to send #} {%- for promotion in finalArr -%} {% do data.append({ "client": { "customId": "{% customer StoreId %}" }, "label": "Magic products", "action": "magic.products", "type": "custom", "params": promotion, }) %} {%- endfor -%} {# We convert the object to JSON and this is the body of our request #} {% if data|length > 0 %} {{ data|tojson }} {% else %} {{ [{ "client": { "customId": "{% customer StoreId %}" }, "label": "Magic products", "action": "magic.products", "type": "custom", "params": { "alert": "No products matched the conditions" } }] | tojson }} {% endif %}This part of the workflow processes the top products per store:
- It retrieves the list of SKUs from the report results (fetched via the webhook from the previous step).
- For each SKU, it queries the catalog feed to enrich the product data with: additional parameters like e.g. name, price, brand, etc.
- It builds an array of up to 10 enriched product items, skipping those that are incomplete (e.g., missing name or brand).
- This webhook generates a custom event with action top.products, containing enriched product data (sku, name, price, etc.). This event becomes the source for the final metric and report that summarize the top products per store. It is also ready to be used in other systems (e.g., digital signage, product recommendations, banners, etc.).
Once the product data is collected, it’s structured into a standardized event format, with fields like label, action, type, and params, making it suitable for downstream use—such as powering features like **top.boughtproducts.perStore**.
As a safeguard, if no valid product data is found (for example, due to empty results or filtering logic), the system includes a clear message in the output indicating that no products were available, allowing for graceful fallback handling in the display or integration logic.- Click Apply.
Prepare the final settings
- Add the End nodes.
- Optionally, define capping.
- Optionally, add titles to each node so the workflow will be more understandable to your colleagues.
- Activate the workflow by clicking Save & Run.
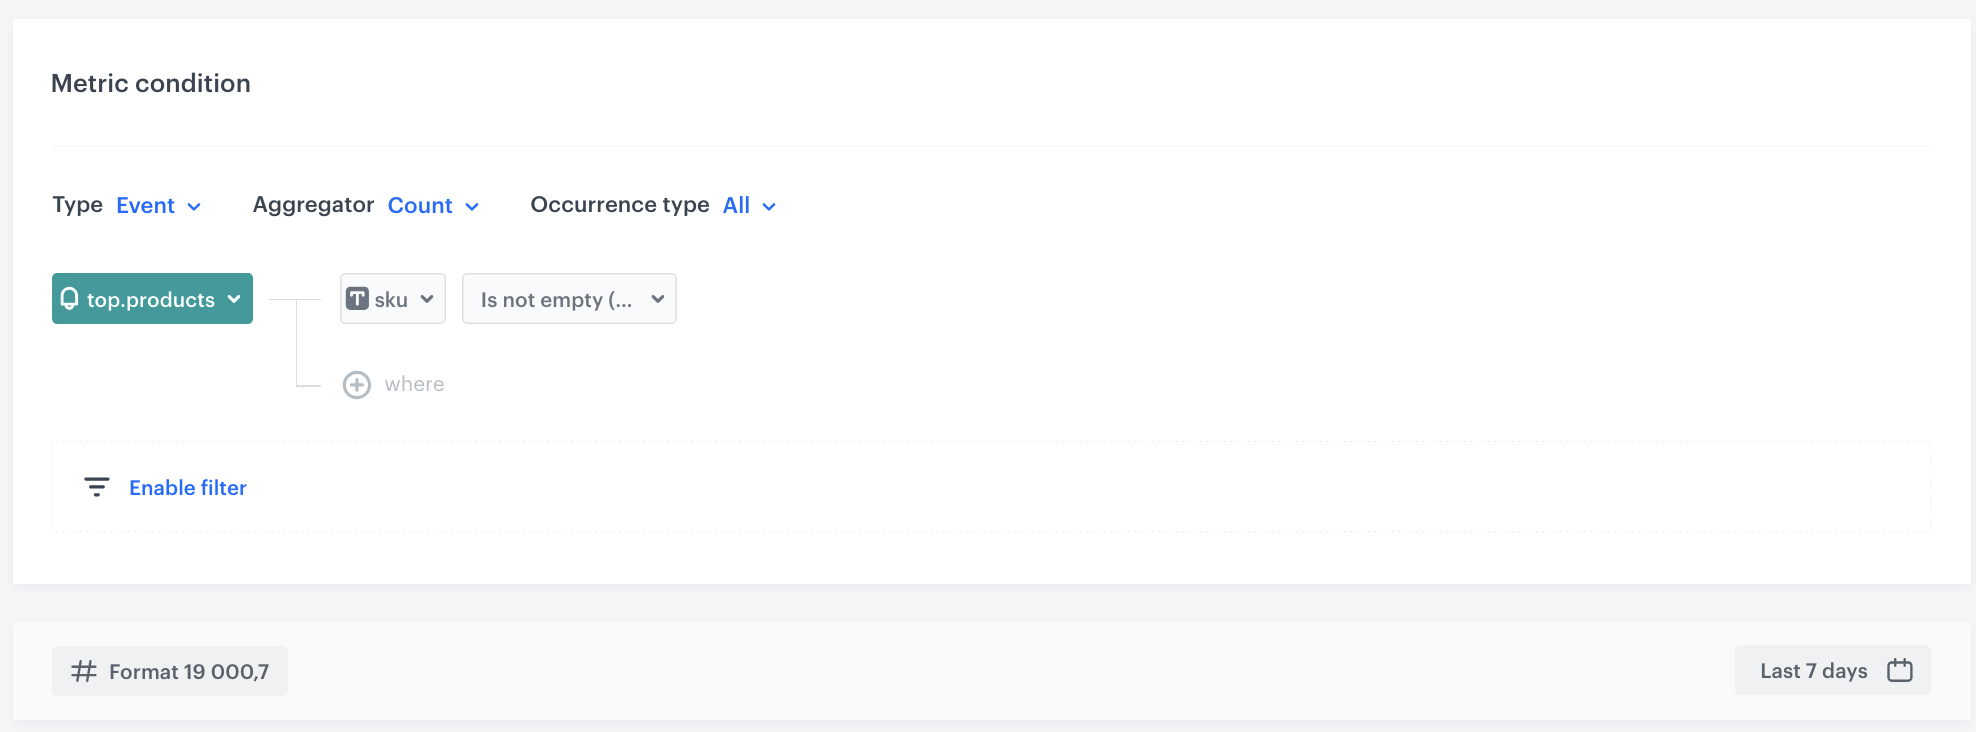
Create final metric
In this part of the process, create the metric based on the events generated in the workflow.
- Go to Decision Hub > Metrics > New metric.
- Enter the name of the metric.
- As a metric kind, select Simple metric.
- As the metric type, select Event.
- As the aggregator, set Count.
- As the occurrence type, set All.
- From the Choose event dropdown list, select
top.products. - Click + where button and from the dropdown list, choose
skuparameter. - From the Choose operator dropdown, select Is not empty.
- In the date range, select the time that will be analyzed. In this case it will be 7 days.
- Click Save.
Create final report
As the last step, create the final report, presenting the results of the report, created based on the events generated in workflow.
- Go to Decision Hub > Report > New report.
- Enter the name of the report.
- Select the metric with top products you created in the previous part of the process.
- From the Range dropdown list, select the number of top (the most frequently added to favorites) products to be shown in the preview of the report. In this case it will be TOP 100 products.
- In the Dimension section, from the dropdown list select Events > Parameters. To be able to show products name in the report, choose
sku. - Click Add dimension.
- From the list, you can choose more dimensions - in our case it will be
brandandcustomIdentify - In the date range, select the time that will be analyzed. In this case it will be 7 days.
Select the same date range as you selected for the metric.
- Save the report.
- Click preview to see the results.
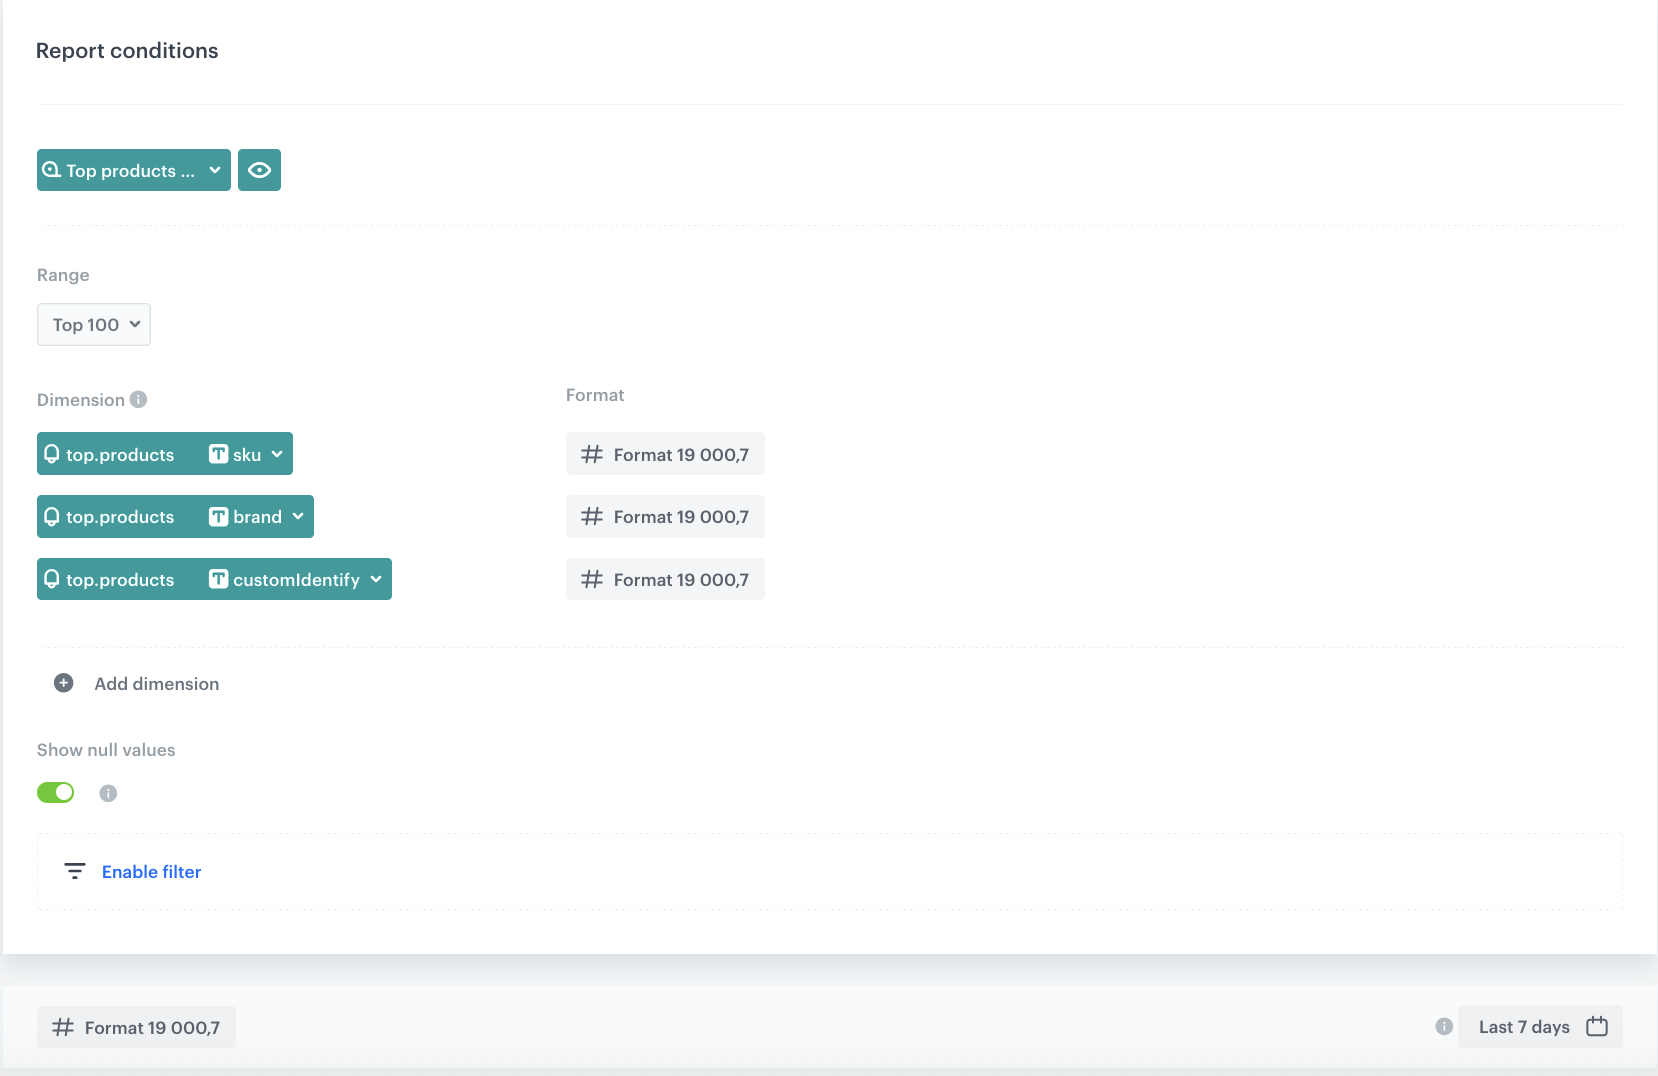
Report settings
What's next
Information from this report might be used in the following campaigns:
- Integrate with in-store digital signage systems Once the daily top 10 product reports per store are generated, the data can be automatically pushed to digital signage platforms. This enables real-time, localized content that reflects actual customer behavior in each specific store.
Set up automated workflows to refresh signage content daily or as frequently as needed, ensuring that each store highlights its current bestsellers without manual intervention.
- Support merchandising decisions Use these insights to test different product placements and monitor their performance visually and analytically, linking digital presentation with physical outcomes.
- Extend to omnichannel experiences Consistent messaging across in-store signage, local landing pages, and mobile apps builds a seamless customer journey, with top products tailored to the customer's location.
You’re free to use it however you like—whether that means simply downloading it or sending it to other tools for external analysis.
There are a few ways to handle this:
- You can also export it as a file.
- You can send the data to an API.
- You can use our existing nodes and integrations to forward it to other tools—depending on the number of products, certain requirements may apply. In such cases, we recommend getting in touch with our CSI team if you plan to process the data externally.
Each method has its own limitations and constraints, so please remember to contact our CSI team beforehand to avoid issues.
Check the use case set up on the Synerise Demo workspace
You can check the metric, report and workflow configuration, final metric and final report directly in Synerise Demo workspace.
If you’re our partner or client, you already have automatic access to the Synerise Demo workspace (1590), where you can explore all the configured elements of this use case and copy them to your workspace.
If you’re not a partner or client yet, we encourage you to fill out the contact form to schedule a meeting with our representatives. They’ll be happy to show you how our demo works and discuss how you can apply this use case in your business.