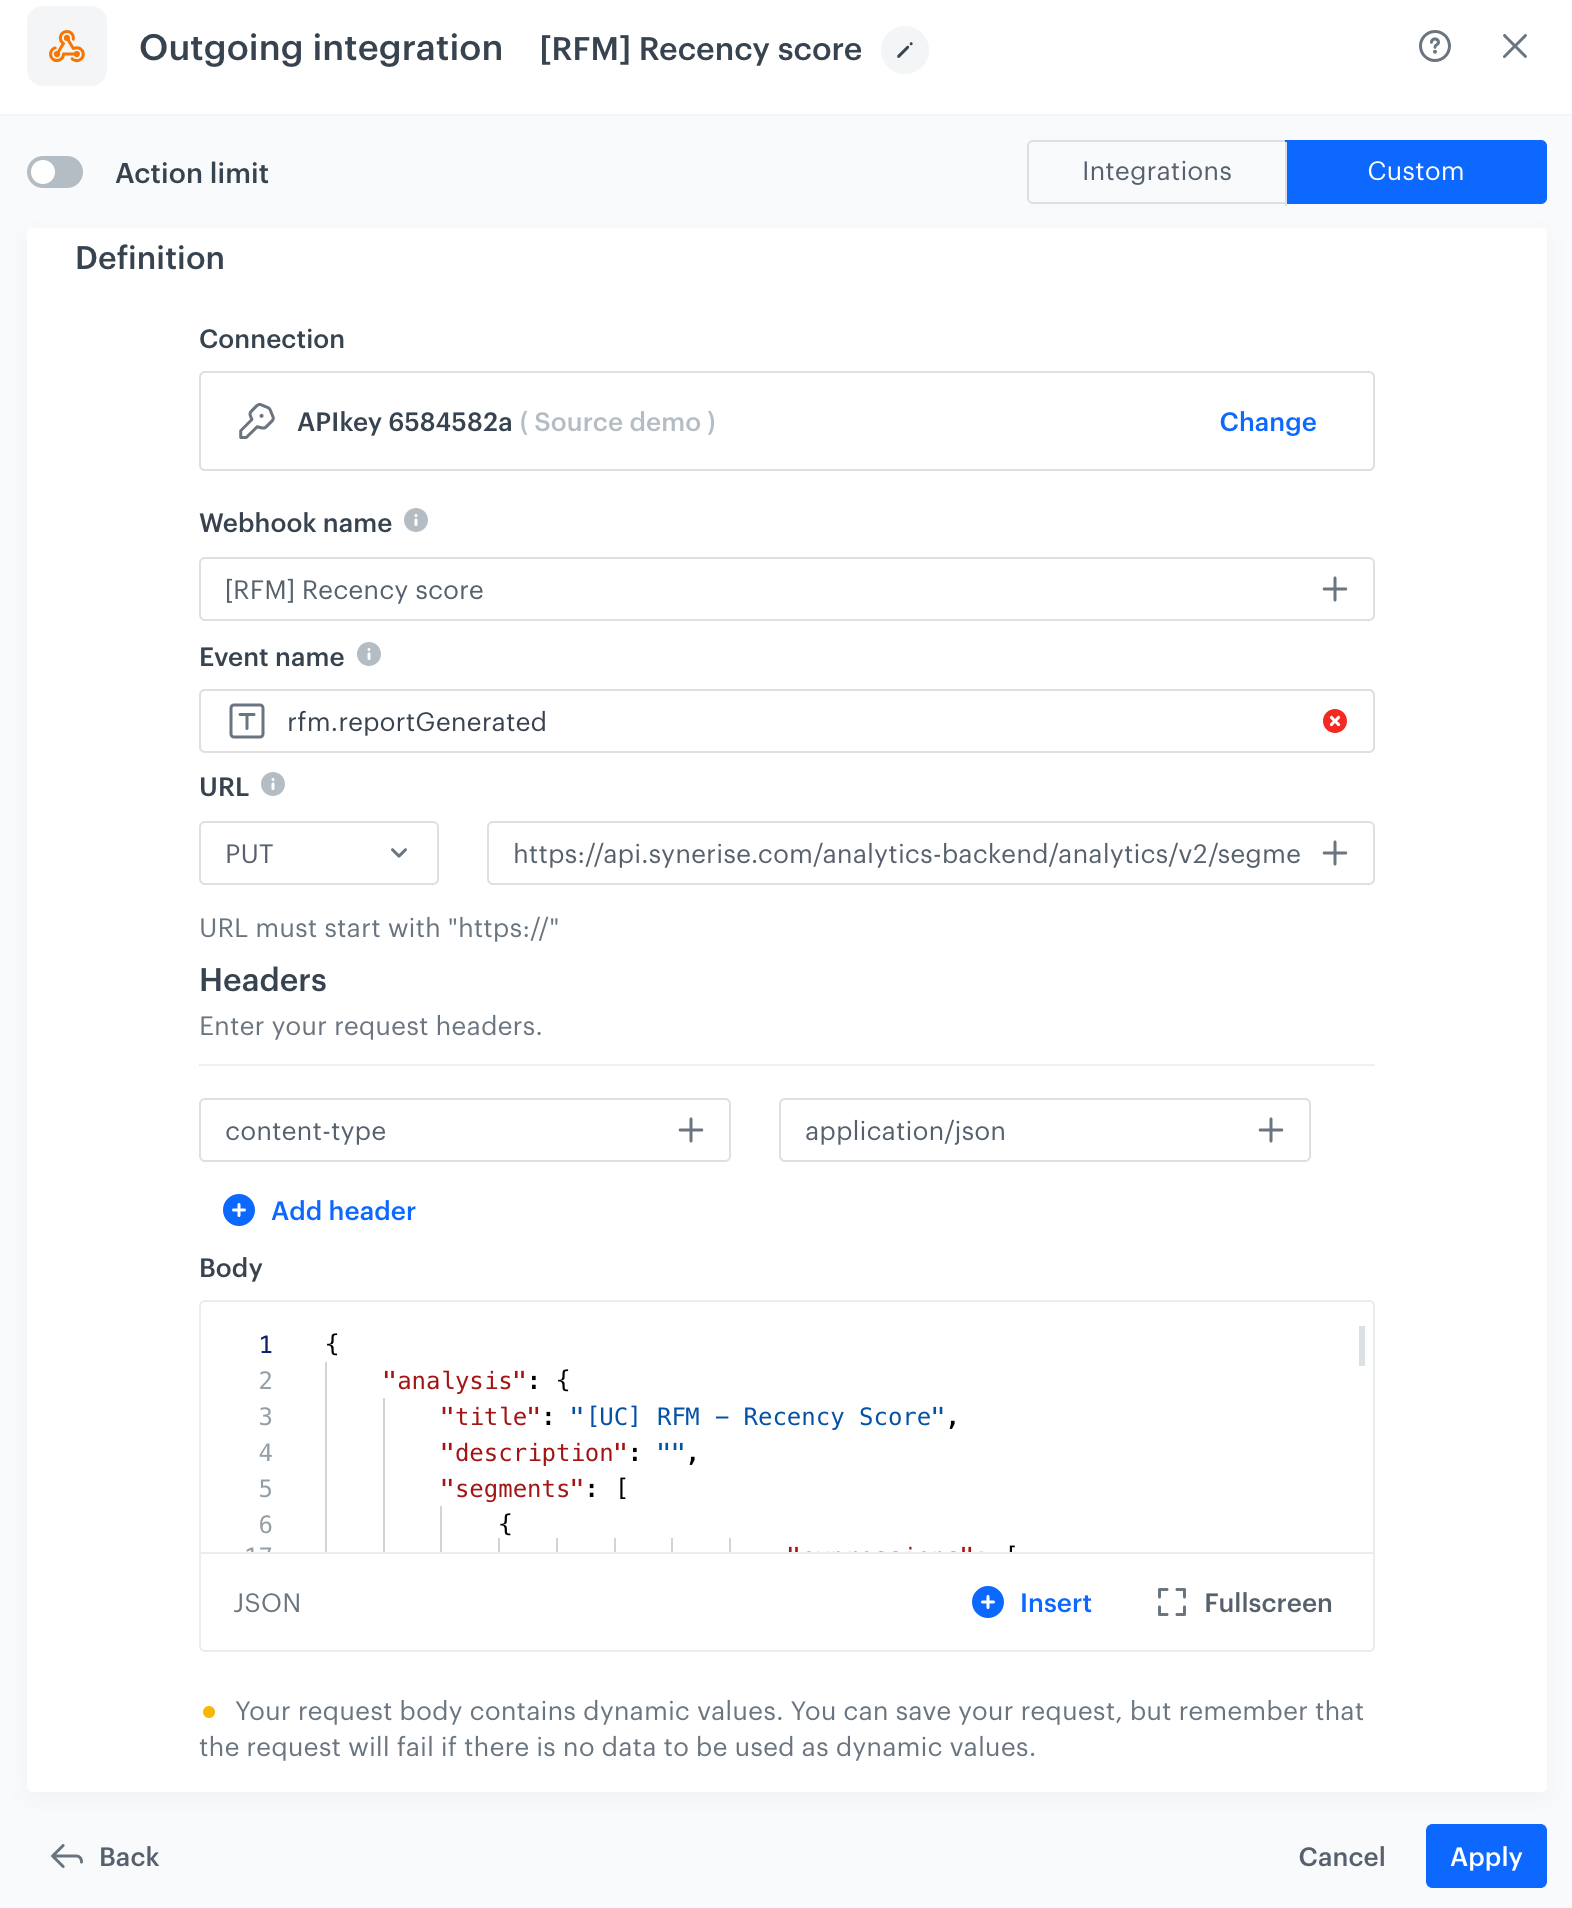
{ "analysis": { "title": "[UC] RFM - Recency Score", "description": "", "segments": [ { "title": "500", "description": "", "filter": { "matching": true, "expressions": [ { "name": "", "type": "ATTRIBUTE", "matching": true, "attribute": { "expressions": [ { "constraint": { "type": "NUMBER_ONE", "logic": "LESS", "value": { "type": "CONSTANT", "constant": {% metricsvar metric_id:97488c6a-746e-42fc-a1ca-b2fb4b8dfa94%}{{ metric_result|round(3,'floor') }} {% endmetricsvar %} } }, "attribute": { "type": "EXPRESSION", "id": "73d13360-2074-463c-9978-79861889dff0" } } ] } } ], "expression": { "name": "", "type": "ATTRIBUTE", "matching": true, "attribute": { "expressions": [ { "constraint": { "type": "NUMBER_ONE", "logic": "LESS", "value": { "type": "CONSTANT", "constant": {% metricsvar metric_id:97488c6a-746e-42fc-a1ca-b2fb4b8dfa94%}{{ metric_result|round(3,'floor') }} {% endmetricsvar %} } }, "attribute": { "type": "EXPRESSION", "id": "73d13360-2074-463c-9978-79861889dff0" } } ] } } }, "profileMetrics": [] }, { "title": "400", "description": "", "filter": { "matching": true, "expressions": [ { "name": "", "type": "ATTRIBUTE", "matching": true, "attribute": { "expressions": [ { "constraint": { "type": "NUMBER_ONE", "logic": "MORE_OR_EQUAL", "value": { "type": "CONSTANT", "constant": {% metricsvar metric_id:97488c6a-746e-42fc-a1ca-b2fb4b8dfa94%}{{ metric_result|round(3,'floor') }} {% endmetricsvar %} } }, "attribute": { "type": "EXPRESSION", "id": "73d13360-2074-463c-9978-79861889dff0" } } ] } }, { "type": "OPERATOR", "logic": "AND" }, { "name": "", "type": "ATTRIBUTE", "matching": true, "attribute": { "expressions": [ { "constraint": { "type": "NUMBER_ONE", "logic": "LESS", "value": { "type": "CONSTANT", "constant": {% metricsvar metric_id:e571679c-0f04-466f-aa43-ff6d5023bb09%}{{ metric_result|round(3,'floor') }} {% endmetricsvar %} } }, "attribute": { "type": "EXPRESSION", "id": "73d13360-2074-463c-9978-79861889dff0" } } ] } } ], "expression": { "type": "FUNCTION", "function": "AND", "arg1": { "name": "", "type": "ATTRIBUTE", "matching": true, "attribute": { "expressions": [ { "constraint": { "type": "NUMBER_ONE", "logic": "LESS", "value": { "type": "CONSTANT", "constant": {% metricsvar metric_id:e571679c-0f04-466f-aa43-ff6d5023bb09%}{{ metric_result|round(3,'floor') }} {% endmetricsvar %} } }, "attribute": { "type": "EXPRESSION", "id": "73d13360-2074-463c-9978-79861889dff0" } } ] } }, "arg2": { "name": "", "type": "ATTRIBUTE", "matching": true, "attribute": { "expressions": [ { "constraint": { "type": "NUMBER_ONE", "logic": "MORE_OR_EQUAL", "value": { "type": "CONSTANT", "constant": {% metricsvar metric_id:97488c6a-746e-42fc-a1ca-b2fb4b8dfa94%}{{ metric_result|round(3,'floor') }} {% endmetricsvar %} } }, "attribute": { "type": "EXPRESSION", "id": "73d13360-2074-463c-9978-79861889dff0" } } ] } } } }, "profileMetrics": [] }, { "title": "300", "description": "", "filter": { "matching": true, "expressions": [ { "name": "", "type": "ATTRIBUTE", "matching": true, "attribute": { "expressions": [ { "constraint": { "type": "NUMBER_ONE", "logic": "MORE_OR_EQUAL", "value": { "type": "CONSTANT", "constant": {% metricsvar metric_id:e571679c-0f04-466f-aa43-ff6d5023bb09%}{{ metric_result|round(3,'floor') }} {% endmetricsvar %} } }, "attribute": { "type": "EXPRESSION", "id": "73d13360-2074-463c-9978-79861889dff0" } } ] } }, { "type": "OPERATOR", "logic": "AND" }, { "name": "", "type": "ATTRIBUTE", "matching": true, "attribute": { "expressions": [ { "constraint": { "type": "NUMBER_ONE", "logic": "LESS", "value": { "type": "CONSTANT", "constant": {% metricsvar metric_id:8031ccf4-2444-42bf-8eba-ba61d952d52f%}{{ metric_result|round(3,'floor') }} {% endmetricsvar %} } }, "attribute": { "type": "EXPRESSION", "id": "73d13360-2074-463c-9978-79861889dff0" } } ] } } ], "expression": { "type": "FUNCTION", "function": "AND", "arg1": { "name": "", "type": "ATTRIBUTE", "matching": true, "attribute": { "expressions": [ { "constraint": { "type": "NUMBER_ONE", "logic": "LESS", "value": { "type": "CONSTANT", "constant": {% metricsvar metric_id:8031ccf4-2444-42bf-8eba-ba61d952d52f%}{{ metric_result|round(3,'floor') }} {% endmetricsvar %} } }, "attribute": { "type": "EXPRESSION", "id": "73d13360-2074-463c-9978-79861889dff0" } } ] } }, "arg2": { "name": "", "type": "ATTRIBUTE", "matching": true, "attribute": { "expressions": [ { "constraint": { "type": "NUMBER_ONE", "logic": "MORE_OR_EQUAL", "value": { "type": "CONSTANT", "constant": {% metricsvar metric_id:e571679c-0f04-466f-aa43-ff6d5023bb09%}{{ metric_result|round(3,'floor') }} {% endmetricsvar %} } }, "attribute": { "type": "EXPRESSION", "id": "73d13360-2074-463c-9978-79861889dff0" } } ] } } } }, "profileMetrics": [] }, { "title": "200", "description": "", "filter": { "matching": true, "expressions": [ { "name": "", "type": "ATTRIBUTE", "matching": true, "attribute": { "expressions": [ { "constraint": { "type": "NUMBER_ONE", "logic": "MORE_OR_EQUAL", "value": { "type": "CONSTANT", "constant": {% metricsvar metric_id:8031ccf4-2444-42bf-8eba-ba61d952d52f%}{{ metric_result|round(3,'floor') }} {% endmetricsvar %} } }, "attribute": { "type": "EXPRESSION", "id": "73d13360-2074-463c-9978-79861889dff0" } } ] } }, { "type": "OPERATOR", "logic": "AND" }, { "name": "", "type": "ATTRIBUTE", "matching": true, "attribute": { "expressions": [ { "constraint": { "type": "NUMBER_ONE", "logic": "LESS", "value": { "type": "CONSTANT", "constant": {% metricsvar metric_id:fb1c9bff-ce29-42c0-93ee-b56f092ae03f%}{{ metric_result|round(3,'floor') }} {% endmetricsvar %} } }, "attribute": { "type": "EXPRESSION", "id": "73d13360-2074-463c-9978-79861889dff0" } } ] } } ], "expression": { "type": "FUNCTION", "function": "AND", "arg1": { "name": "", "type": "ATTRIBUTE", "matching": true, "attribute": { "expressions": [ { "constraint": { "type": "NUMBER_ONE", "logic": "LESS", "value": { "type": "CONSTANT", "constant": {% metricsvar metric_id:fb1c9bff-ce29-42c0-93ee-b56f092ae03f%}{{ metric_result|round(3,'floor') }} {% endmetricsvar %} } }, "attribute": { "type": "EXPRESSION", "id": "73d13360-2074-463c-9978-79861889dff0" } } ] } }, "arg2": { "name": "", "type": "ATTRIBUTE", "matching": true, "attribute": { "expressions": [ { "constraint": { "type": "NUMBER_ONE", "logic": "MORE_OR_EQUAL", "value": { "type": "CONSTANT", "constant": {% metricsvar metric_id:8031ccf4-2444-42bf-8eba-ba61d952d52f%}{{ metric_result|round(3,'floor') }} {% endmetricsvar %} } }, "attribute": { "type": "EXPRESSION", "id": "73d13360-2074-463c-9978-79861889dff0" } } ] } } } }, "profileMetrics": [] }, { "title": "100", "description": "", "filter": { "matching": true, "expressions": [ { "name": "", "type": "ATTRIBUTE", "matching": true, "attribute": { "expressions": [ { "constraint": { "type": "NUMBER_ONE", "logic": "MORE_OR_EQUAL", "value": { "type": "CONSTANT", "constant": {% metricsvar metric_id:fb1c9bff-ce29-42c0-93ee-b56f092ae03f%}{{ metric_result|round(3,'floor') }} {% endmetricsvar %} } }, "attribute": { "type": "EXPRESSION", "id": "73d13360-2074-463c-9978-79861889dff0" } } ] } }, { "type": "OPERATOR", "logic": "AND" }, { "name": "", "type": "FUNNEL", "matching": true, "funnel": { "title": "unnamed", "completedWithin": {}, "dateFilter": { "type": "ABSOLUTE" }, "steps": [ { "action": { "id": 68600, "name": "transaction.charge" }, "title": "Unnamed Step", "expressions": [], "eventName": "transaction.charge" } ], "exact": false } } ], "expression": { "type": "FUNCTION", "function": "AND", "arg1": { "name": "", "type": "FUNNEL", "matching": true, "funnel": { "title": "unnamed", "completedWithin": null, "dateFilter": { "type": "ABSOLUTE" }, "steps": [ { "action": { "id": 68600, "name": "transaction.charge" }, "title": "Unnamed Step", "expressions": [], "eventName": "transaction.charge" } ], "exact": false } }, "arg2": { "name": "", "type": "ATTRIBUTE", "matching": true, "attribute": { "expressions": [ { "constraint": { "type": "NUMBER_ONE", "logic": "MORE_OR_EQUAL", "value": { "type": "CONSTANT", "constant": {% metricsvar metric_id:fb1c9bff-ce29-42c0-93ee-b56f092ae03f%}{{ metric_result|round(3,'floor') }} {% endmetricsvar %} } }, "attribute": { "type": "EXPRESSION", "id": "73d13360-2074-463c-9978-79861889dff0" } } ] } } } }, "profileMetrics": [] } ], "unique": true }, "allowNull": true }
 icon.
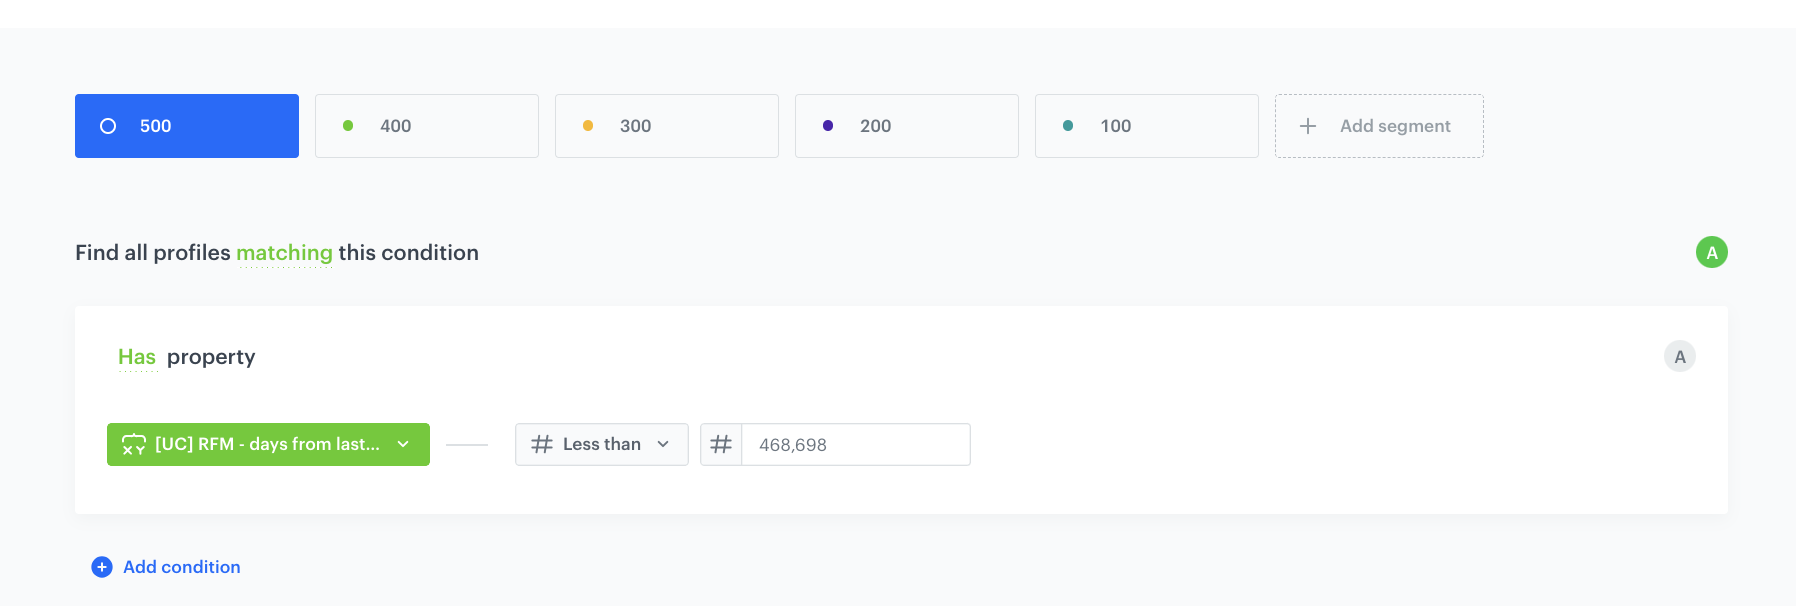
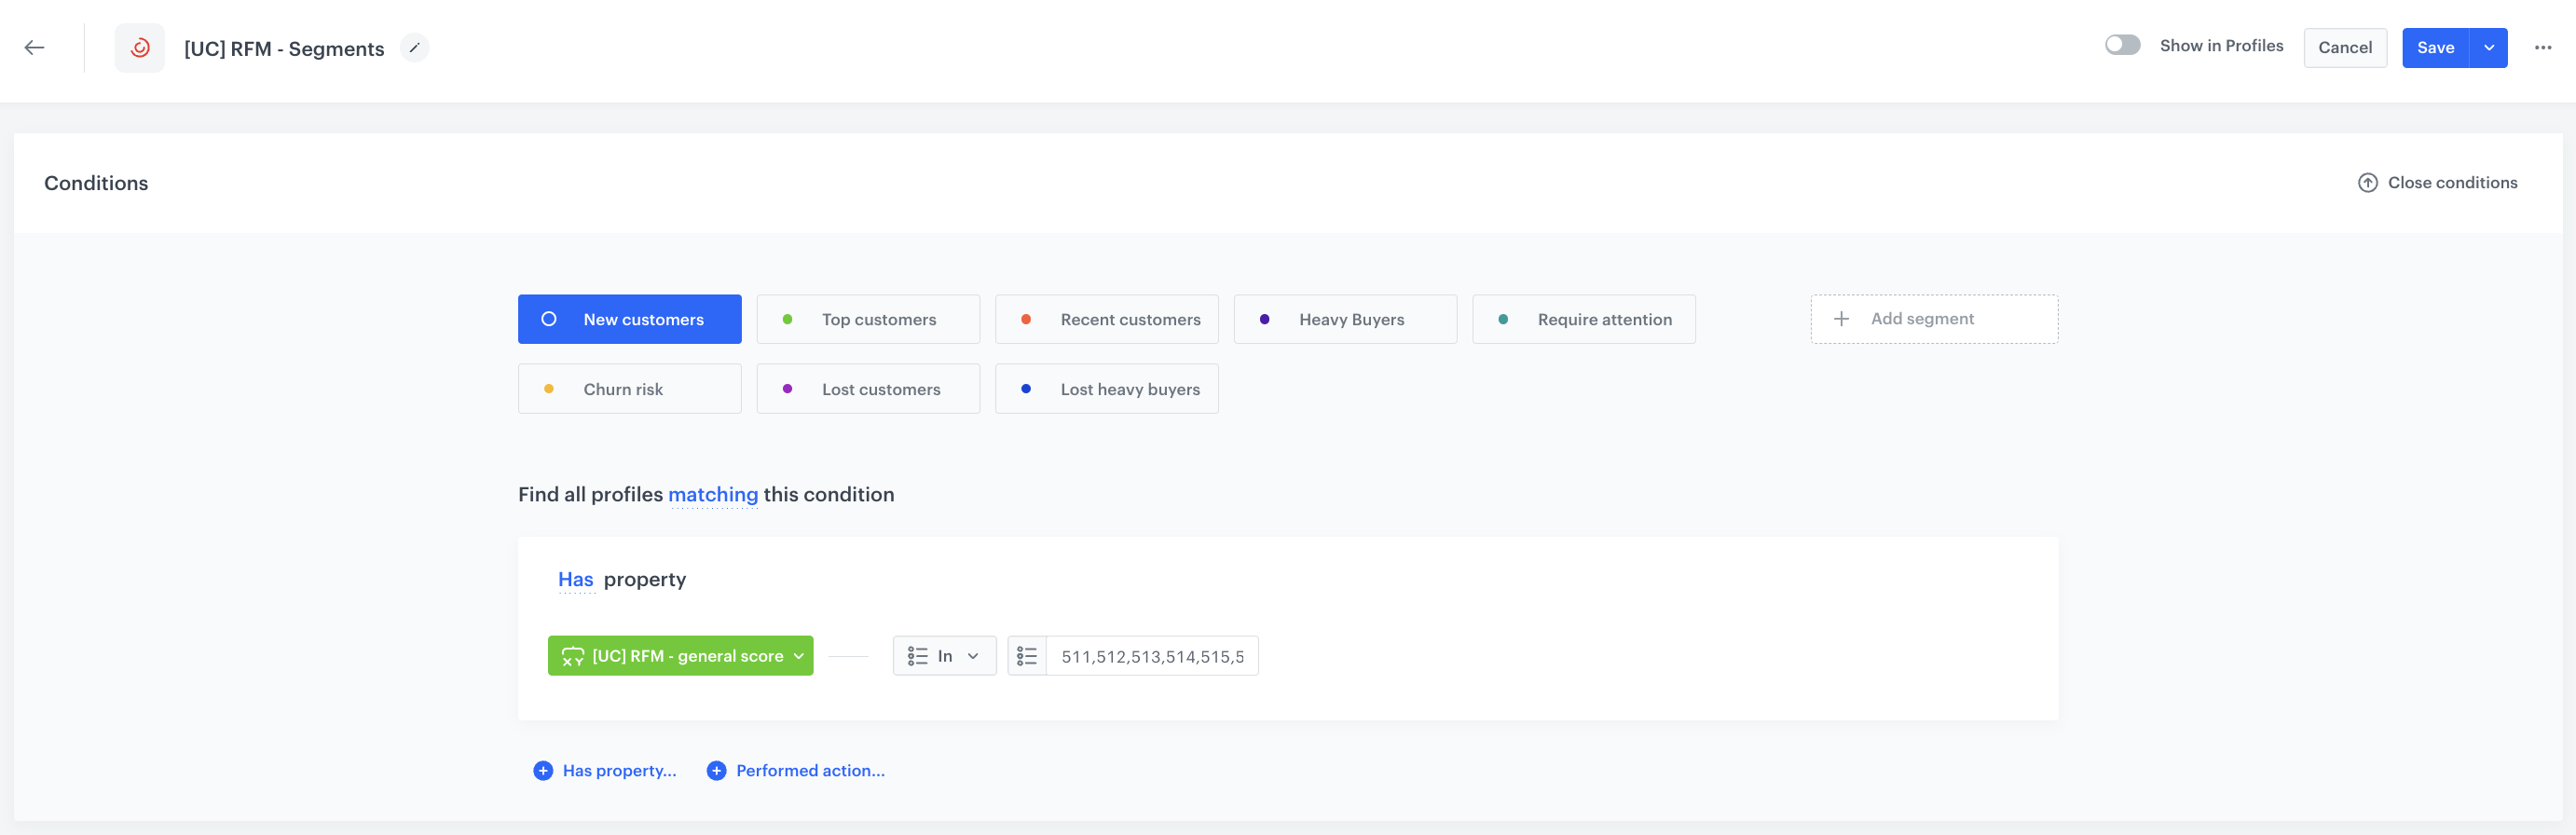
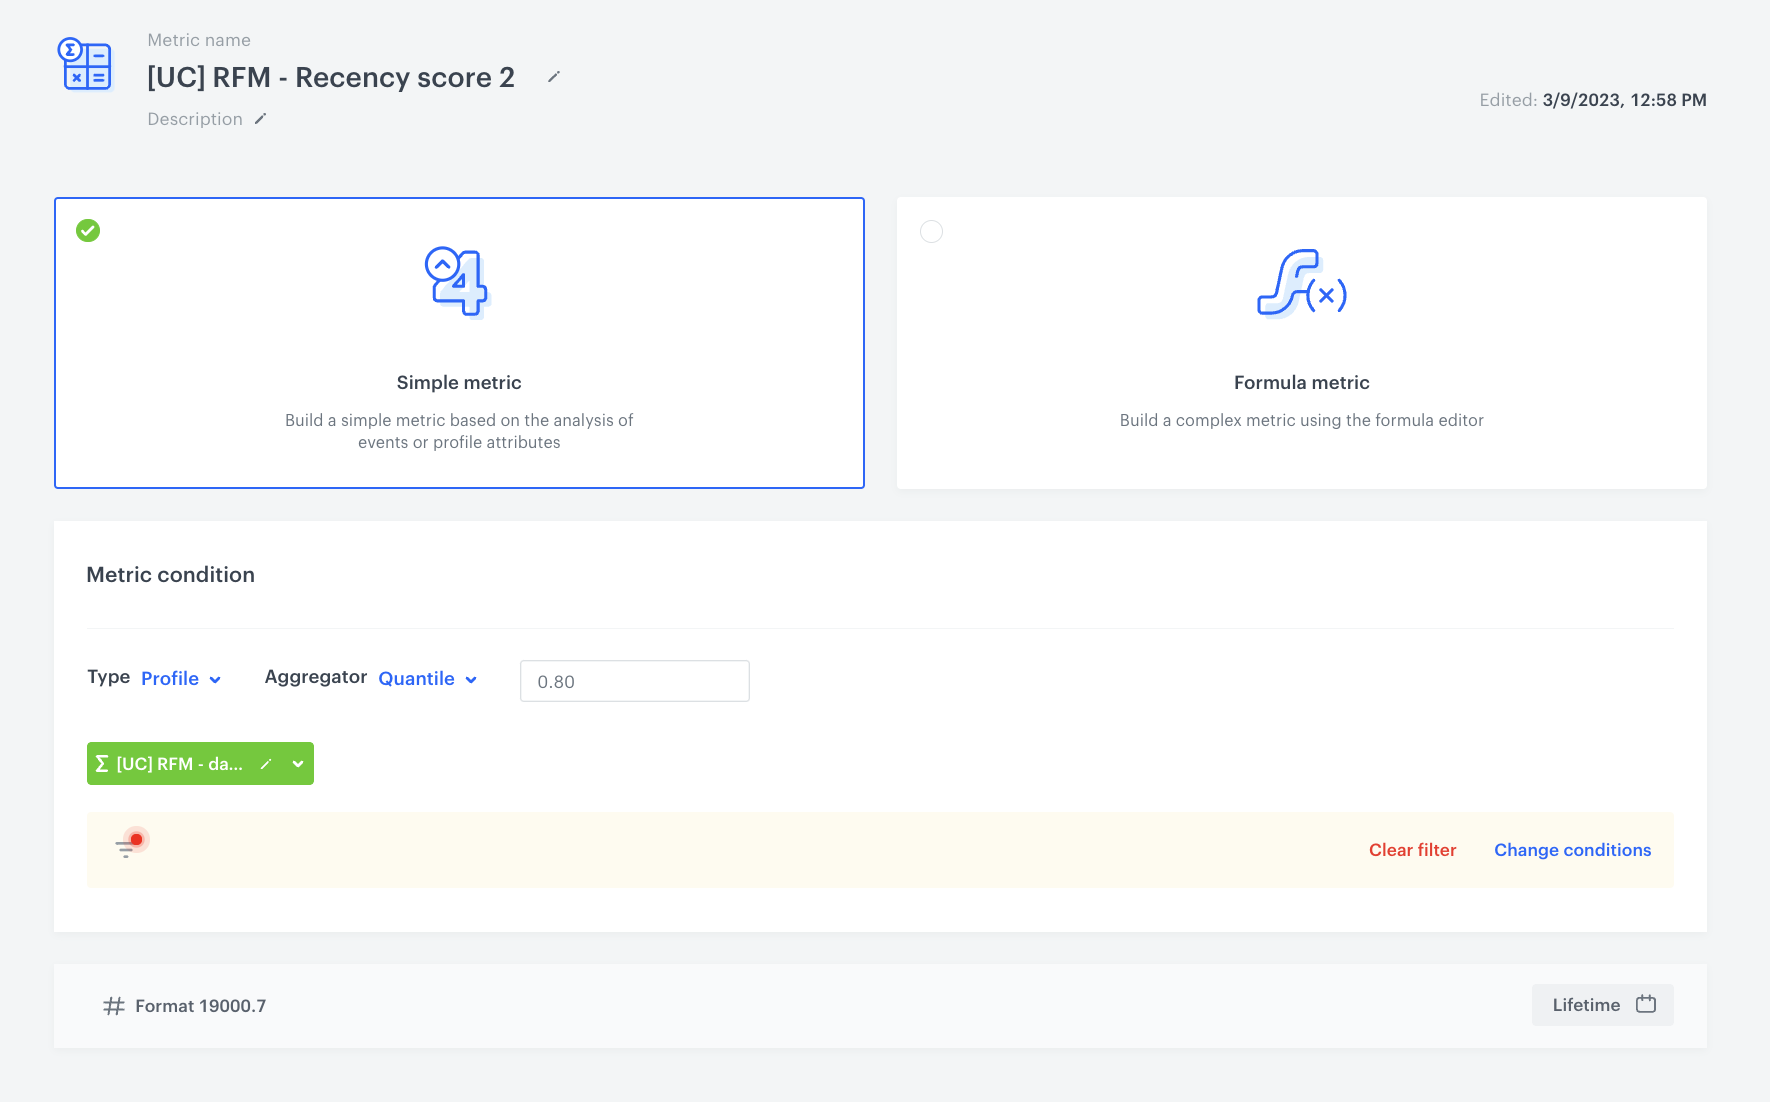
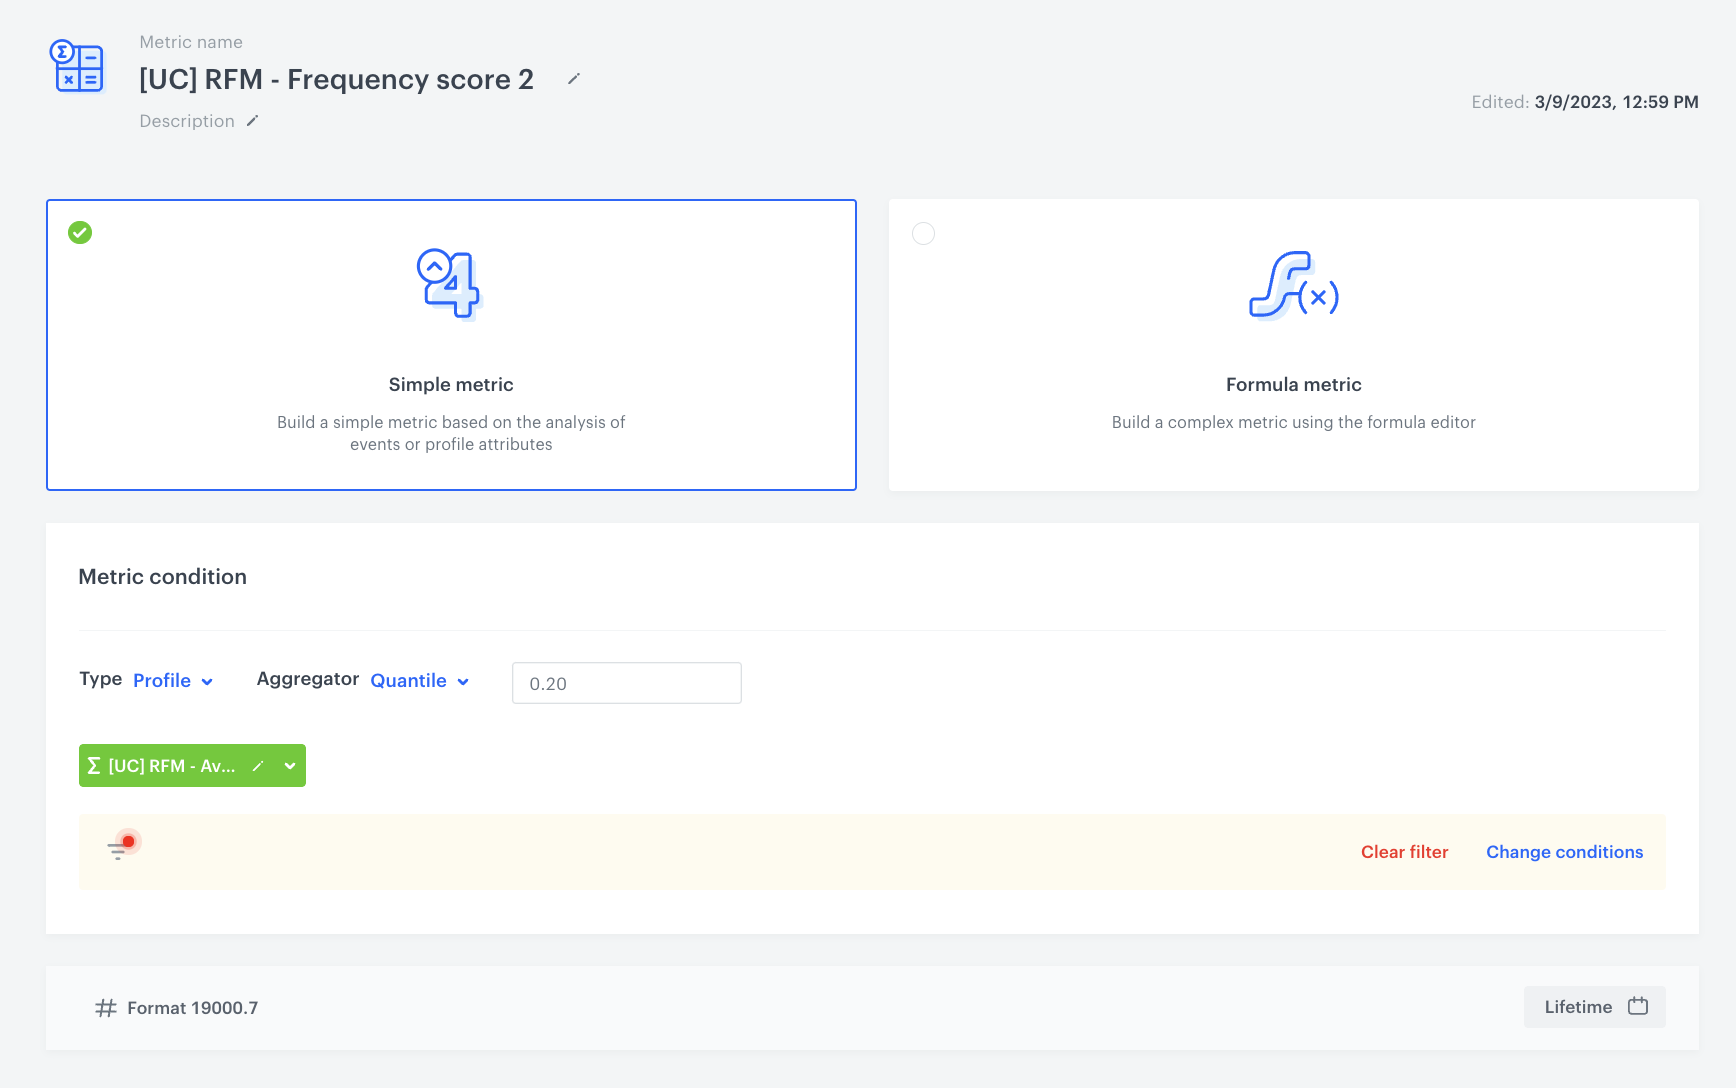
7. For the following segments, add the conditions listed below:
- For the 400 segment: more than the value of the `0.20` quantile **AND** less than `0.40` quantile
- For the 300 segment: more than the value of the `0.40` quantile **AND** less than `0.60` quantile
- For the 200 segment: more than the value of the `0.60` quantile **AND** less than `0.80` quantile
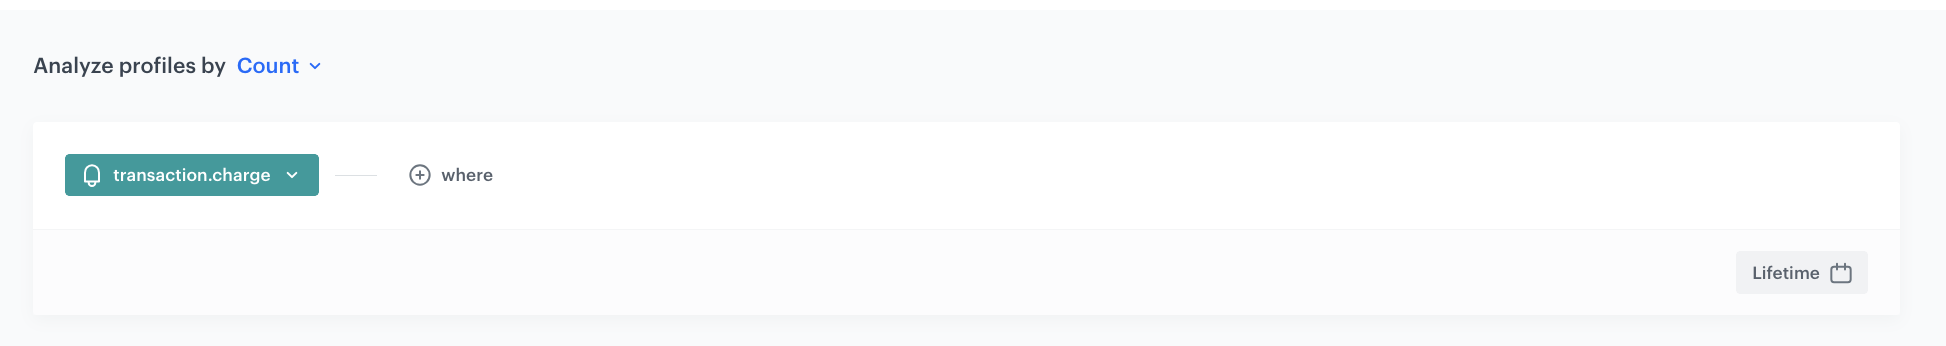
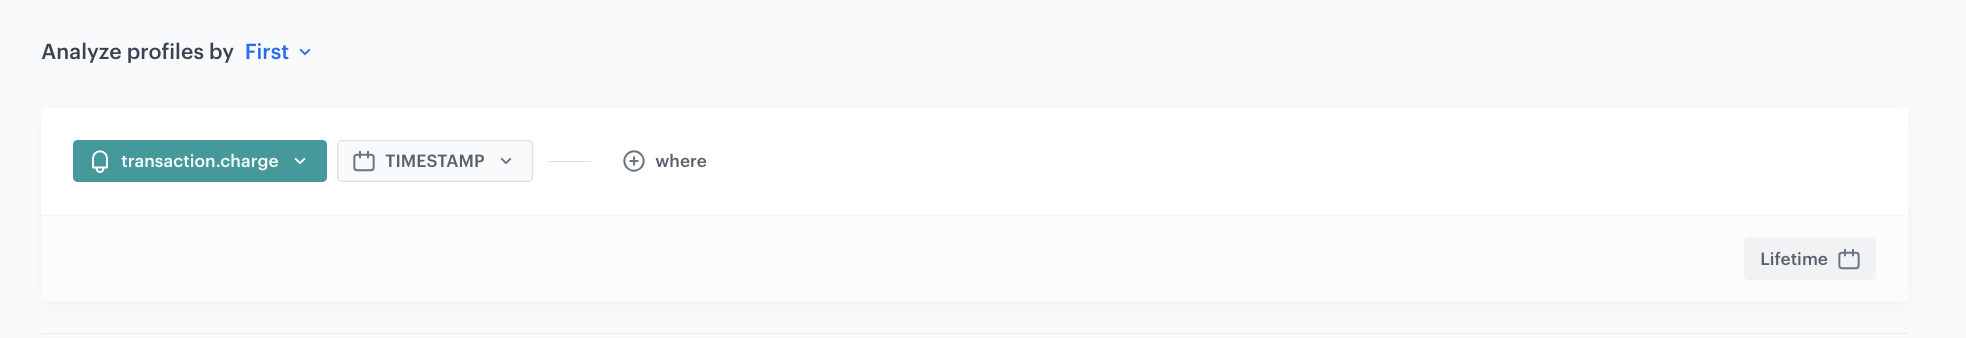
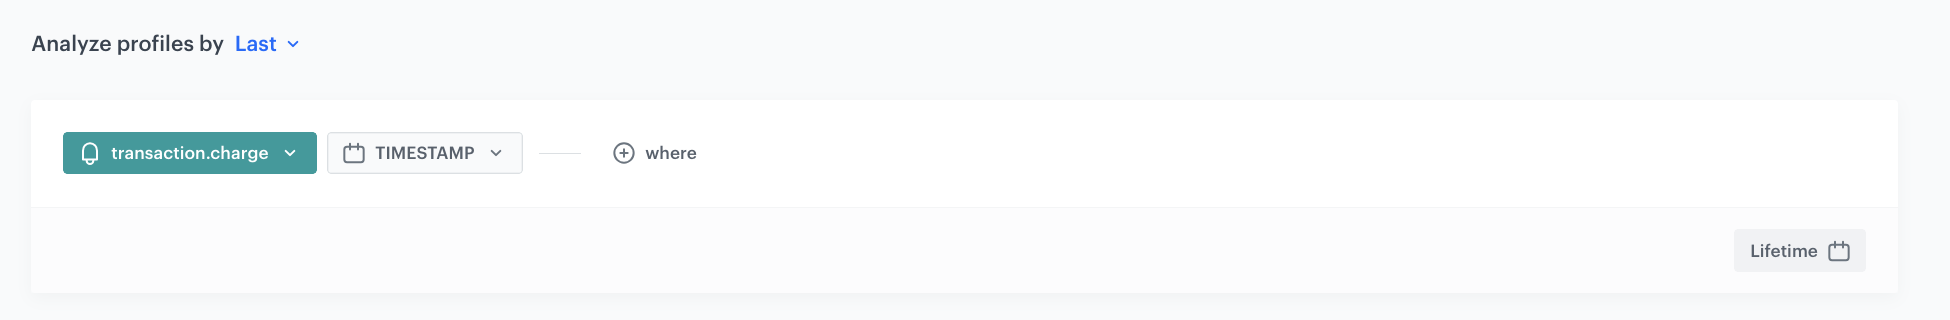
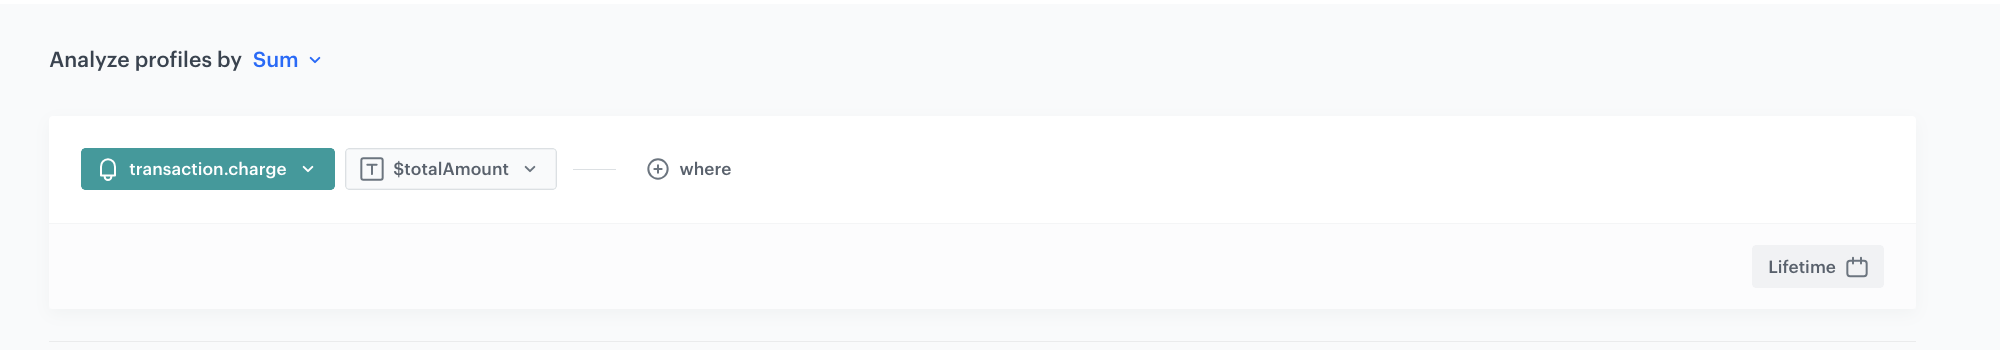
- For the 100 segment: less than the value of the `0.80` quantile **AND** segment of loyal customers **AND** add the **transaction.charge** event with the **Lifetime** time range.
icon.
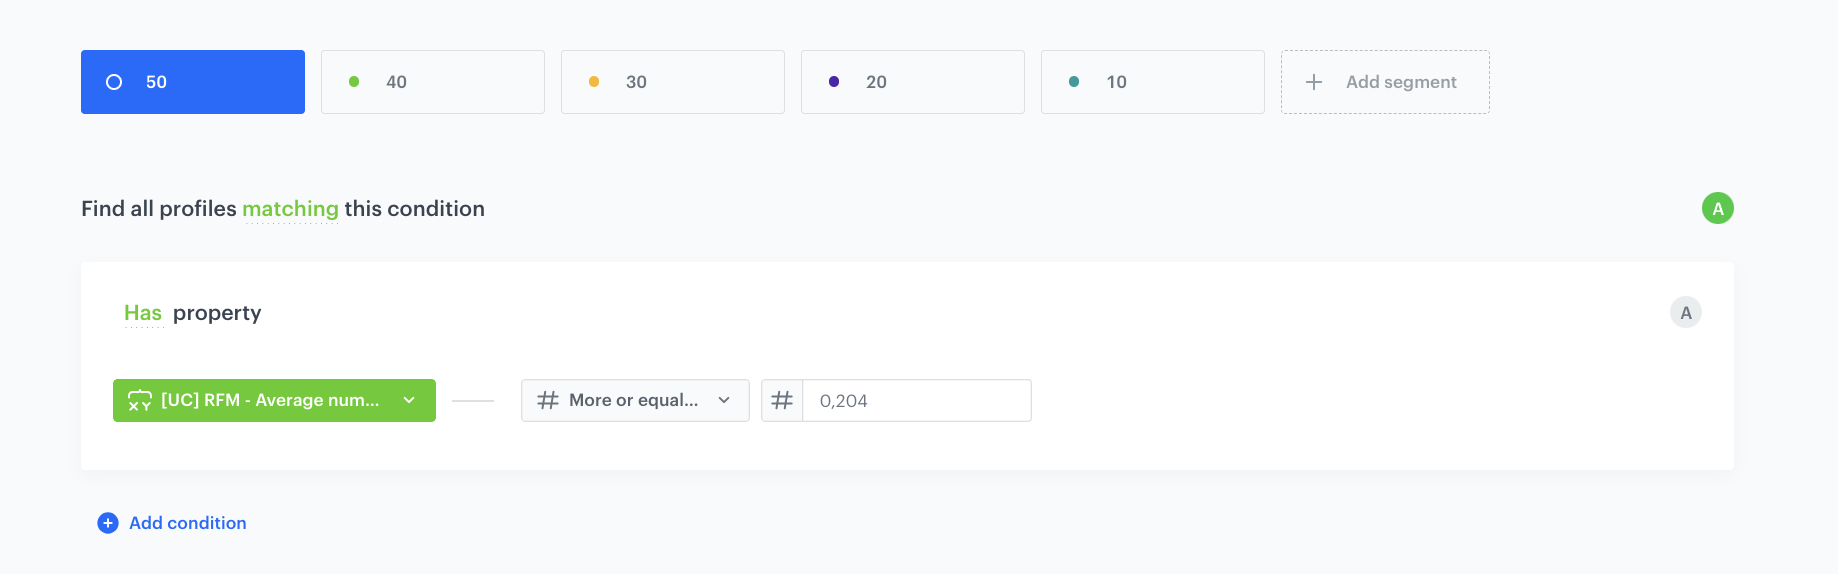
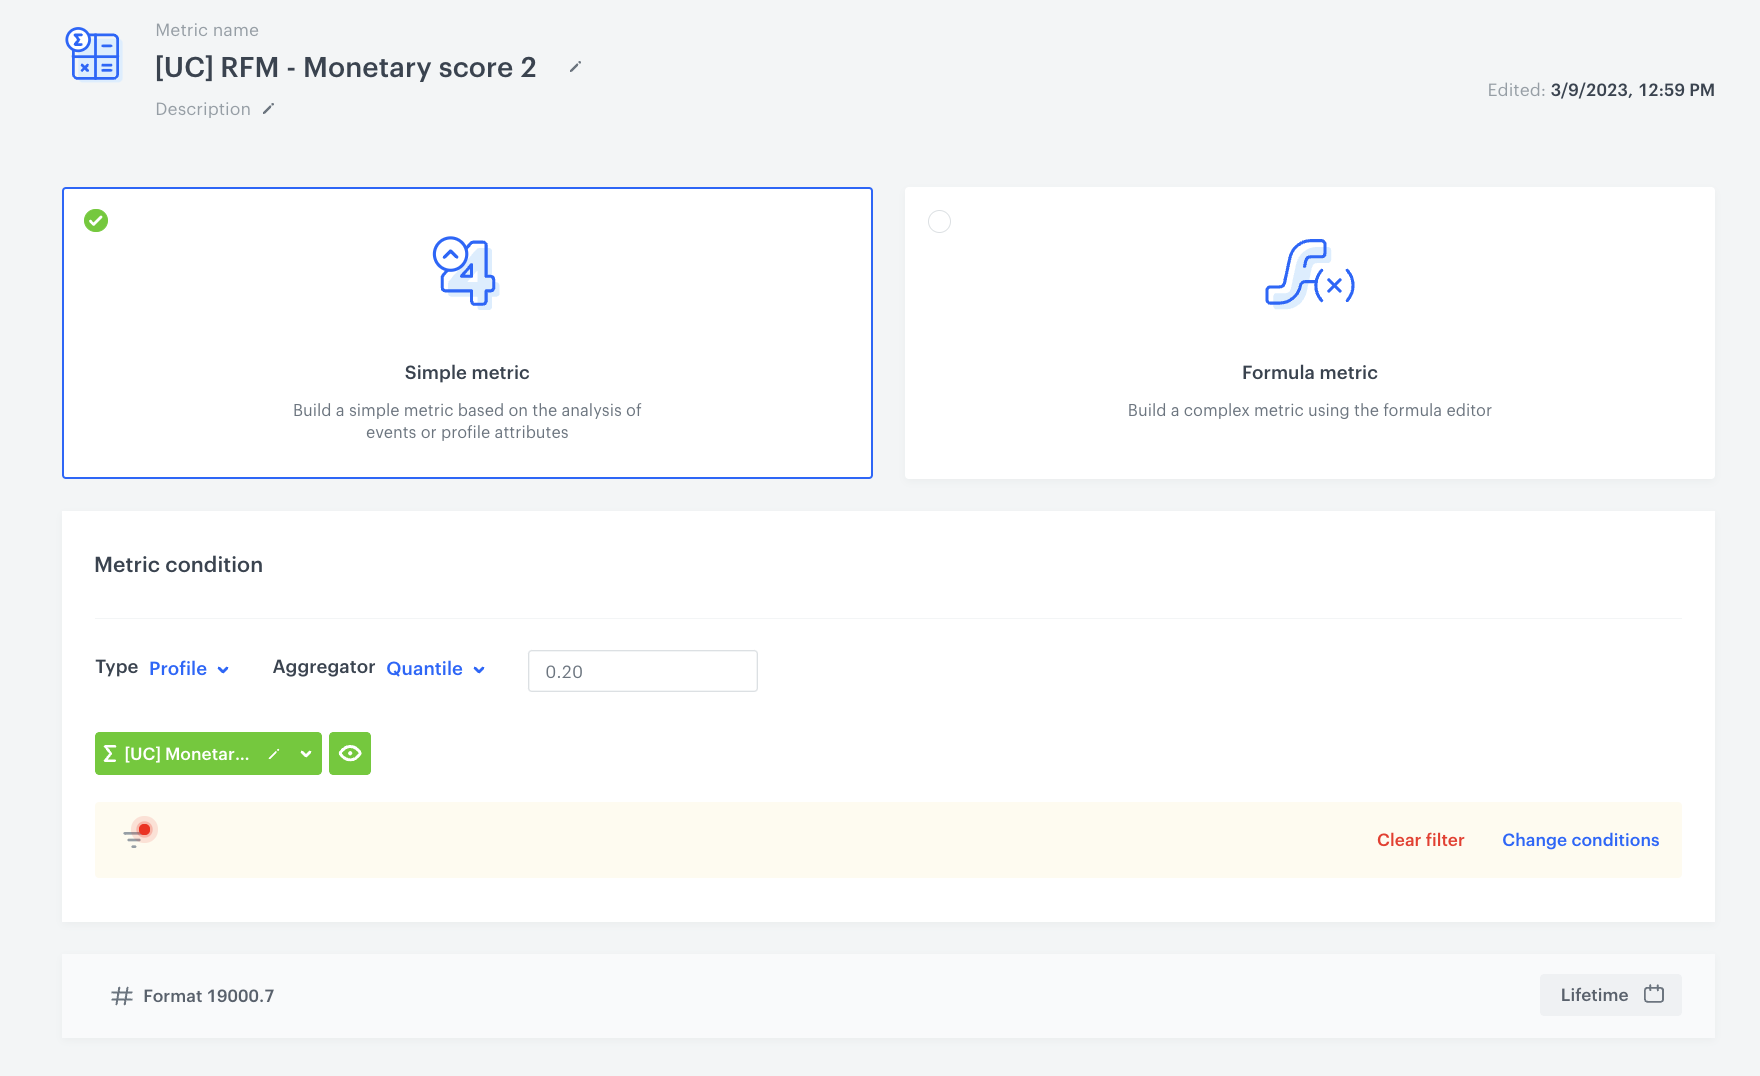
7. For the following segments, add the conditions listed below:
- For the 400 segment: more than the value of the `0.20` quantile **AND** less than `0.40` quantile
- For the 300 segment: more than the value of the `0.40` quantile **AND** less than `0.60` quantile
- For the 200 segment: more than the value of the `0.60` quantile **AND** less than `0.80` quantile
- For the 100 segment: less than the value of the `0.80` quantile **AND** segment of loyal customers **AND** add the **transaction.charge** event with the **Lifetime** time range.