In this scenario, you will create sample segmentation that allows you to divide your clients into segments based on their average number of transactions per month. You may use that information further for targeted communication with promotions for a specific group.
## Prerequisites
---
- Add a [tracking code](/developers/web/installation-and-configuration) to your website.
- Become familiar with [aggregates](/docs/analytics/aggregates) and [expressions](/docs/analytics/expressions).
## Process
---
1. Create [aggregates](/use-cases/segmentation-average-transactions#create-aggregates).
2. Create [expression](/use-cases/segmentation-average-transactions#create-expressions).
3. Create [segmentation](/use-cases/segmentation-average-transactions#create-segmentation).
## Create aggregates
---
In the first part of the process, create two aggregates which will be used later for creating expressions:
- An [aggregate that counts a total number of transactions](/use-cases/segmentation-average-transactions#total-number-of-transactions-for-a-customer) a customer made
- An [aggregate that returns the timestamp of the first transaction](/use-cases/segmentation-average-transactions#timestamp-of-the-first-customers-transaction) a customer made
### Total number of transactions for a customer
1. Go to **Behavioral Data Hub > Live Aggregates > Create aggregate**.
2. As the aggregate type, select **Profile**.
2. Enter the name of the aggregate, for example `Total number of transactions`.
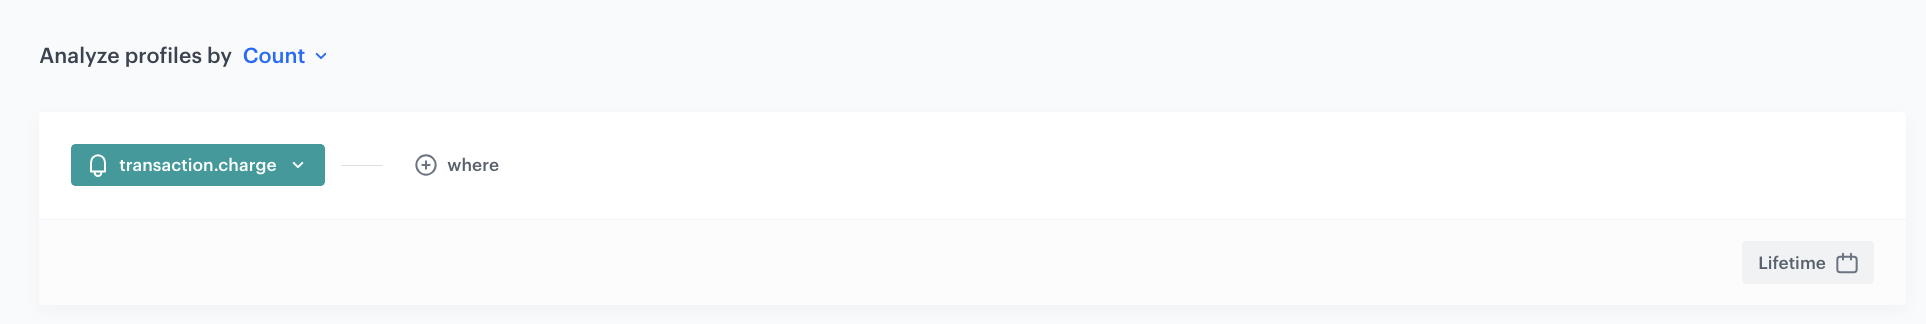
3. Set **Analyze profiles by** to **Count**.
4. From the **Choose event** dropdown list, select **transaction.charge**
5. In the date picker, select **Lifetime**.
6. Save the aggregate.
The formula of the aggregate
### Timestamp of the first customer's transaction
1. Go to **Behavioral Data Hub > Live Aggregates > Create aggregate**.
2. As the aggregate type, select **Profile**.
2. Enter the name of the aggregate, for example `Timestamp of first transaction`.
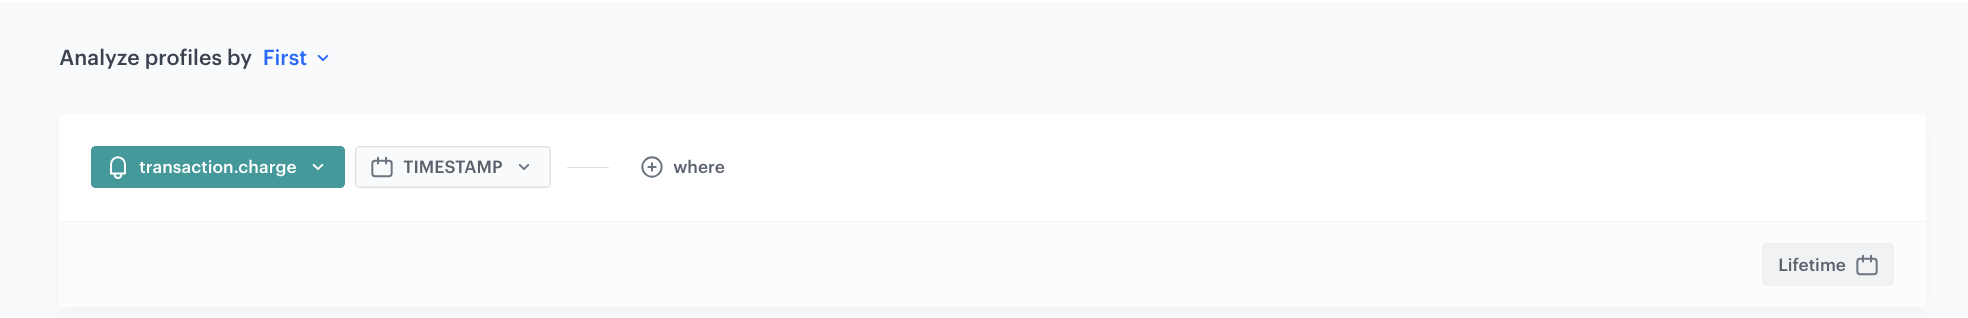
3. Set **Analyze profiles by** to **First**.
4. From the **Choose event** dropdown list, select **transaction.charge**.
5. As the event parameter, select **TIMESTAMP**.
6. In the date picker, select **Lifetime**.
7. Save the aggregate.
The formula of the aggregate
## Create expressions
---
In the next part of the process, create 4 expressions. The fourth one uses the results of the first three to calculate the average number of transactions, and is later used as an attribute for creating a segmentation.
The list of expressions:
- An [expression that returns the timestamp of the current date](/use-cases/segmentation-average-transactions#timestamp-of-the-current-day)
- An [expression that returns the timestamp of the first customer's transaction](/use-cases/segmentation-average-transactions#timestamp-of-the-first-customers-transaction) expressed in milliseconds
- An [expression that returns the number of months that passed since the first transaction](/use-cases/segmentation-average-transactions#number-of-months-since-the-first-transaction)
- An [expression that returns the average number of transactions per month](/use-cases/segmentation-average-transactions#average-number-of-transactions-per-month)
### Timestamp of the current day
1. Go to **Behavioral Data Hub > Expressions > New expression**.
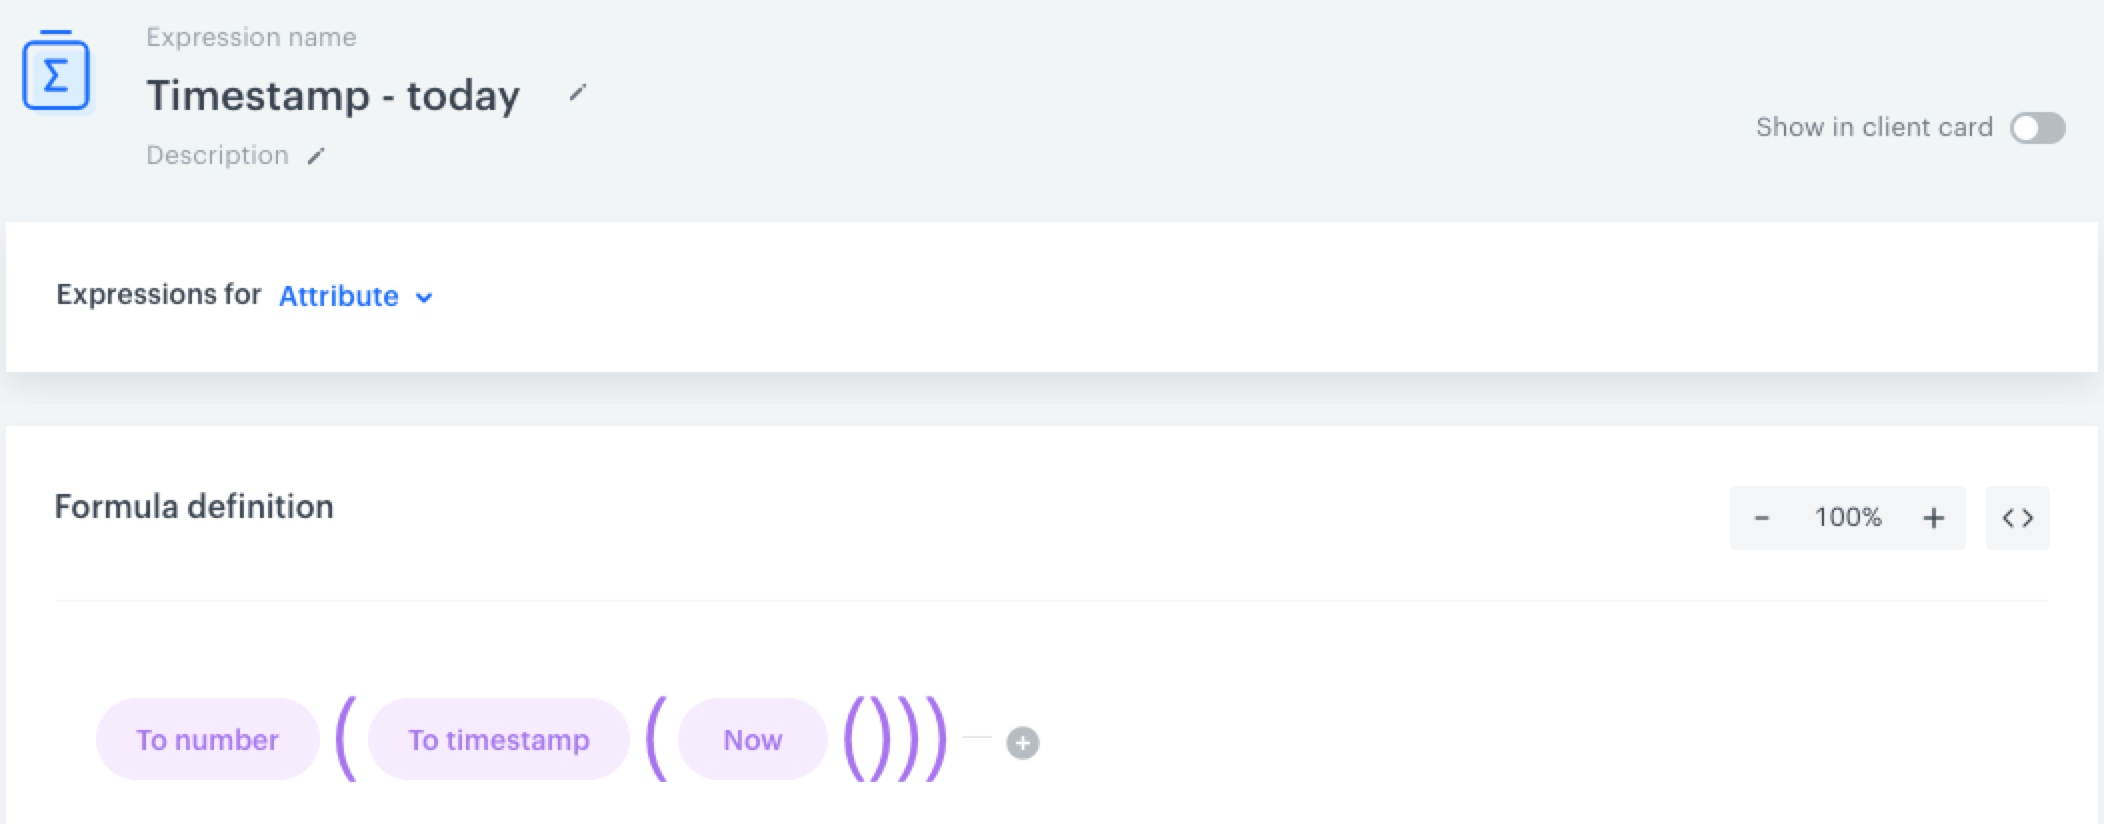
2. Enter the name of the expression, for example `Timestamp - today`.
3. As the expression type, select **Attribute**.
4. Create the following formula of the expression:
5. Save the expression.
The formula of the expression
### Timestamp of the customer's first transaction in milliseconds
1. Go to **Behavioral Data Hub > Expressions > New expression**.
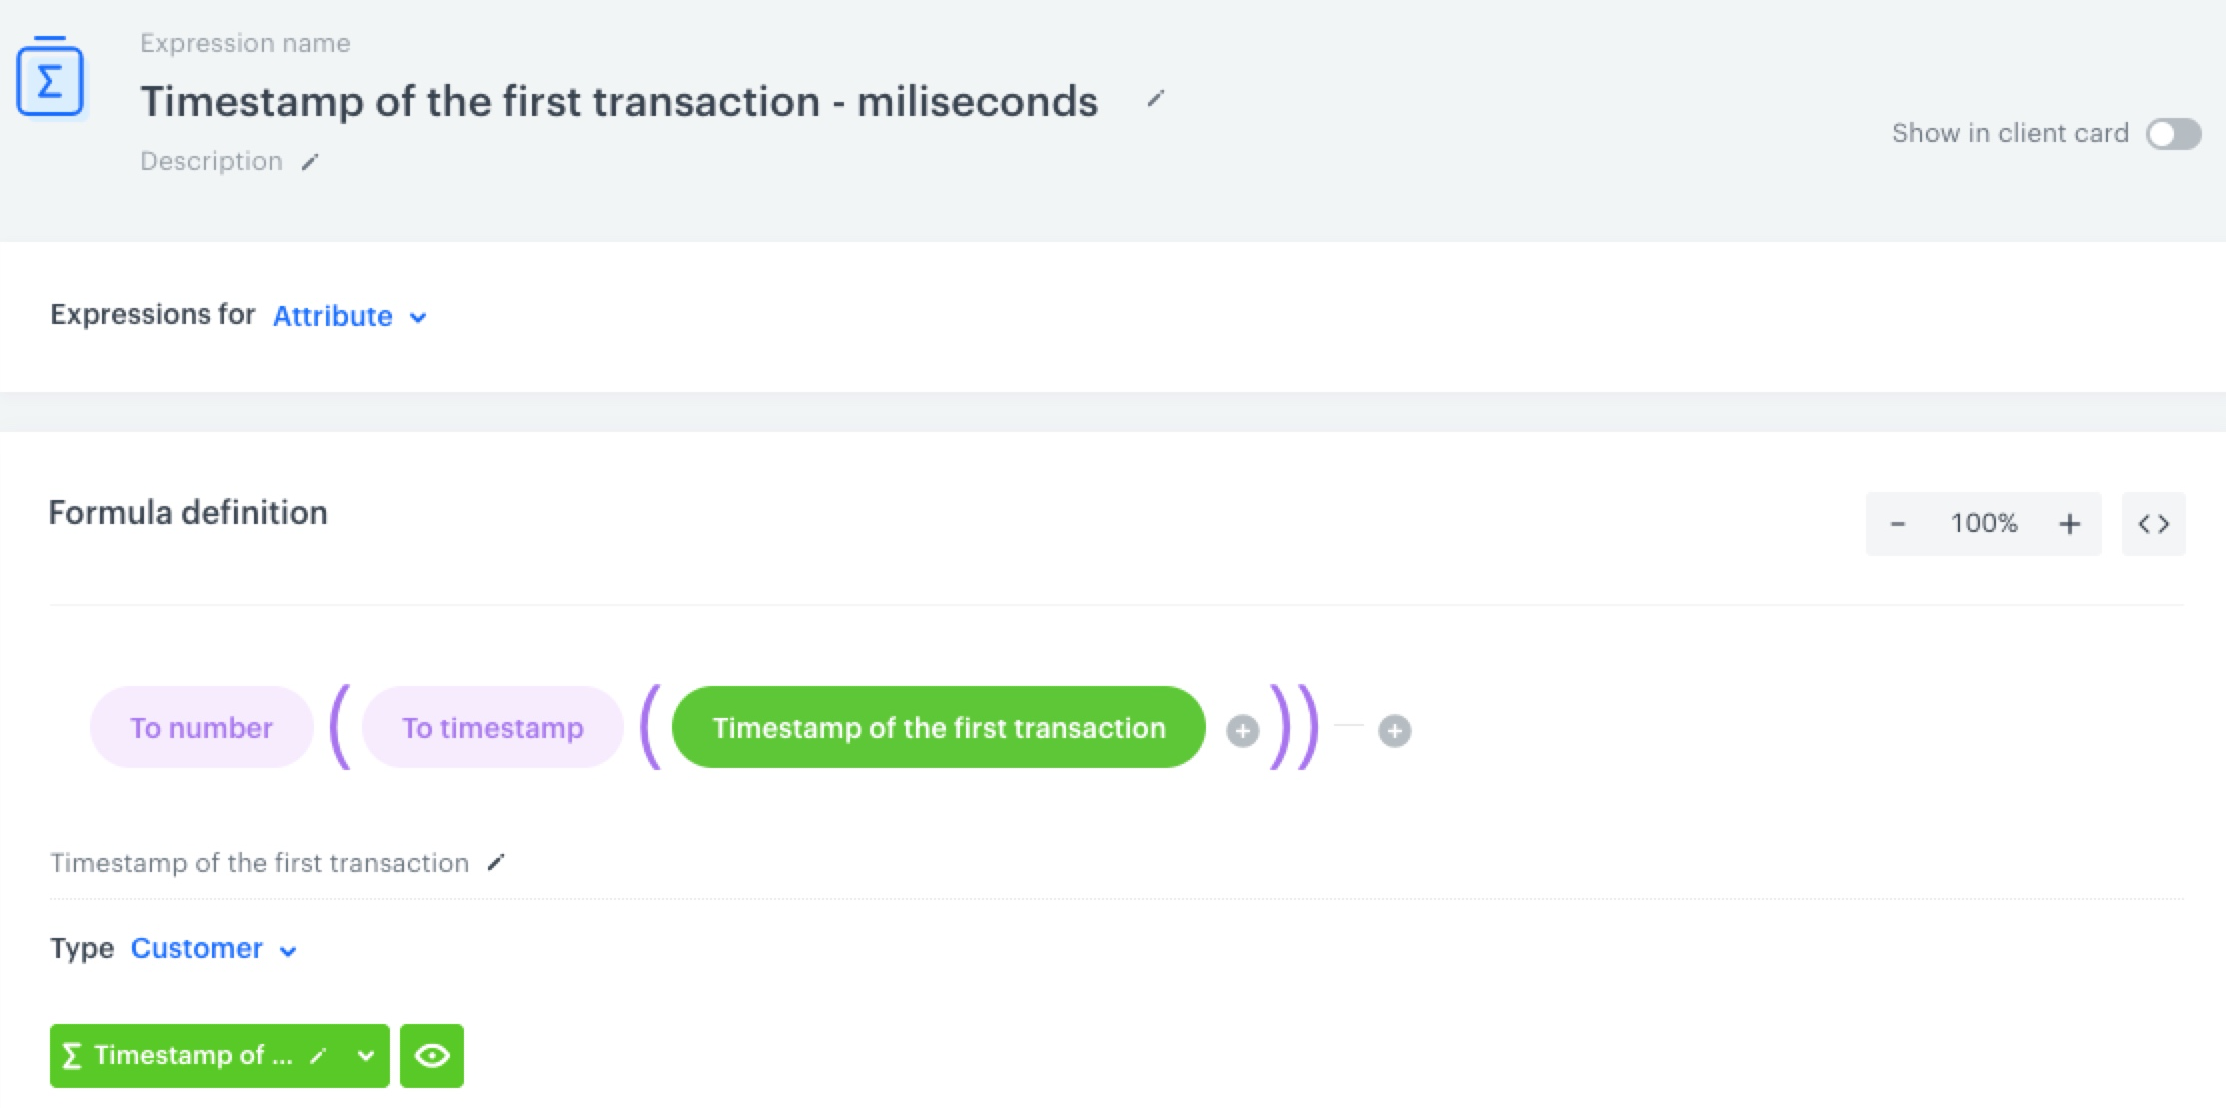
2. Enter the name of the expression, for example `Timestamp of the first transaction - milliseconds`.
3. As the expression type, select **Attribute**.
4. Create the following formula of the expression:
5. Save the expression
The formula of the expression
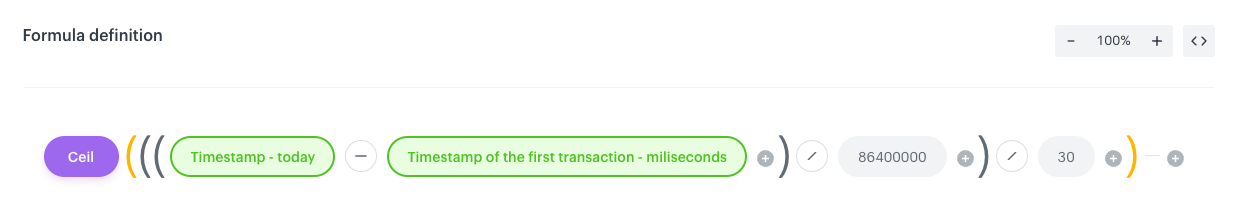
### Number of months since the first transaction
1. Go to **Behavioral Data Hub > Expressions > New expression**.
2. Enter the name of the expression, for example `Months since the first transaction`.
3. As the expression type, select **Attribute**.
4. Create the following formula of the expression.
5. Save the expression.
The formula of the expression
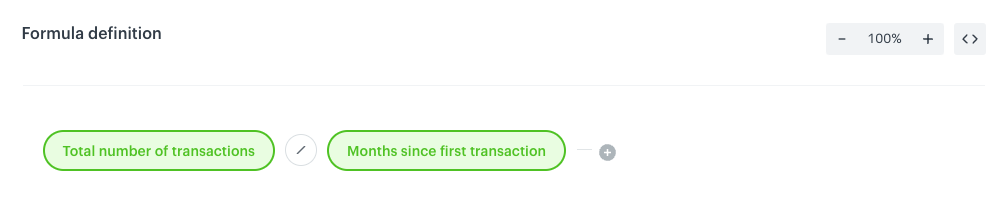
### Average number of transactions per month
1. Go to **Behavioral Data Hub > Expressions > New expression**.
2. Enter the name of the expression, for example `Average number of transactions per month`.
3. As the expression type, select **Attribute**.
4. Create the following formula of the expression:
5. Save the expression.
The formula of the expression
## Create segmentation
---
In the final part of the process, create a segmentation that organizes customers into three groups:
- More than 2 transactions per month - It gathers the customers who make more than 2 transactions per month on average
- 2 transactions per month - It gathers the customers who make 2 transactions per month on average
- Less than 2 transactions per month - It gathers the customers who make less than 2 transactions per month on average
1. Go to **Decision Hub > Segmentations > New segmentation**.
2. Rename **Segment A** to `More than 2`.
3. Click **Add segment**.
4. Rename **Segment B** to `2`.
5. Click **Add segment**.
6. Rename **Segment C** to `Less than 2`.
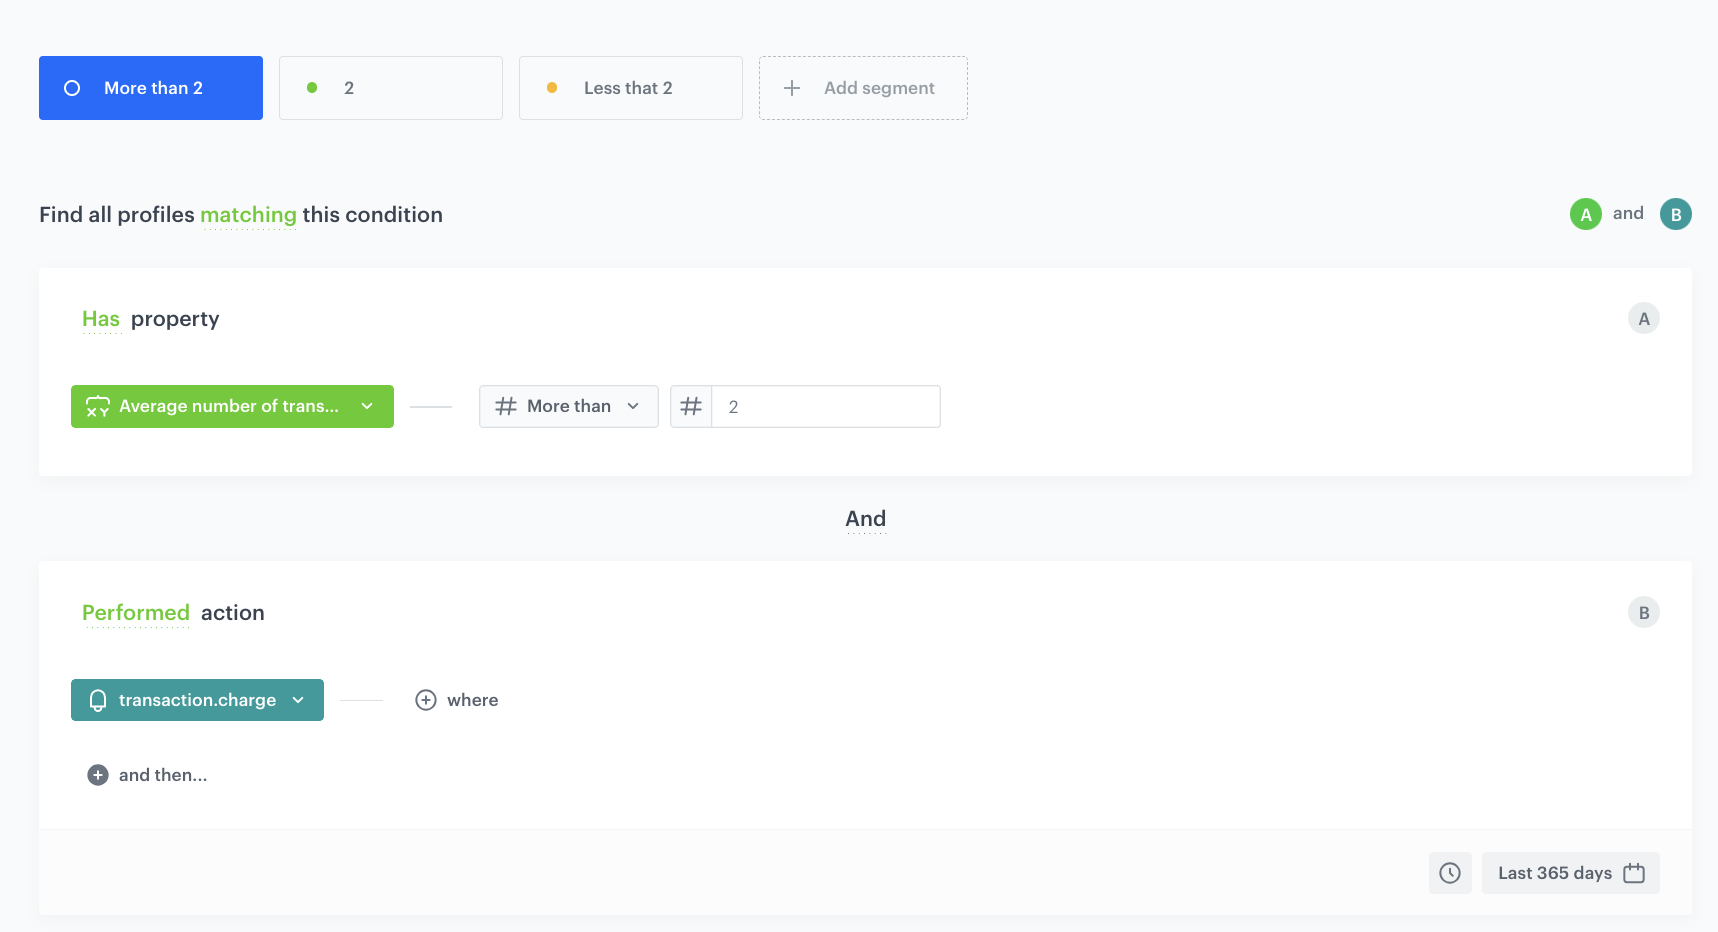
7. Configure the conditions of each segment:
More than 2
The conditions of the segmentation
5. Save the segmentation.
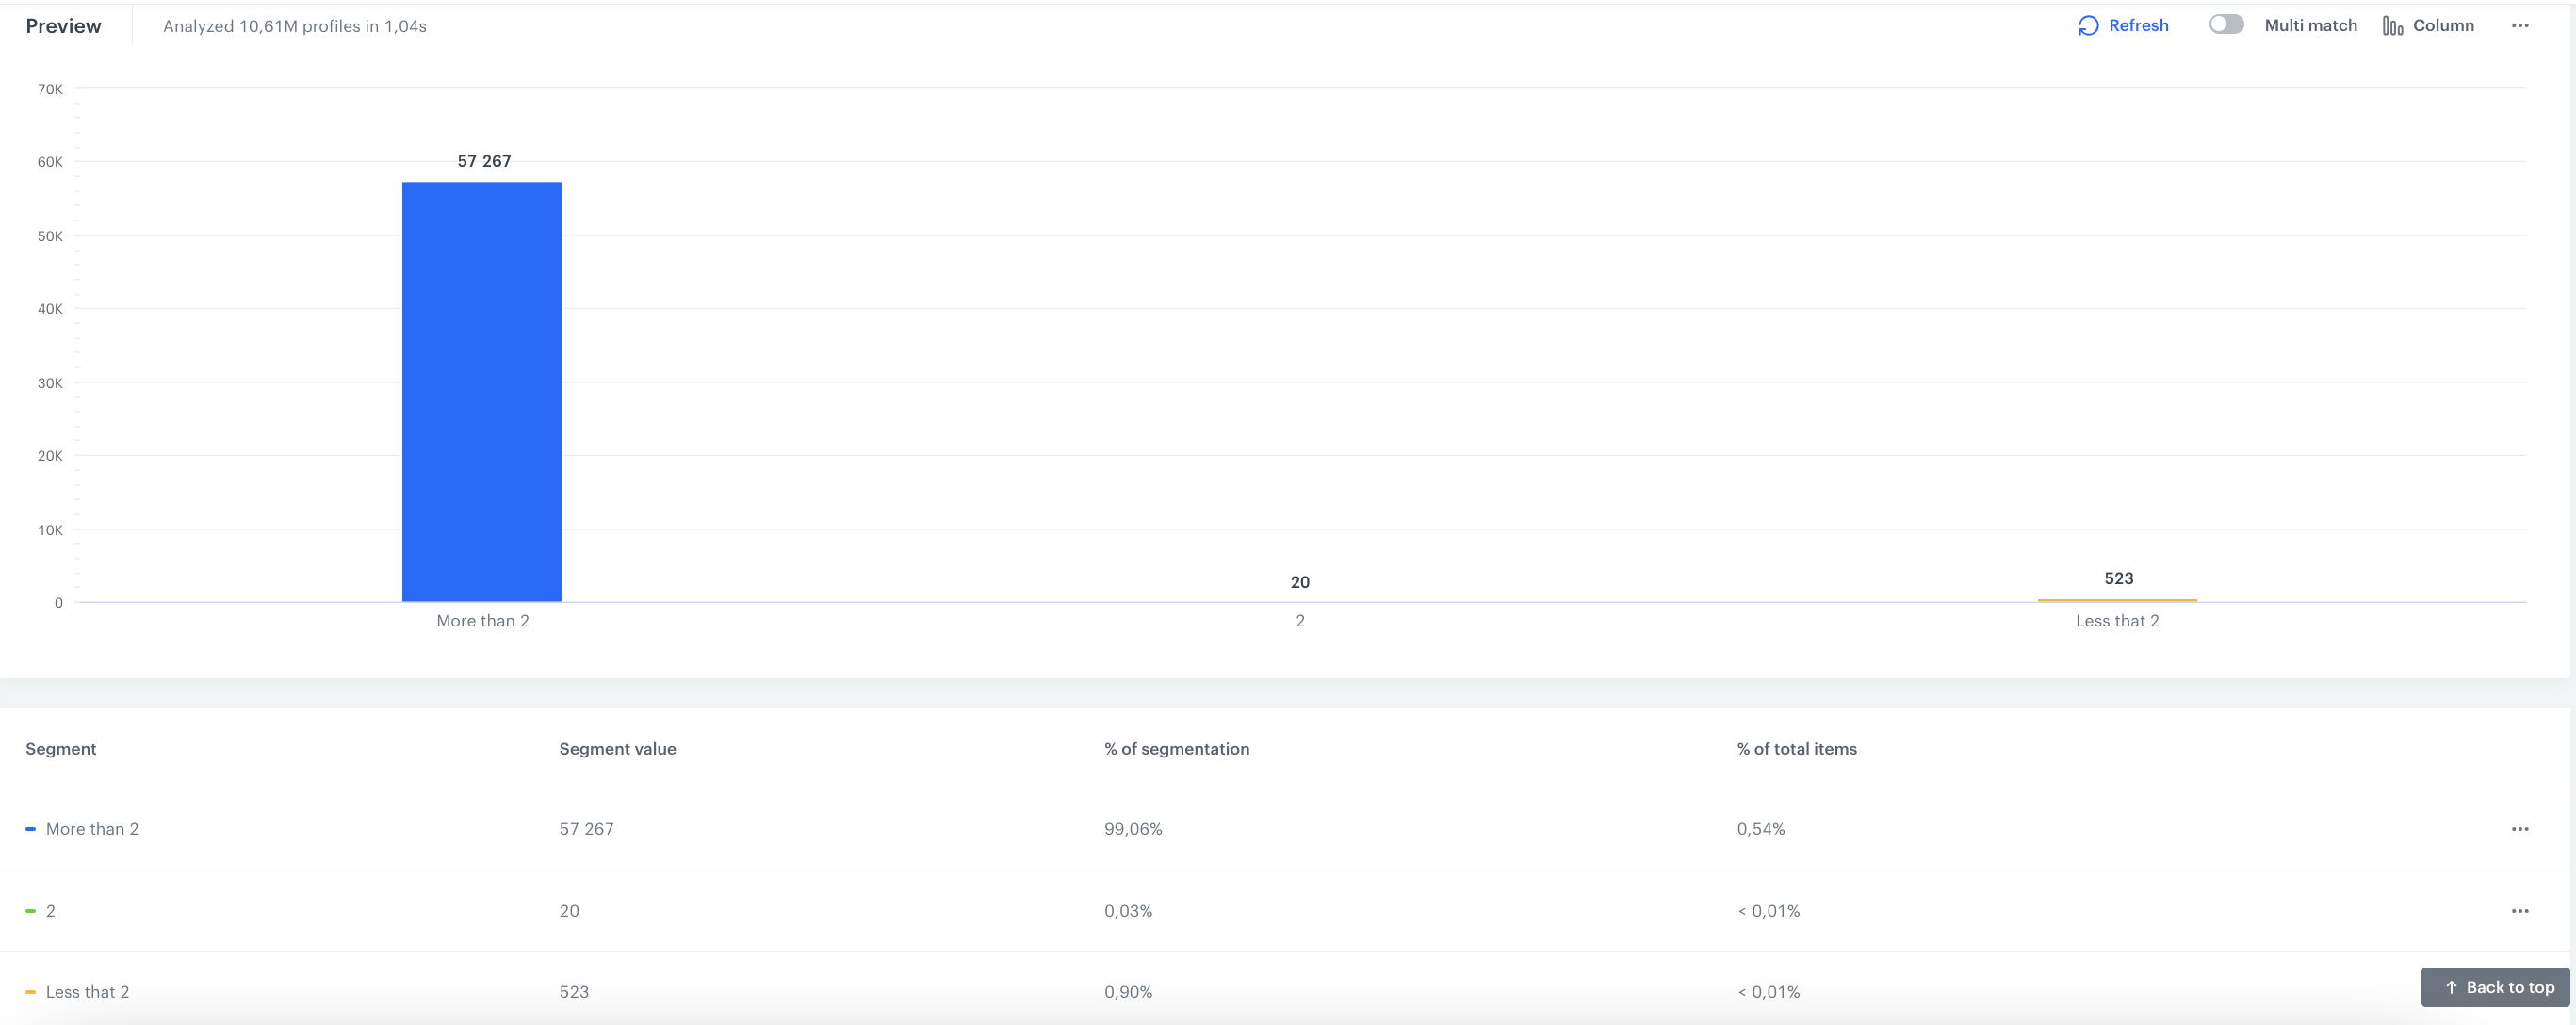
Below the settings of the segmentation, you can preview how your customer base splits according to the defined conditions.
6. Click **Show preview**.
You receive the number of customers in each segment and the percentage of each segment in relation to the whole population in the segmentation.
Additionally:
- You can change the chart type - pie chart and column chart
- You can also export the information to CSV/XLSX (data) or JPEG/PNG/PDF (chart)
The preview of the segmentation
## Check the use case set up on the Synerise Demo workspace
---
You can also check the configuration directly in Synerise Demo workspace:
- [segmentation](https://app.synerise.com/analytics-v2/segmentations/24c48af2-81a0-452c-a2a6-459dc376fb5a)
- [aggregate that counts a total number of transactions](https://app.synerise.com/analytics/aggregates/81890447-8c0a-3565-8742-f7f8ff270e03)
- [aggregate that returns the timestamp of the first transaction](https://app.synerise.com/analytics/aggregates/378f75ac-c7a3-3658-bf56-174facc48587)
- [expression that returns the timestamp of the current date](https://app.synerise.com/analytics/expressions/4be2dabc-0051-4dd5-97ee-bb65a372fac5)
- [expression that returns the timestamp of the first customer's transaction](https://app.synerise.com/analytics/expressions/7562b3bc-2dab-4714-9251-c65d6be01a6d)
- [expression that returns the number of months that passed since the first transaction](https://app.synerise.com/analytics/expressions/430e6de0-04ab-4974-9cac-4d734ef9099d)
- [expression that returns the average number of transactions per month](https://app.synerise.com/analytics/expressions/0fb2c6ff-ffe0-4907-aa35-ae2e31812e97)
If you’re our partner or client, you already have automatic access to the **Synerise Demo workspace (1590)**, where you can explore all the configured elements of this use case and copy them to your workspace.
If you’re not a partner or client yet, we encourage you to fill out the contact [form](https://demo.synerise.com/request) to schedule a meeting with our representatives. They’ll be happy to show you how our demo works and discuss how you can apply this use case in your business.
## Read more
---
- [Segmentation](/docs/analytics/segmentations)