This use case is a short continuation of the [Propensity - brand](/use-cases/propensity-brand) use case and it describes the process of creating a segmentation based on the score of the propensity prediction. The result of the segmentation shows the assignment of customers to the likelihood of purchase of particular products.
## Prerequisites
---
- Add a [tracking code](/developers/web/installation-and-configuration) to your website.
- Create a [Propensity prediction](/use-cases/propensity-brand) that produces the 5-point score (very low, low, medium, high, and very high).
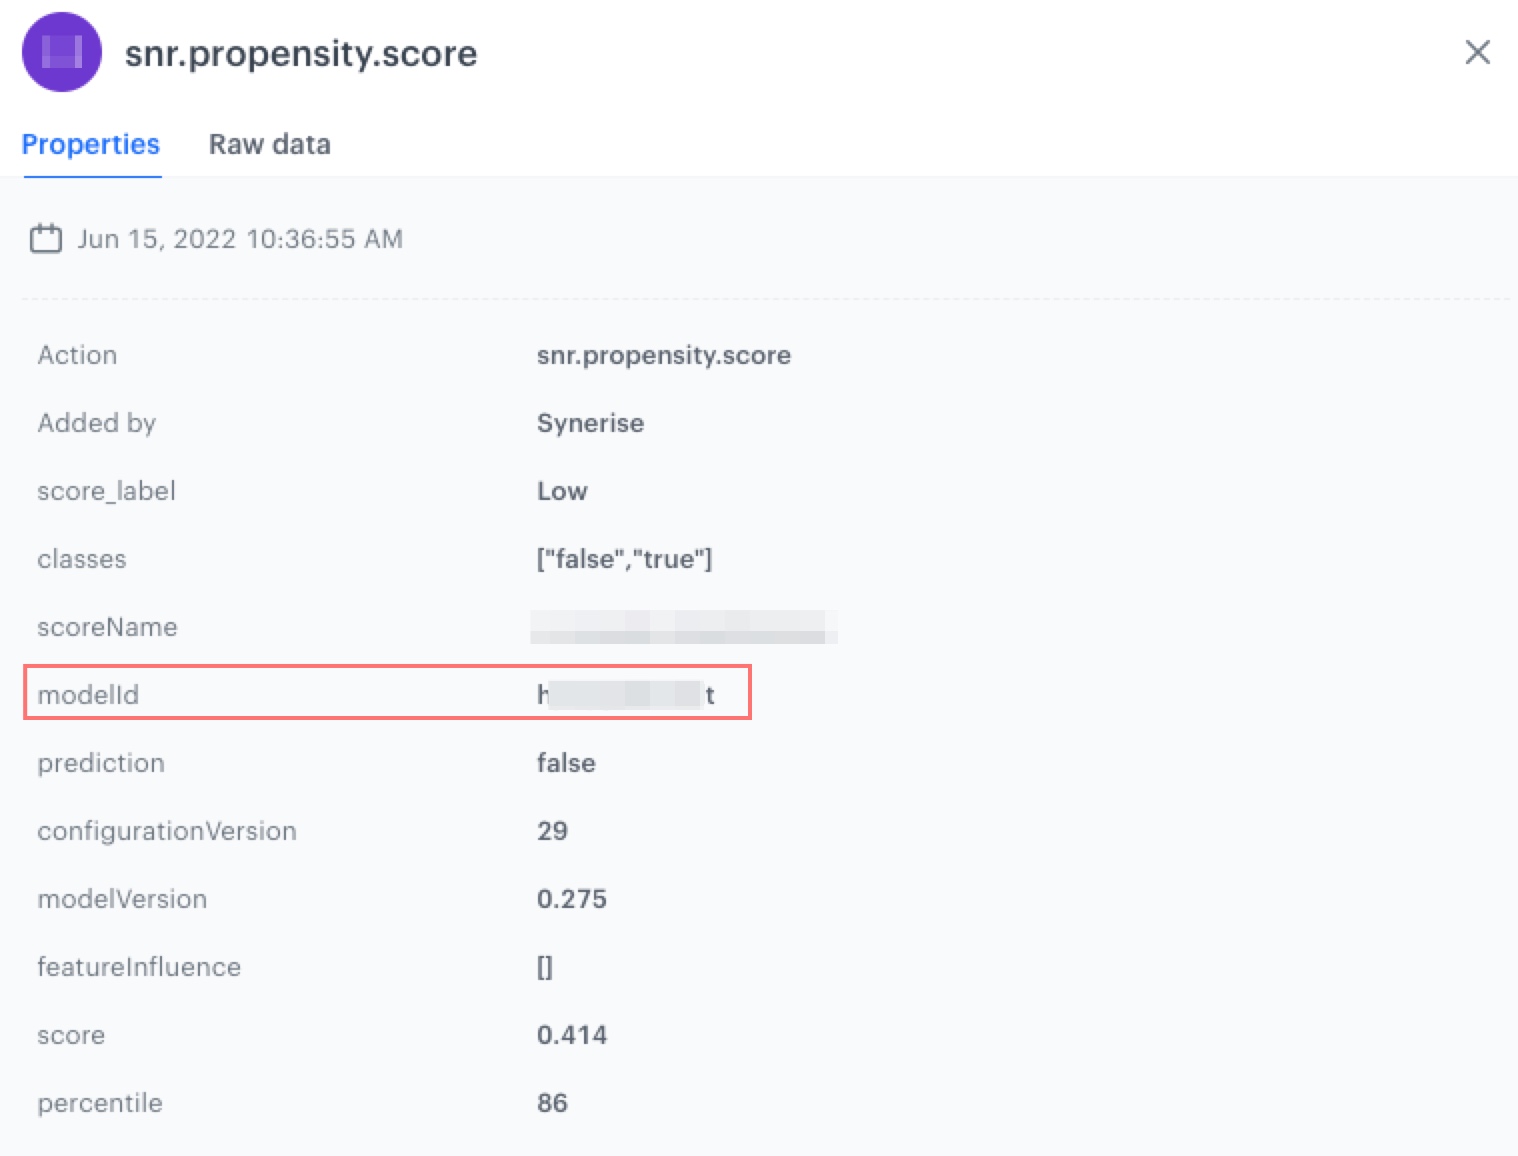
- Make a note of the `modelId` parameter (available in the parameters of the `snr.propensity.score` event).
Click to see where to find modelId
Conditions of the segmentation
## Process
---
In this use case, you will go through the following steps:
1. [Create an aggregate](/use-cases/segmentation-propensity-based#create-an-aggregate).
2. [Create a segmentation](/use-cases/segmentation-propensity-based#create-segmentation).
## Create an aggregate
---
As the first part of the process, create an aggregate that returns the latest score of the propensity prediction of a specific model.
1. Go to **Behavioral Data Hub > Live Aggregates > Create aggregate**.
2. As the aggregate type, select **Profile**.
2. Enter a meaningful name of the aggregate.
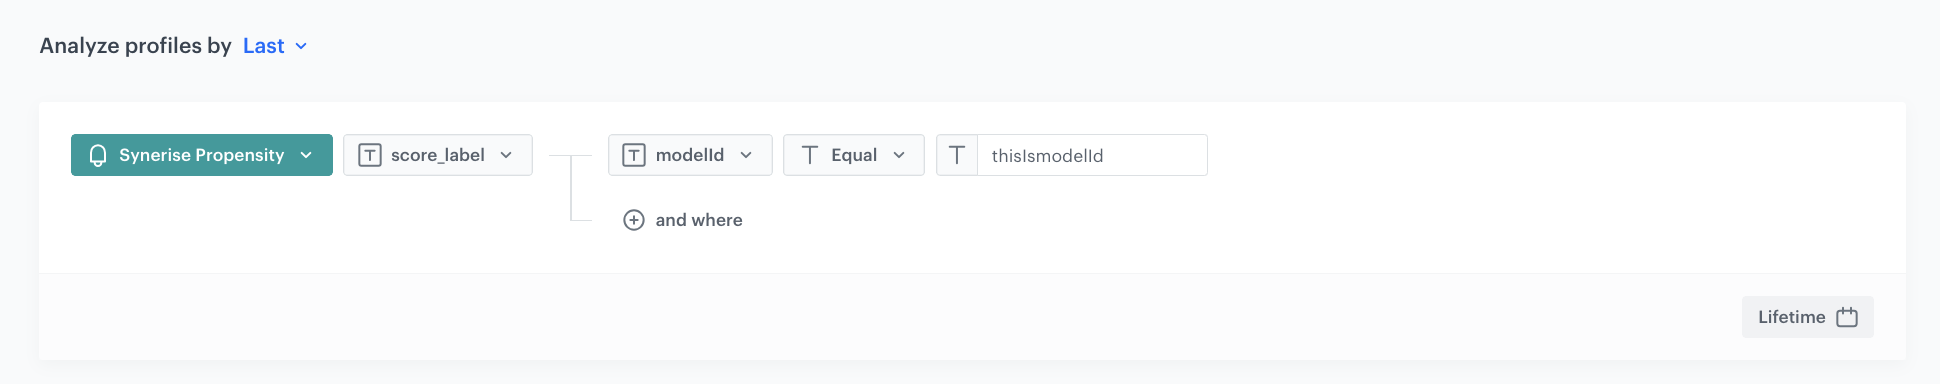
2. Set **Analyze profiles by** to **Last**.
3. Select the **snr.propensity.score** event.
4. As the event parameter, select **score_label**.
5. Click **+ where**.
6. From the **Choose parameter** dropdown list, select **modelId**.
7. As the logical operator, select **Equal**.
8. In the text field, enter the value of the modelId parameter.
9. As the date range, select **Lifetime**.
10. Save the aggregate.
Conditions of the aggregate
## Create segmentation
---
1. Go to **Decision Hub > Segmentations > New segmentation**.
2. Enter the name of the segmentation.
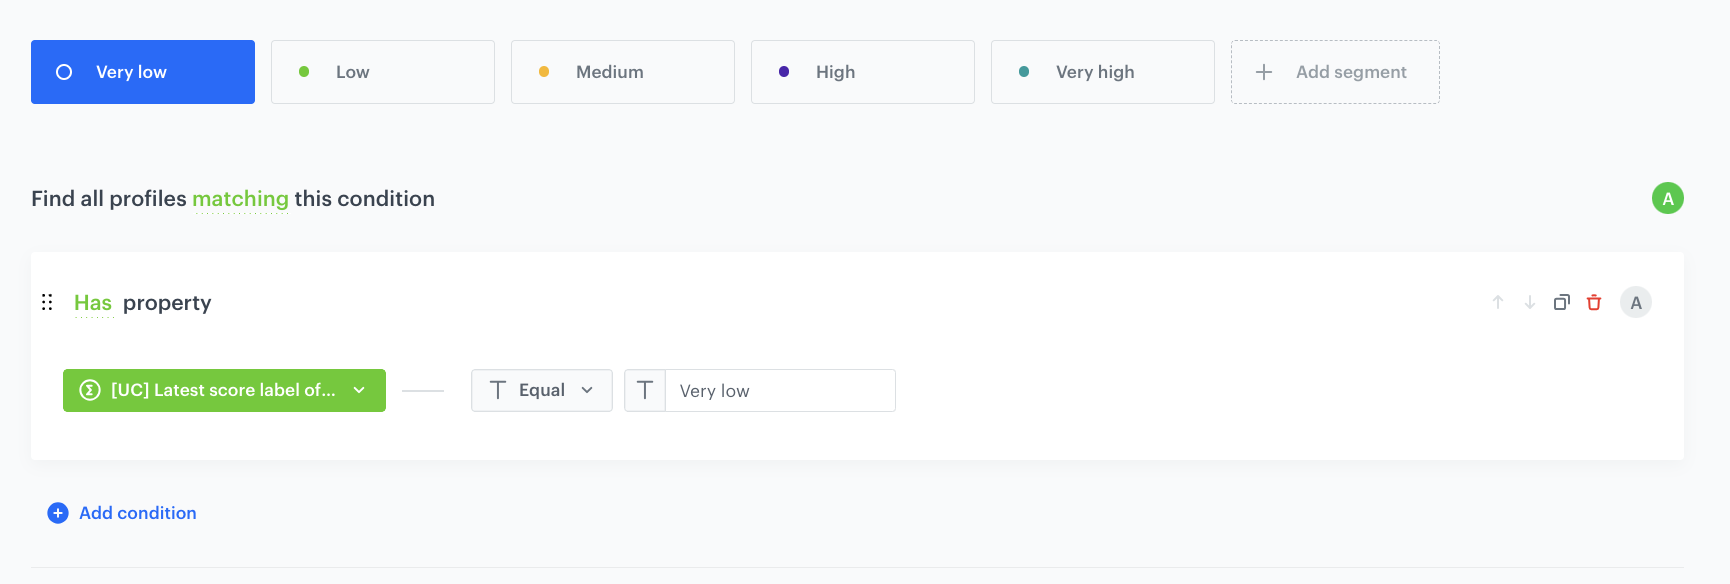
3. By clicking **Add segment** add five segments and name each of them as follows: `Very low`, `Low`, `Medium`, `High`, `Very high`.
Very low
Conditions of the segmentation
### Preview segmentation
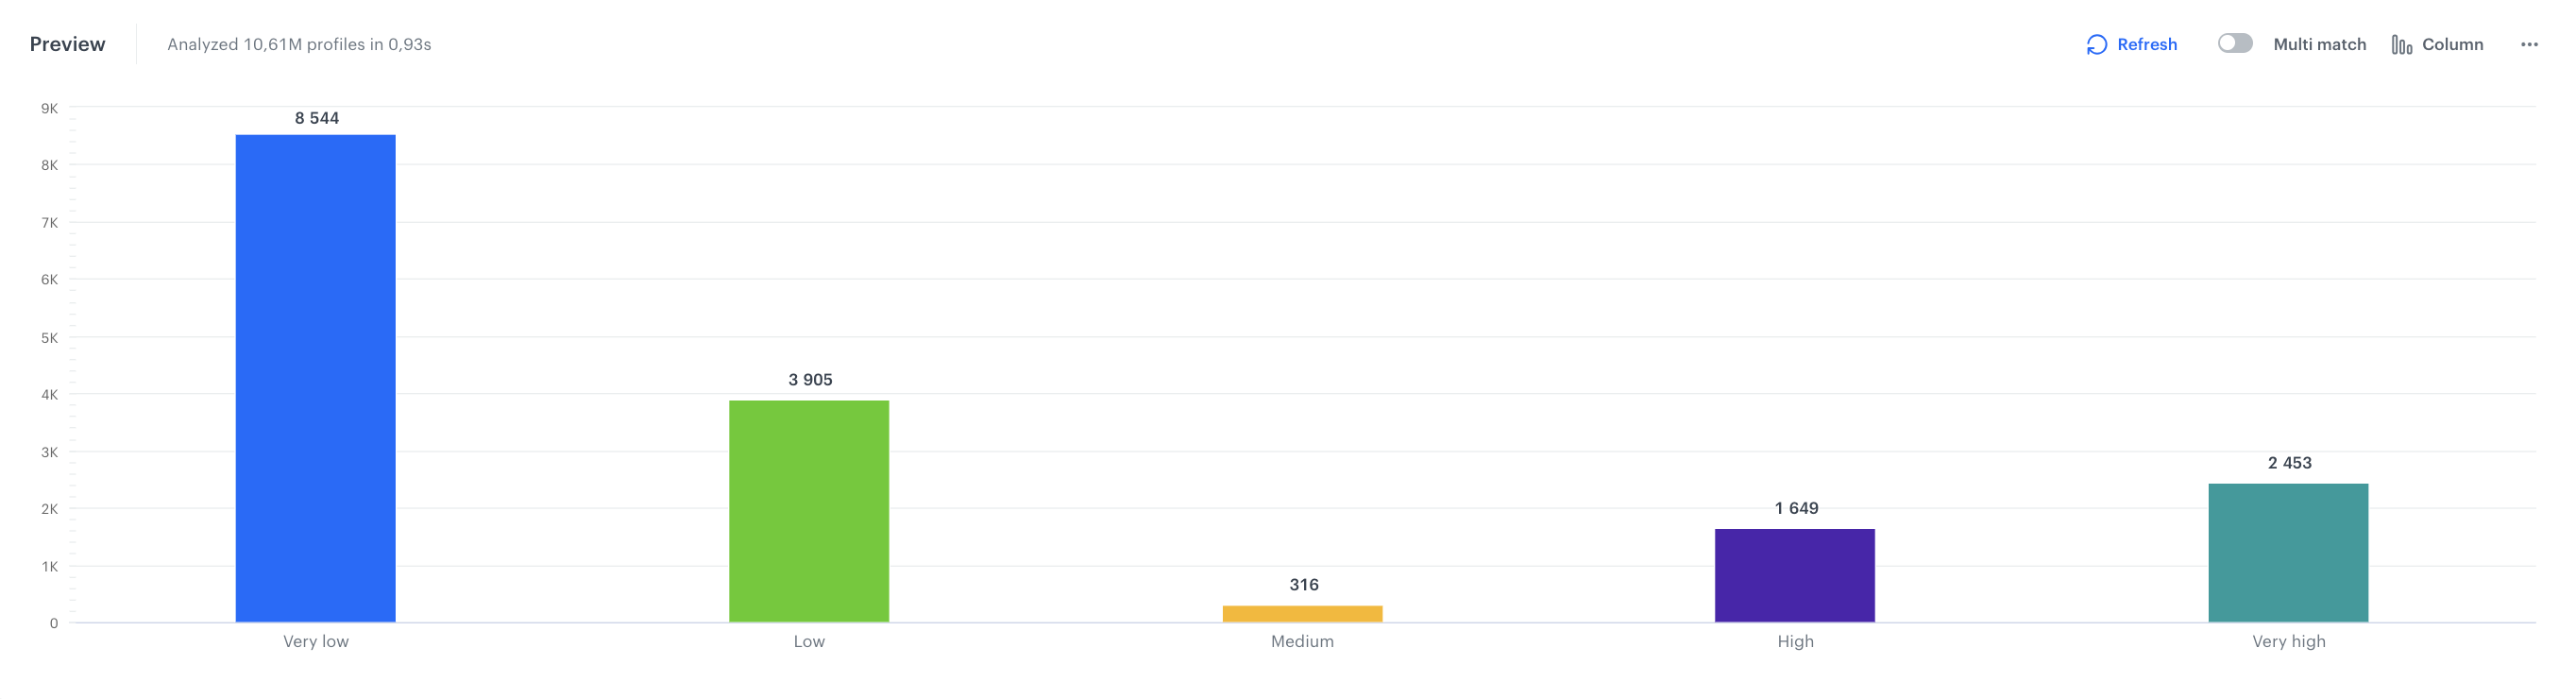
1. Click **Show preview**.
You receive the number of customers in each segment and the percentage of each segment in relation to the whole population in the segmentation.
2. Additionally you can change the chart type - pie chart and column chart. You can also export the information to CSV/XLSX (data) or JPEG/PNG/PDF (chart).
Preview of the segmentation
## Check the use case set up on the Synerise Demo workspace
---
You can check the configuration of every element of this process directly in Synerise Demo workspace:
- [Aggregate](https://app.synerise.com/analytics/aggregates/930e05c6-ec5f-3ade-a00b-c638a0f5bb0b)
- [Segmentation](https://app.synerise.com/analytics-v2/segmentations/07e00c22-e99c-4f95-b201-4124e703bd5c)
If you’re our partner or client, you already have automatic access to the **Synerise Demo workspace (1590)**, where you can explore all the configured elements of this use case and copy them to your workspace.
If you’re not a partner or client yet, we encourage you to fill out the contact [form](https://demo.synerise.com/request) to schedule a meeting with our representatives. They’ll be happy to show you how our demo works and discuss how you can apply this use case in your business.
## Read more
---
- [Aggregates](/docs/analytics/aggregates)
- [Segmentation](/docs/analytics/segmentations)