
*"How much revenue did this email drive? Did the push notification lead to a purchase? Which campaign gets credit for the sale?"* - the usual answer comes in one of two forms, and each has a drawback. You can build the metric logic and formulas by hand, but joining a click to a later purchase this way relies on approximations — proxies for the link between the two events — so the result is never fully accurate. Alternatively, you can export the raw events and wait for the BI or analytics team to join clicks to purchases for you, which arrives days later as a static spreadsheet that cannot be refreshed. A third option avoids both drawbacks: a single metric that returns the number directly.

The difference from the hand-built approach is not the number of metrics involved — it is how the link between the two events is made. A time-window event aggregate tracks a triggering event (for example, a `newsletter.click`) within a defined rolling window. When this aggregate is attached as a condition to a metric built on a base event (for example, each `transaction.charge`), it checks, for every occurrence of the base event, whether the triggering event happened first, within that window. The link between the action and the outcome is established at the event level — not approximated — without hand-built formulas and without an export to refresh. Because it runs on first-party events rather than tracking pixels, the result is not affected by cookie consent or cross-device behavior.

This builds on a familiar idea: a standard Last aggregate returns a profile's most recent value within a date range. An event aggregate applies the same Last logic at the event level — it evaluates each occurrence of the base event and looks at what happened before it — so the defined window only sets how far back it checks for the triggering event.

The key characteristic of this aggregate: it returns nothing on its own. It is a condition attached to a base event. You are not asking *"what did each customer do"* — you are asking *"of all these purchases, which ones followed the triggering action within the window."* This applies to any scenario where one action causes a later outcome inside a known time horizon: email, push, in-app, recommendations, or in-store visits.

This use case shows how to build that metric, step by step, using email attribution as the example.

## Example - Email attribution

---

**Business question:** *"How many transactions can we credit to the newsletter, and to which campaign specifically?"*

**Why this matters:** Open Rate and CTR tell you that people engaged with the email. They do not tell you that anyone bought anything. Without connecting the click to the transaction, email's contribution to revenue stays an assumption rather than a measured number. This use case provides the number, and it holds up against cookie consent, ad-blockers, and cross-device behavior, because it runs on first-party events rather than tracking pixels.

The three levels below are not three separate metrics. They are one metric, extended step by step. On its own it returns a single number (Level 1). Add a dimension and that same number splits into a table, one row per campaign (Level 2). Expose its parameter as a dynamic key and a user can enter any campaign and read its result on a dashboard (Level 3). The attribution logic stays identical at every level; what changes is only the dimension or parameter added on top. The [Process](#process) section builds it.

### Level 1 - Total

*"How much did the newsletter drive overall?"*

One number: the count of transactions that happened within 24h of any newsletter click.

**What decisions you can make based on the metric result:**

- Defend or challenge the email channel's revenue contribution in a business review.
- Track the trend over time — is email-driven revenue growing or declining?
- Set the baseline before testing a new send strategy.

### Level 2 - Per campaign

*"Which campaign gets the credit?"*

The same logic, broken out into a table — one row per campaign, showing how many post-click transactions each one drove. In this variant, the metric is used inside a report, with the campaign ID set as a dimension. The metric returns the attributed transaction count; the report is what breaks it into one row per campaign. 

**What the report shows:** a table of `campaignId` (or `campaignName`) | transactions attributed.

<!-- **[Screenshot to add: report preview with a chart and a breakdown table split by `campaignName`]** -->

**What decisions you can make based on the metric result:**

- Stop crediting campaigns with high open rates that drive clicks but no purchases.
- Identify the subject lines or offers that convert, not just engage.
- Reallocate send budget toward campaigns with proven downstream revenue.

### Level 3 - Self-serve

*"Let marketers check any campaign themselves."*

The same metric, exposed as a dashboard field where a user enters a campaign ID and instantly sees that campaign's attributed transactions. It uses last-click logic, so a purchase is credited only to the most recent newsletter click before it (if a customer clicks campaign X and then campaign Y, only Y receives the sale).
<!-- 
**[Screenshot to add: dashboard field where a campaign ID is entered and the attributed transactions are returned]** -->

**What decisions you can make based on the metric result:**

- Hand campaign owners a self-service answer instead of a request to the analytics team.
- Wire the dashboard directly to email communications so the campaign context is passed automatically.
- Standardize how the whole team measures email-driven revenue.


## Prerequisites

---
The [Process](#process) below builds the total and per-campaign version step by step. All logic is configured inside Synerise using analytics features. No SQL, API, or external attribution tool is required. The same steps apply to other triggering actions — only the events and the window change. For more examples, see [Other applications](#other-applications).

- Both events must be tracked — the triggering event (for example, the `newsletter.click`) and the outcome event (for example, `transaction.charge`).
- For a breakdown, the identifying parameter must be on the event - e.g. `newsletter.click` must carry a campaign id if you want results split by campaign.
- Decide the attribution window up front (24h / 48h / 72h). This is a business decision, not a technical default — see the note in the [Process](#process) section.
- The events you want to analyze must already exist in the workspace. For building the aggregate and the metric, see [Creating event aggregates](/docs/crm/aggregates/creating-event-aggregates) and [Creating simple metrics](https://hub.synerise.com/docs/analytics/metrics/creating-simple-metrics/).

  <div class="admonition admonition-note"><div class="admonition-icon"><svg xmlns="http://www.w3.org/2000/svg" fill="none" viewBox="0 0 24 24" stroke="currentColor" stroke-width="2.5"><path stroke-linecap="round" stroke-linejoin="round" d="M13 16h-1v-4h-1m1-4h.01M21 12a9 9 0 11-18 0 9 9 0 0118 0z" /></svg></div><div class="admonition-body"><div class="admonition-content">

  Understand the model - the aggregate alone returns nothing. It only produces results once attached as a condition to a base event inside a metric.

  </div></div></div>


- For the self-serve dashboard: the dynamic key must be named exactly (lowercase, for example `id`) so the predefined parameter passing from communications works. See [Creating dashboards](https://hub.synerise.com/docs/analytics/analytics-dashboard/creating-dashboards/).

## Process

---
In this use case, you will go through the following steps:

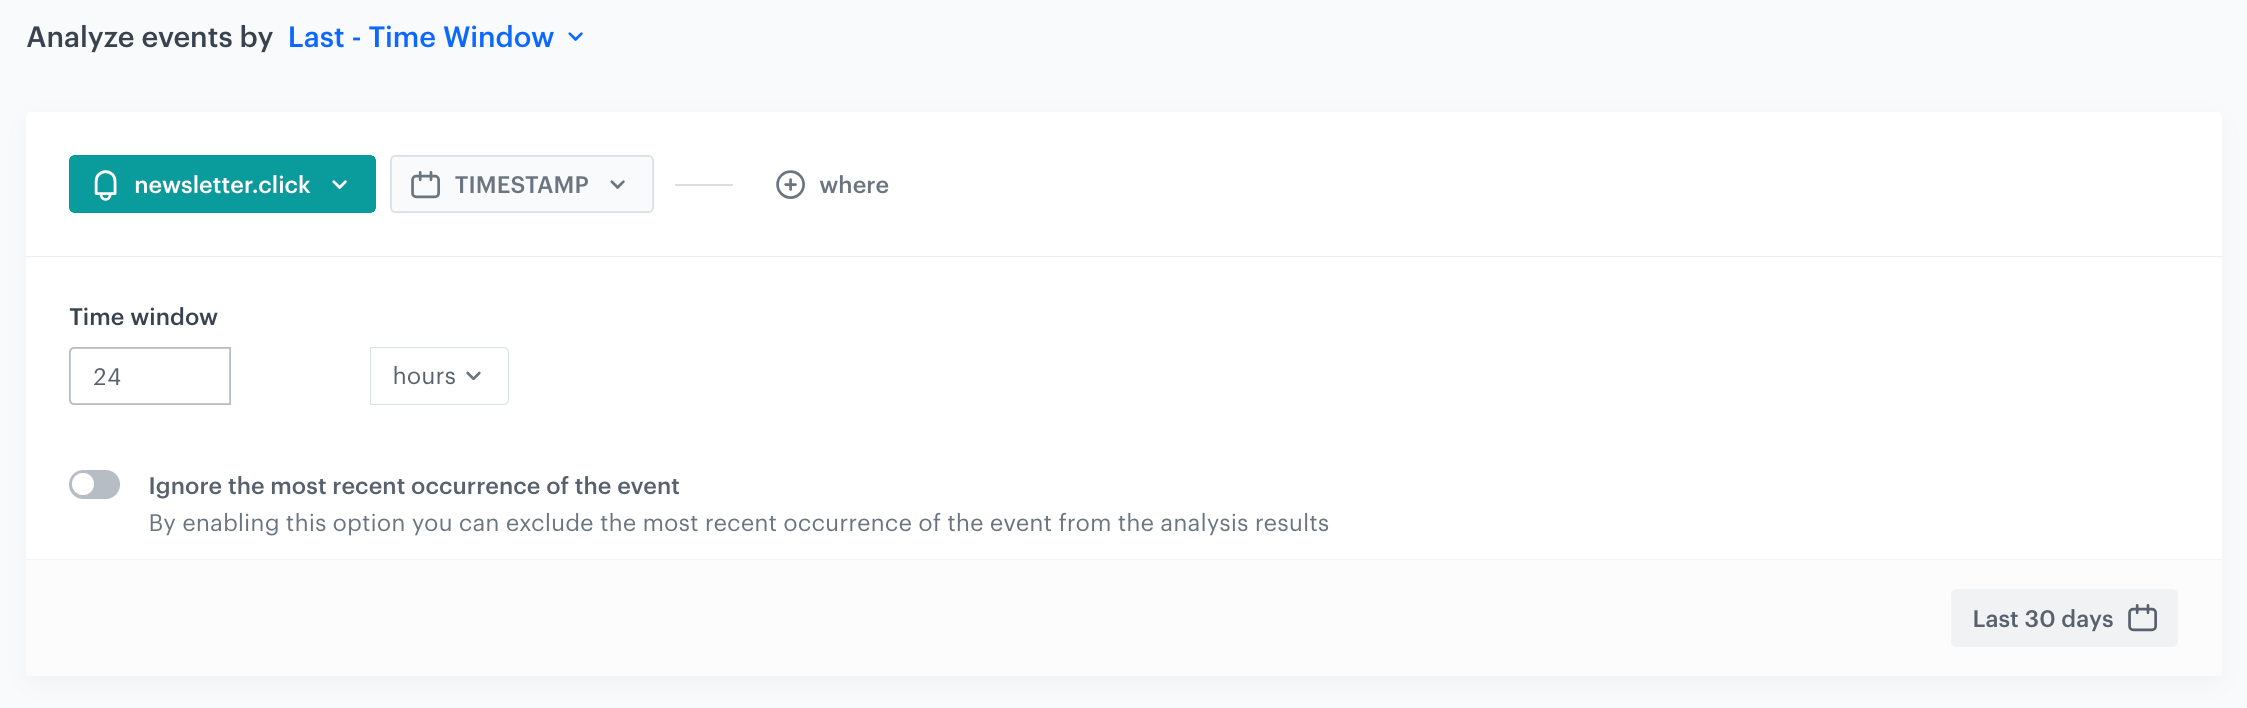
1. Create an **event aggregate**. 
    1. Analyze events by **Last – Time Window** type.
    2. Select the `newsletter.click` event to aggregate by chosen function.
    3. As the event parameter, select **TIMESTAMP**, 
    4. Set the **Time window** to 24 hours. 

    <figure>
    <img src="/api/docs/image/bb086047b7671d4cc3fdf2d937b5b8b2c9ad4785/use-cases/all-cases/_gfx/timewindow_newsletter.png" class="full" alt="The preview of the configuration of the event aggregate">
    <figcaption>Configuration of the event aggregate</figcaption>
    </figure>

     
   <div class="admonition admonition-note"><div class="admonition-icon"><svg xmlns="http://www.w3.org/2000/svg" fill="none" viewBox="0 0 24 24" stroke="currentColor" stroke-width="2.5"><path stroke-linecap="round" stroke-linejoin="round" d="M13 16h-1v-4h-1m1-4h.01M21 12a9 9 0 11-18 0 9 9 0 0118 0z" /></svg></div><div class="admonition-body"><div class="admonition-content">

   The aggregate returns nothing on its own; this is expected, because it acts as a condition.

   </div></div></div>


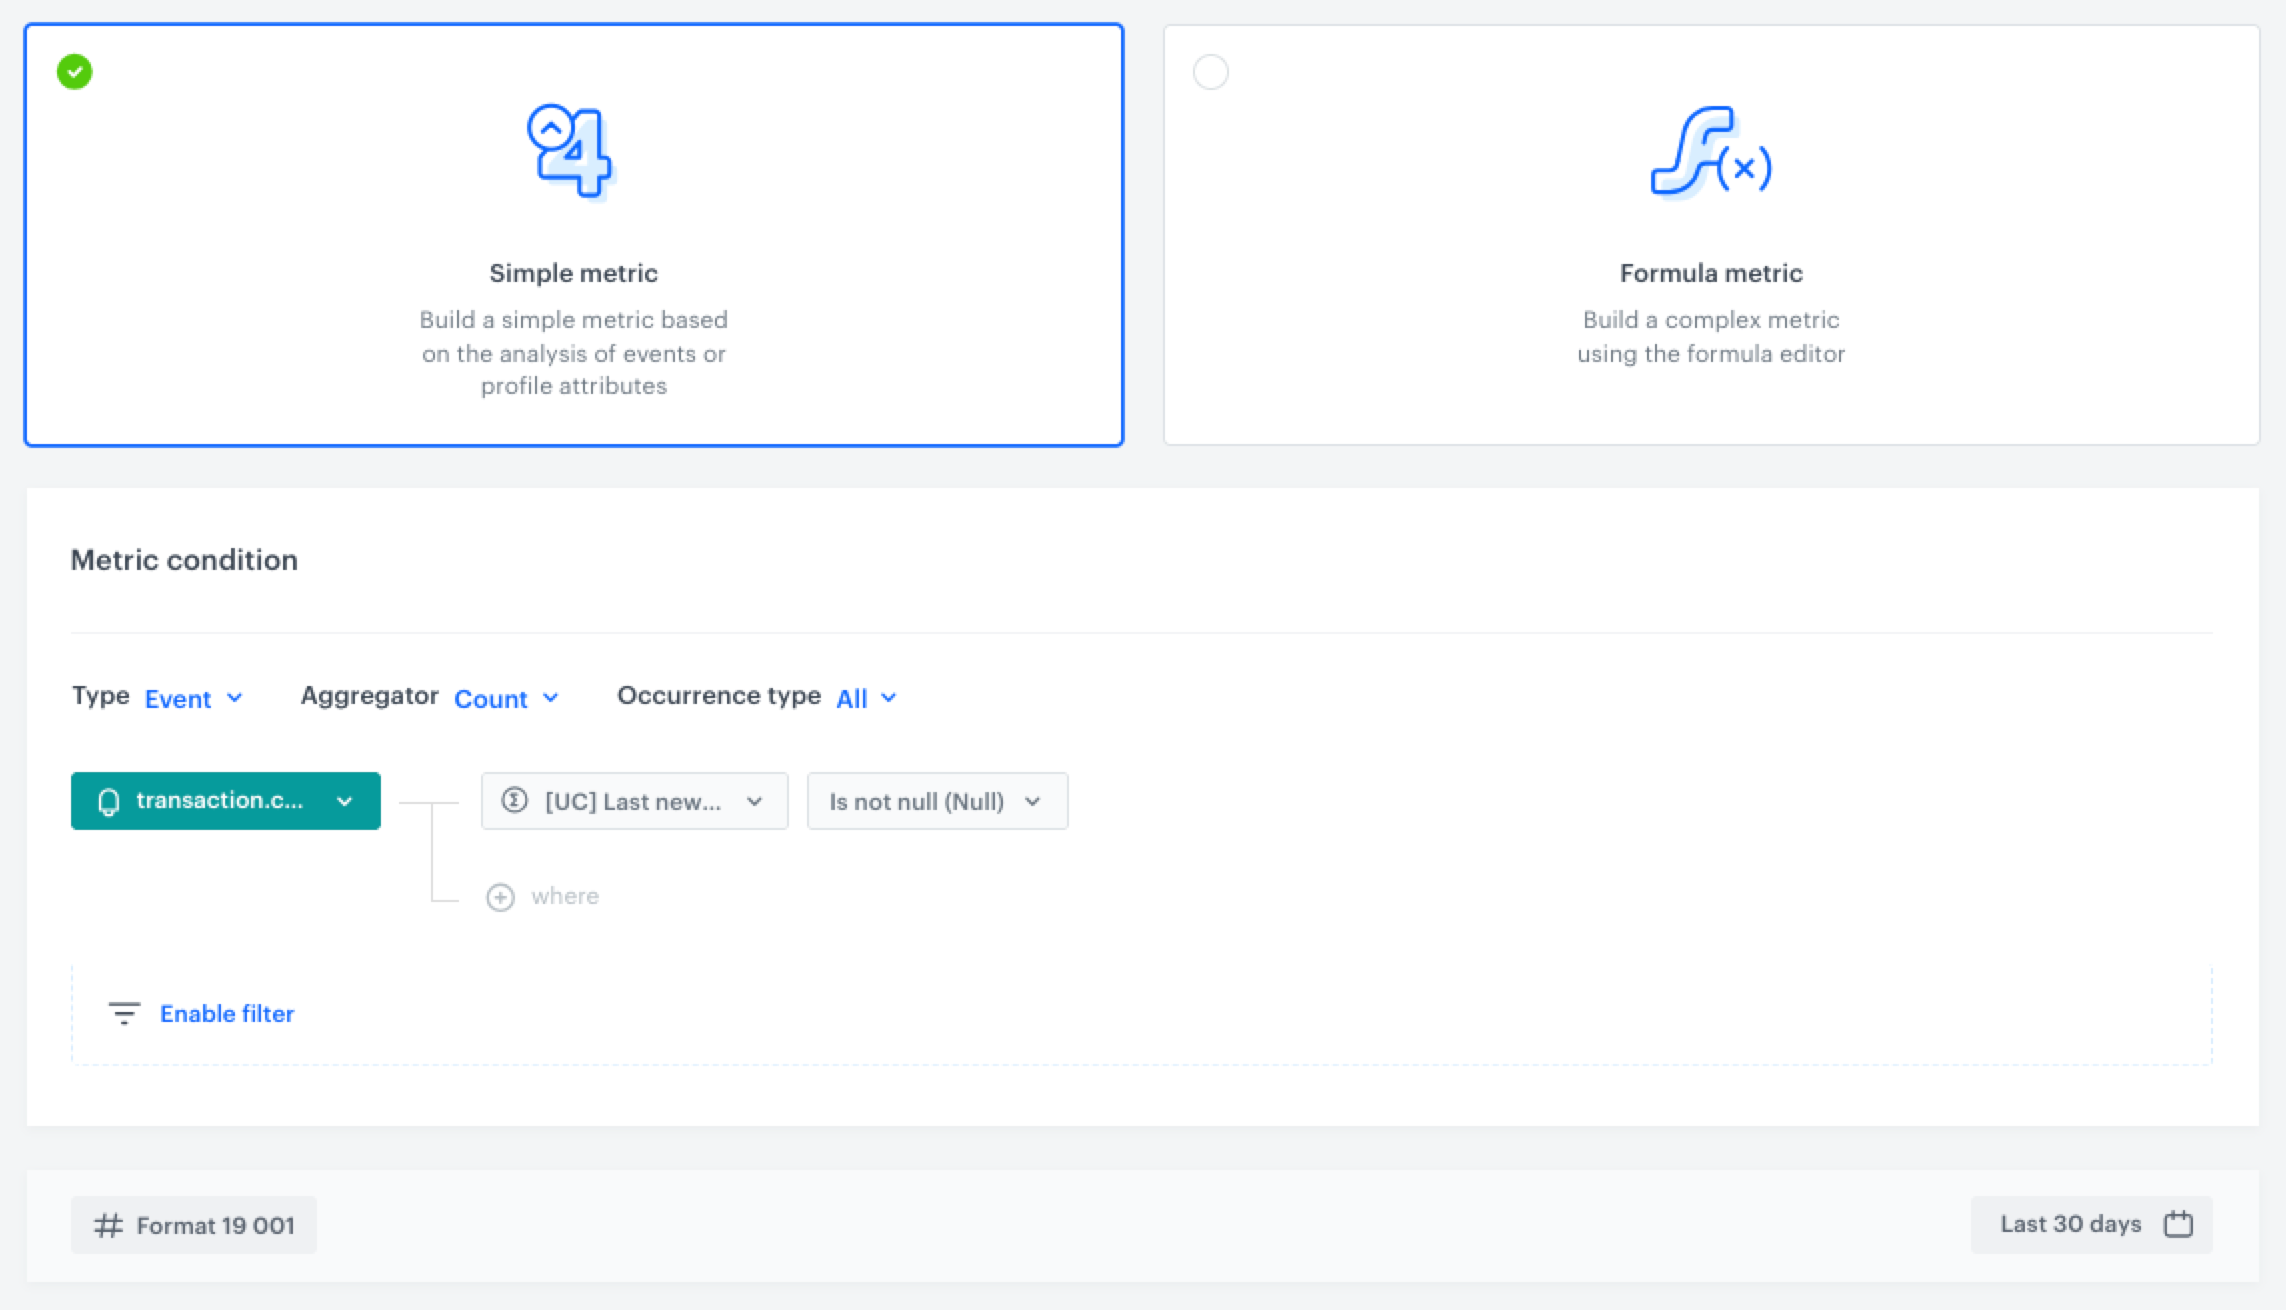
2. Create a **simple metric**.
    1. Set the **Type** to **Event** and the **Aggregator** to **Count**.
    2. Select the `transaction.charge` event.
    3. As the event parameter, select the aggregate created in the previous step.
    4. Add a condition that the event aggregate **Is not null**.
     <figure>
    <img src="/api/docs/image/bb086047b7671d4cc3fdf2d937b5b8b2c9ad4785/use-cases/all-cases/_gfx/timewindow_metric.png" class="full" alt="The preview of the configuration of the metric with the aggregate used as a condition">
    <figcaption>Configuration of the metric with the aggregate used as a condition</figcaption>
    </figure>

3. Optionally, go deeper:
    - **Per campaign** — add a second event aggregate that returns the campaign ID, and use it as a dimension in a report.
    - **Self-serve** — set the aggregate's parameter as a dynamic key (/docs/analytics/i_events-parameter-value#how-to-create-a-dynamic-key) (regex value `.` matches all when the field is left blank, and a specific value when filled), then add a matching profile filter on the metric so Synerise treats it as dynamic. 


<div class="admonition admonition-important"><div class="admonition-icon"><svg xmlns="http://www.w3.org/2000/svg" fill="none" viewBox="0 0 24 24" stroke="currentColor" stroke-width="2.5"><path stroke-linecap="round" stroke-linejoin="round" d="M12 8v4m0 4h.01M21 12a9 9 0 11-18 0 9 9 0 0118 0z" /></svg></div><div class="admonition-body"><div class="admonition-content">

**Attribution Choices - read this before you rely on the number.**

- **Window length is a tradeoff.** Too short and you under-credit the channel (slow buyers fall outside the window); too long and you over-credit it (purchases that would have happened anyway get attributed). Choose the window deliberately, per purchase cycle.
- **This is last-click, single-touch attribution.** Earlier clicks receive no credit. This fits the question *"which campaign closed the sale"*; it is not the right model for *"which campaign started the journey."* Confirm which question you are answering.
</div></div></div>


## What's Next

---

After building the metric, you can:

- Tune the window to match the real purchase cycle for each channel.
- Break down the result by campaign using a report dimension.
- Make it self-serve with [a dynamic-key dashboard](/docs/analytics/analytics-dashboard/creating-dashboards#dynamic-data-in-dashboards) wired to your communications, so the campaign context is passed automatically.
- Pin to a dashboard and set alerts when attributed revenue drops.
- Reuse the same three steps for push, in-app, recommendations, and in-store scenarios.

## Other applications

---

The same setup — a triggering event, a time window, and a base event — answers other questions. These are applications of the same pattern, not pre-built reports. Only the events and the window change.

| Triggering action | Outcome (base event) | Question it answers |
| --- | --- | --- |
| Push click / push delivered | `transaction.charge` | How much revenue followed a push within 24–48h? |
| In-app banner or message view | `transaction.charge` | Did the in-app campaign convert, or was it only seen? |
| Recommendation click | `product.buy` | Did the recommendation lead to an actual purchase, not just a click? |
| Abandoned-cart reminder sent | `transaction.charge` | What share of reminded carts were recovered in the window? |
| App open | `transaction.charge` | Do app sessions convert to a purchase within the day? |

The window length is the lever: match it to the realistic decision cycle for that action.

## Read more

---

- [Event aggregates](/docs/crm/aggregates/creating-event-aggregates)
- [Metrics](/docs/analytics/metrics)
- [Reports](/docs/analytics/reports)
- [Creating reports](/docs/analytics/reports/creating-reports)
- [Dashboards](/docs/analytics/analytics-dashboard)
