 *
*

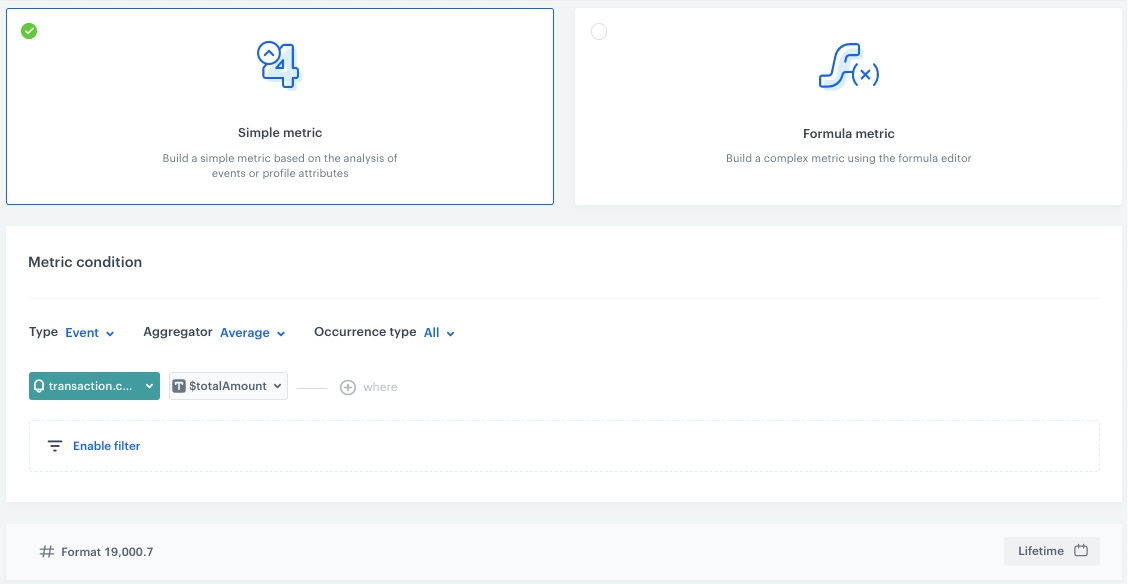
This report will return the names of most frequently bought products and its values.
title.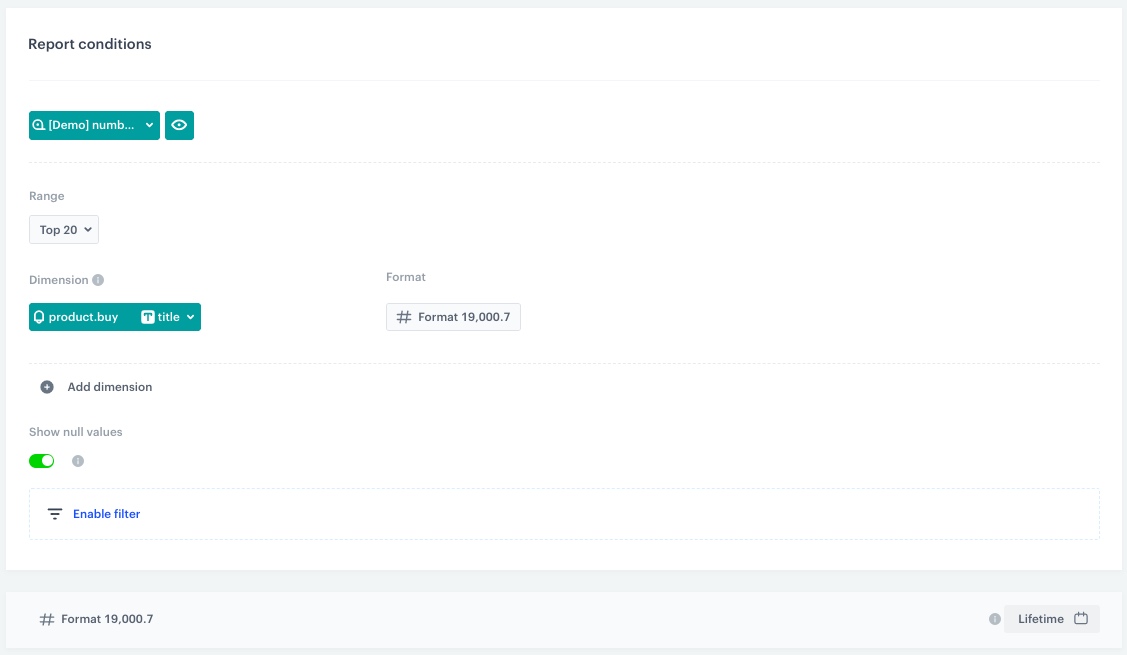
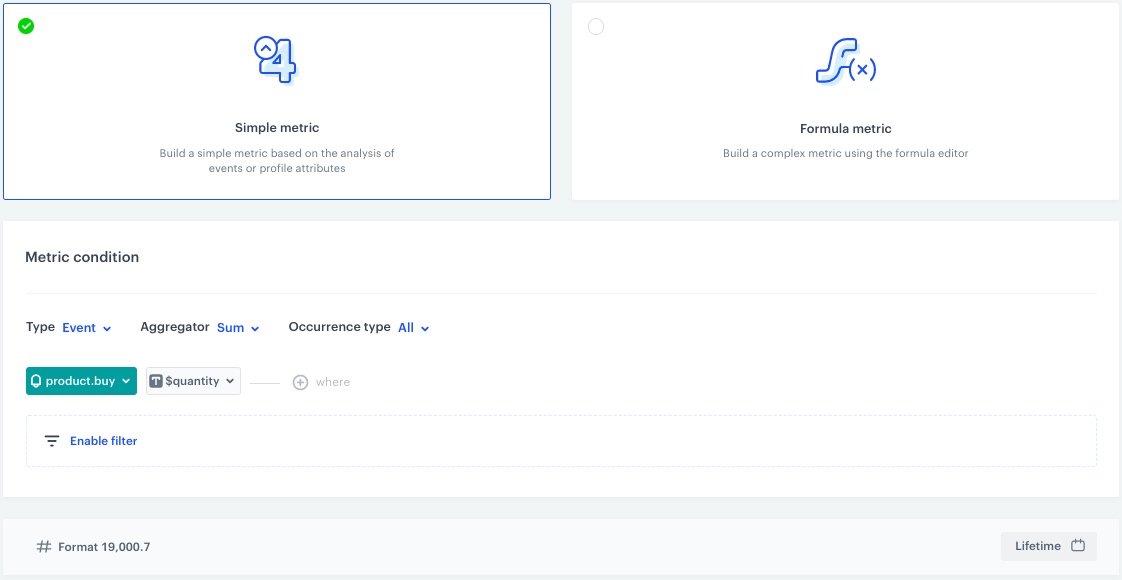
This report will return the names of most frequently bought products and its values by its categories.
category.This report will return the names of most frequently bought products by categories and its values in a specific month.
title.This report will return the names of most frequently bought products by categories and its values in a specific month.
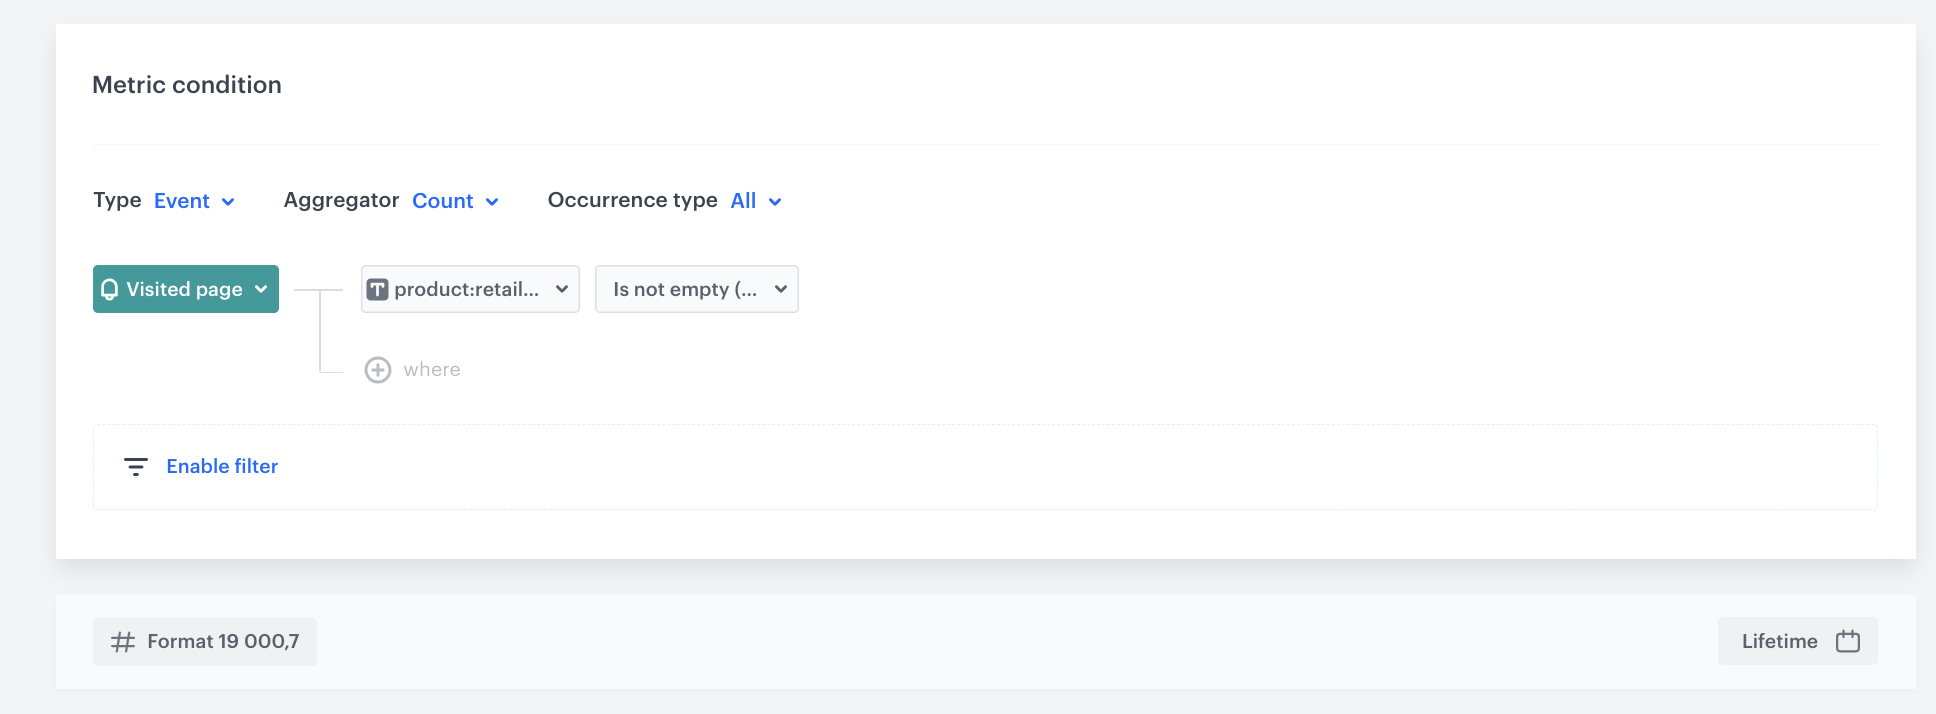
category.This report will return the names of most frequently visited products and its values.
og:title.This report will return the names of most frequently visited products and its values by categories.
product:category.