The Synerise platform offers you a full statistics panel in the recommendation details.
In the AI Hub > (AI Recommendations) Models view, you can view the statistics in two ways:
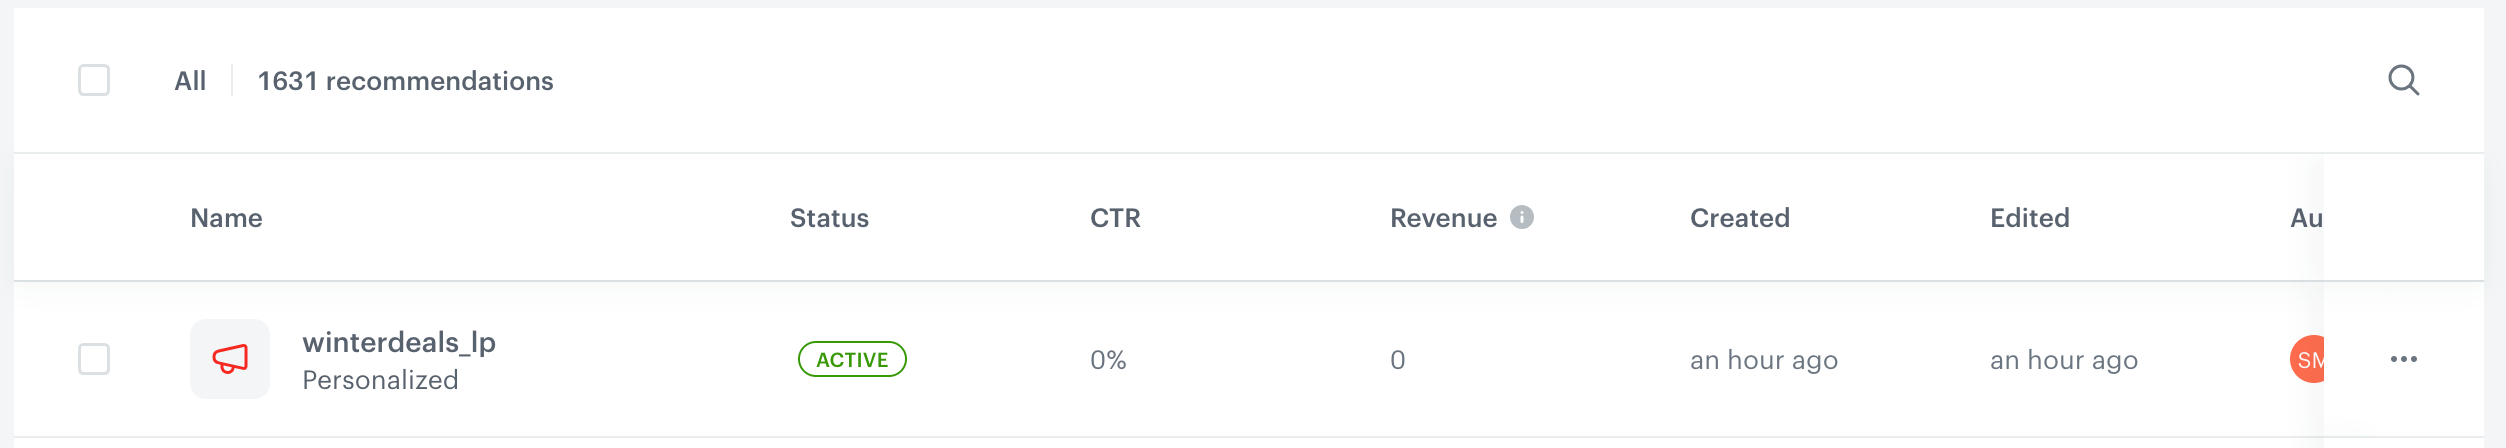
- On the list of recommendations, you can view basic statistics for each campaign.
- After opening a recommendation's details, you can see more statistics on the Statistics tab
Before you read the description of the metrics in the statistics, there is a term that you may not be familiar with:
a unique recommendation frame - it is a very first view of a recommendation frame (for example, if a customer sees a recommendation frame whose ID is
1234, and this recommendation is displayed for the second, third and more times, these views are not considered unique)The statistics are calculated from these events:
- recommendation.click
- recommendation.view
recommendation.generated- this event is generated automatically after a request is sent to any endpoint that starts withrecommendations/v2/recommend- transaction.charge
Some metrics, particularly those counting unique values (such as unique views), use approximate aggregation algorithms for performance reasons. As a result, the displayed values may differ slightly from exact counts. The margin of error is typically less than 0.5% relative to the metric's value — for example, a count of 1,000,000 unique views may differ from the exact figure by up to ~5,000. This does not affect the overall interpretation of the data.
List of recommendations
| Metric name | Description | Required events |
|---|---|---|
| CTR | (Click Through Rate) It is the number of clicks on a recommendation frame divided by the number of generated in the last 30 days. |
- recommendation.click,- recommendation.generated |
| Revenue | Revenue generated by the recommendations in the last 30 days. It is counted when a customer buys an item within 24 hours after clicking the item in the recommendation frame. |
- recommendation.click,- transaction.charge, - recommendation.generated |
Statistics tab
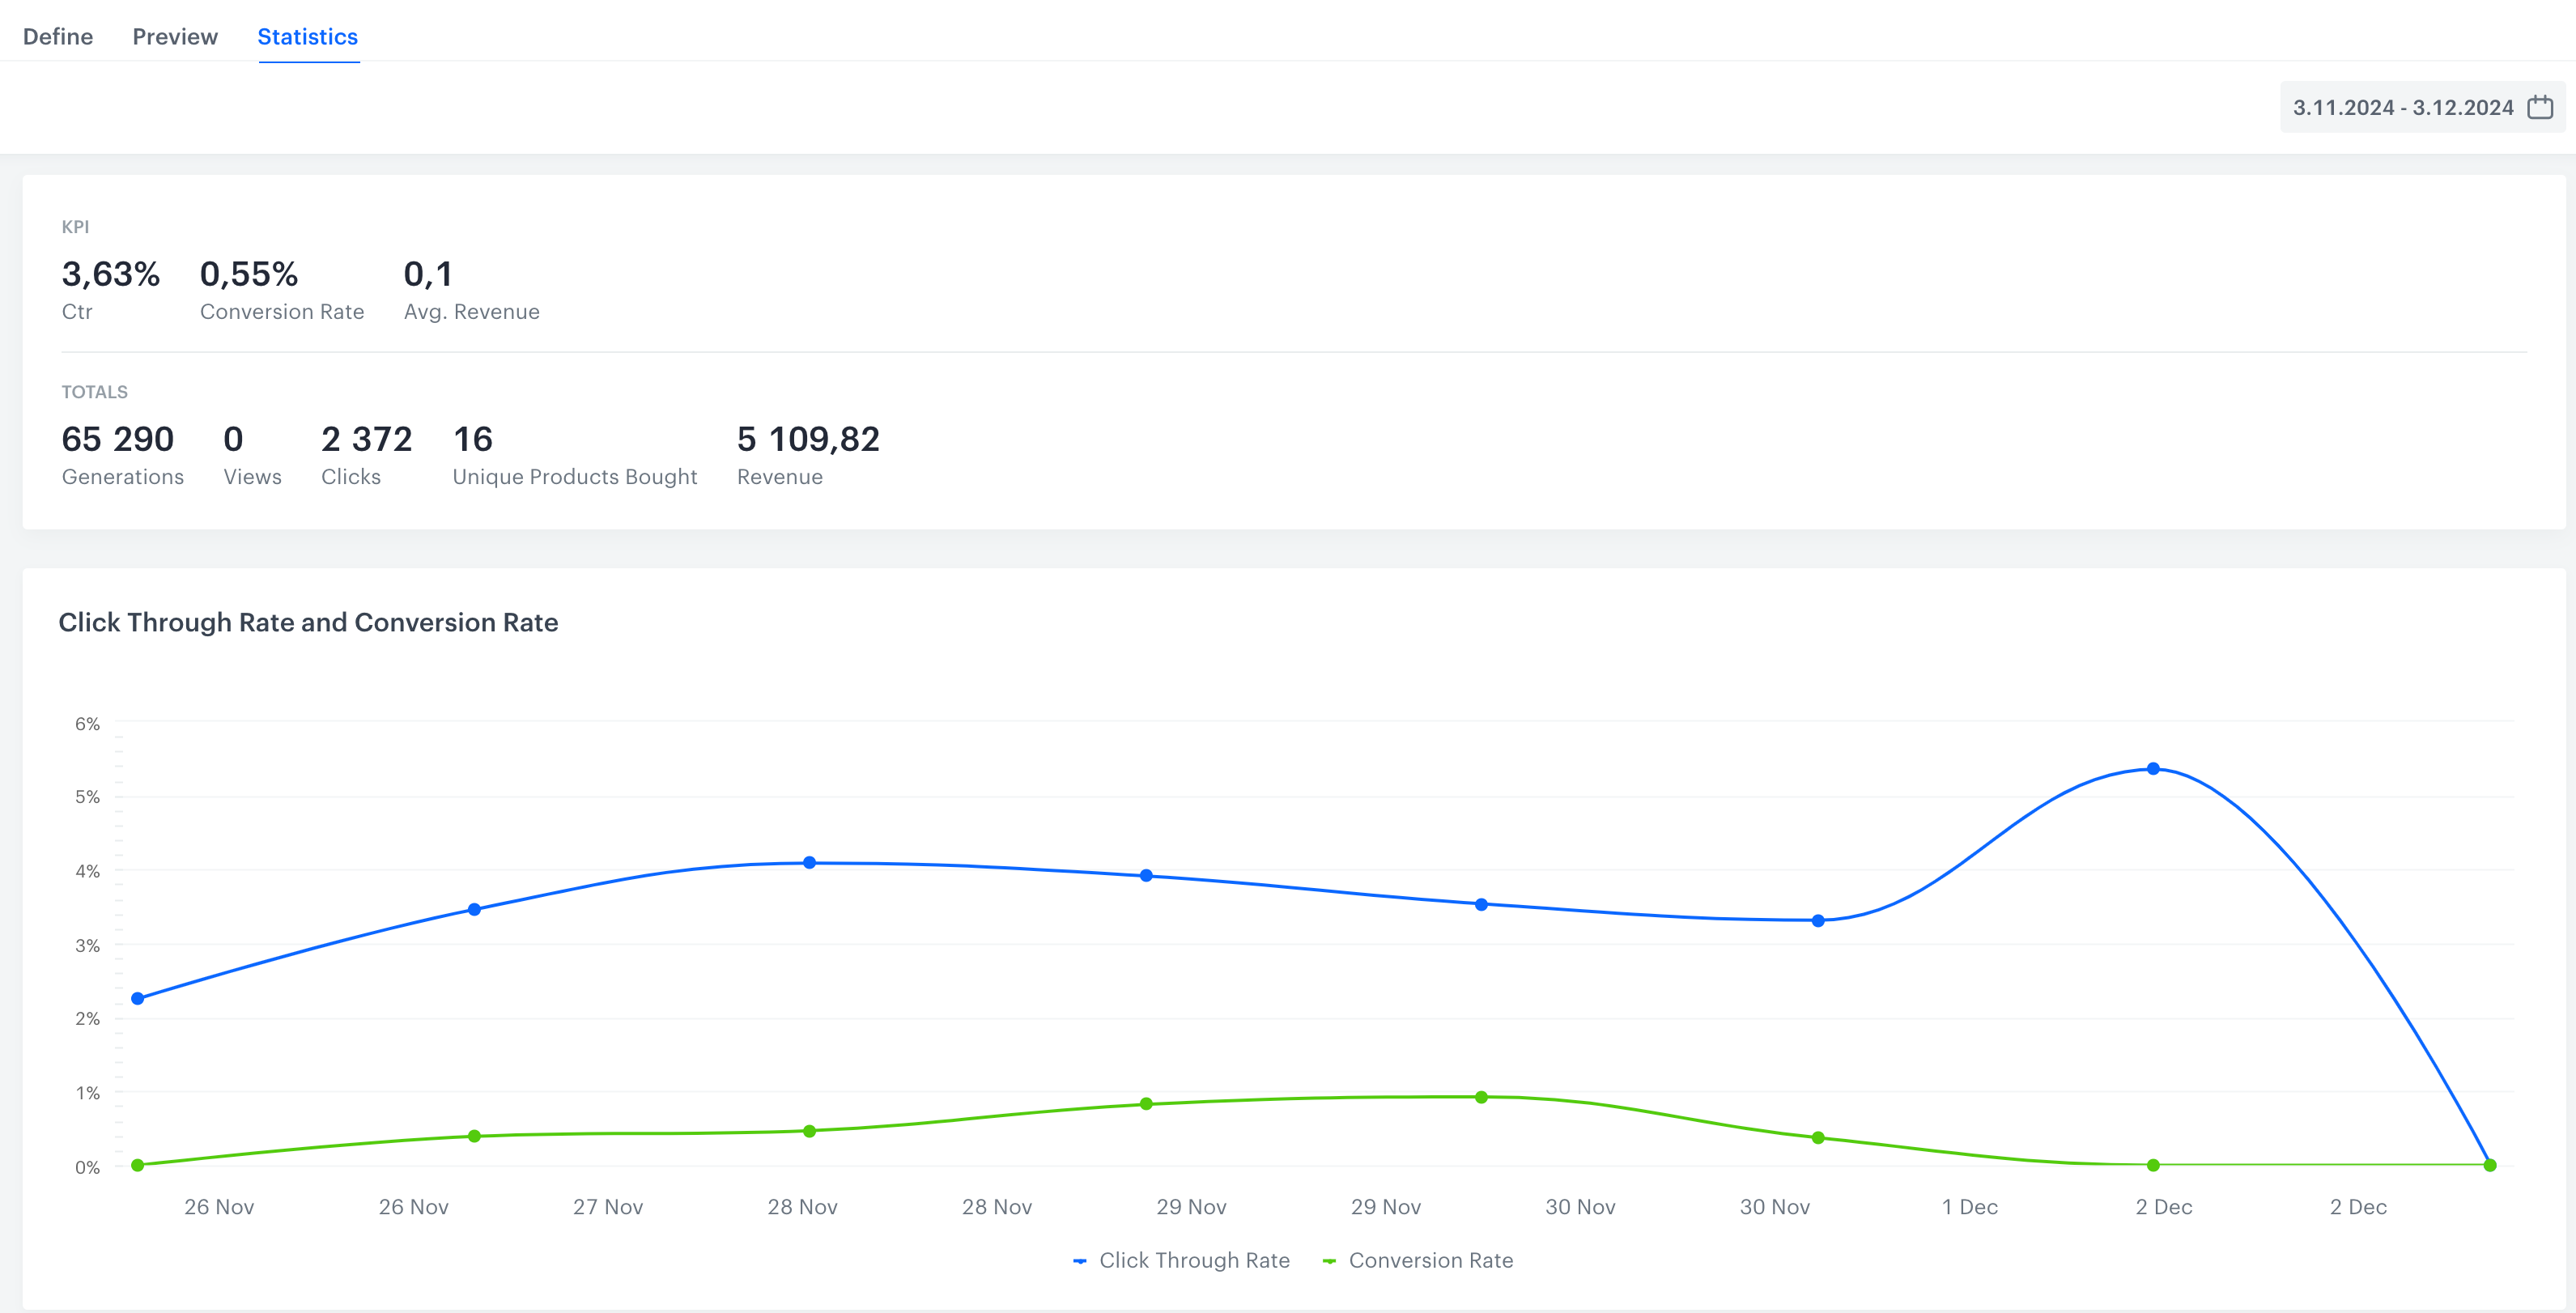
In this tab, you can find detailed statistics:
Campaign metrics
| Metric name | Description | Required events |
|---|---|---|
| CTR | (Click Through Rate) It is the number of clicks on a recommendation frame divided by the number of recommendation generations in the last 30 days. |
- recommendation.click,- recommendation.generated |
| Conversion Rate | It is the number of unique products bought divided by the number of all clicks. Clicks made within 24 hours of a transaction count towards the conversion rate of the day when the transaction was made. |
- recommendation.click,- transaction.charge |
| Avg. revenue | (Average revenue) It is calculated by dividing revenue by the number of unique customers (those for whom recommendation was generated). You can find the explanation of how revenue is calculated further in this table. |
- recommendation.click,- transaction.charge, - recommendation.generated |
| Generations | It is the number of generated recommendation frames. | recommendation.generated |
| Views | It is the total number of unique recommendation frames a customer has seen. |
- recommendation.view,- recommendation.generated |
| Clicks | The number of unique clicks on a recommendation frame. | - recommendation.click,- recommendation.generated |
| Unique Products Bought | The number of purchased unique items. For example, if a customer purchased 2 pieces of the same product, the number of unique items is 1. |
transaction.charge |
| Revenue | Revenue generated by the recommendations. It is counted when a customer buys an item within 24 hours after clicking the item in the recommendation frame. |
- recommendation.click,- transaction.charge,- recommendation.generated |
| Click Through Rate and Conversion Rate (chart) |
The chart compares CTR (number of clicks on a recommendation frame divided by the number of recommendation generations) and Conversion Rate (number of unique products bought divided by the number of all clicks) in a given period. |
- recommendation.click,- recommendation.generated, - transaction.charge |
| Recommendations viewed vs generated |
It is a contrast between two situations: when a recommendation was actually viewed (for example, when a customer scrolled down to the recommendation frame and saw it) and when the customer entered the website, but didn't see the generated recommendation. |
- recommendation.view,- recommendation.generated |
| Clicks in Recommendation | It is the graphic representation of the total amount of clicks on the product (within a recommendation frame) during the selected period. |
- recommendation.click,- recommendation.generated |
| Unique Products Bought | It is the graphic representation of the number of purchased unique items in the selected period. |
- transaction.charge,- recommendation.generated,- recommendation.click |
| Number of Products Bought | It is the total number of the purchased items during the selected period. |
- recommendation.click,- transaction.charge,- recommendation.generated |
Item metrics
For each campaign, you can check the best-performing items. They are available in the Top products section of the statistics.
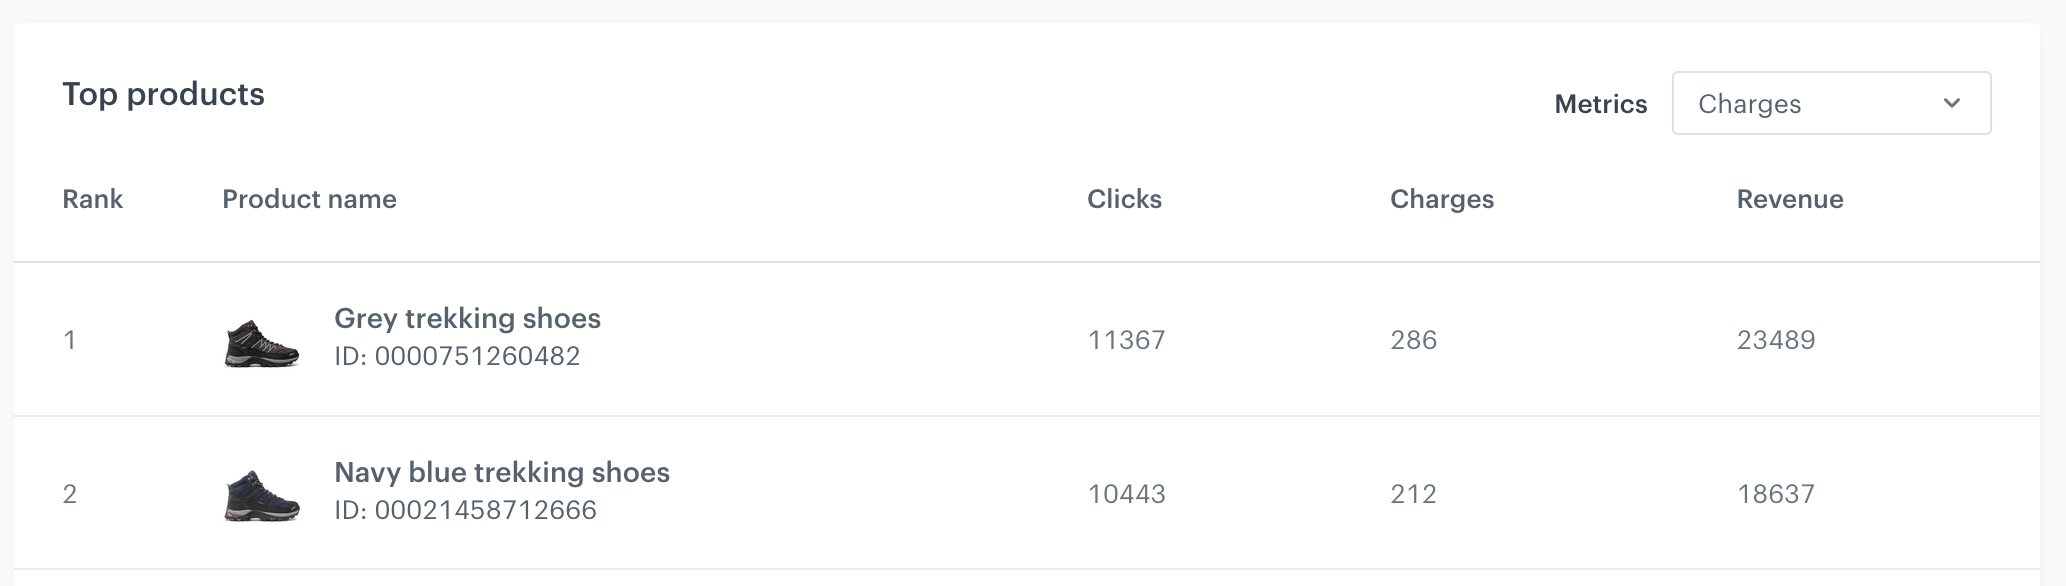
By using the Metrics dropdown list on the right, you can choose the condition by which the best items will be selected:
| Metric name | Description | Required events |
|---|---|---|
| Generations | The number of recommendation frames which included this product | recommendation.generated |
| Clicks | The number of times this product was clicked in a frame | - recommendation.click,- recommendation.generated |
| Charges | The number of transactions with this item which occurred within 24 hours of clicking the item. | - recommendation.click,- recommendation.generated |
| Revenue | The revenue generated by showing this item in a recommendation frame | - recommendation.click,- transaction.charge,- recommendation.generated |
| Views | The number of times this item was shown after a recommendation was generated. This is separate from generating a frame, because the frame might be displayed partially and items are only shown after scrolling or otherwise changing the view. |
- recommendation.view,- recommendation.generated |