Monitoring the number of API calls made in your organization is helpful for optimizing and troubleshooting your integrations. It also provides you with clear visibility into their API usage and consumption.
The statistics include API calls made by the following API consumers:
The filters apply to the graph and to the CSV report.
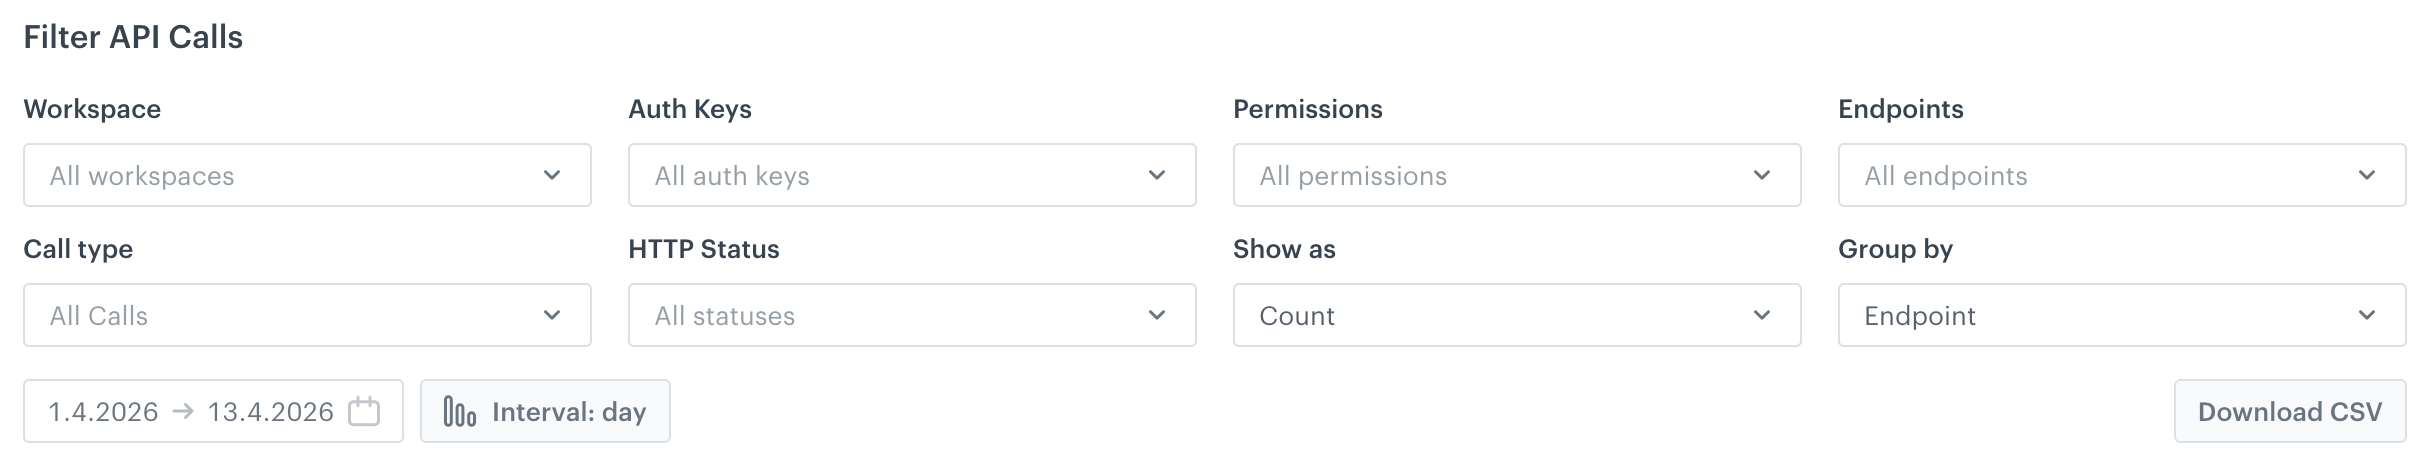
In the Filter API Calls section, choose the data to show. By default, the report shows all API calls from all workspaces in the current month. Filters for the API consumption report and graph
You can narrow down the data by using the following filters:
Workspace - Filters by workspaces.
Auth Keys - Filters by API keys and tracker keys.
Permissions - Filter by permission names. Some permissions allow multiple endpoints.
Endpoints - Filters by endpoints (paths).
Call type - Filters by HTTP methods.
HTTP Status - Filters by HTTP response statuses.
Adjust the time range and calculation method:
Show as:
Count - Shows the data separately for each period.
Incremental - Shows the total for each period including the count from earlier periods.
Date range - Sets the start and end date of the query. By default, the data is from the current month.
Adjust the data grouping options:
Group by - Groups the data in the graph by a facet. By default, the data is grouped by date.
Interval - Changes the columns in the graph to show the data by days (default) or months.
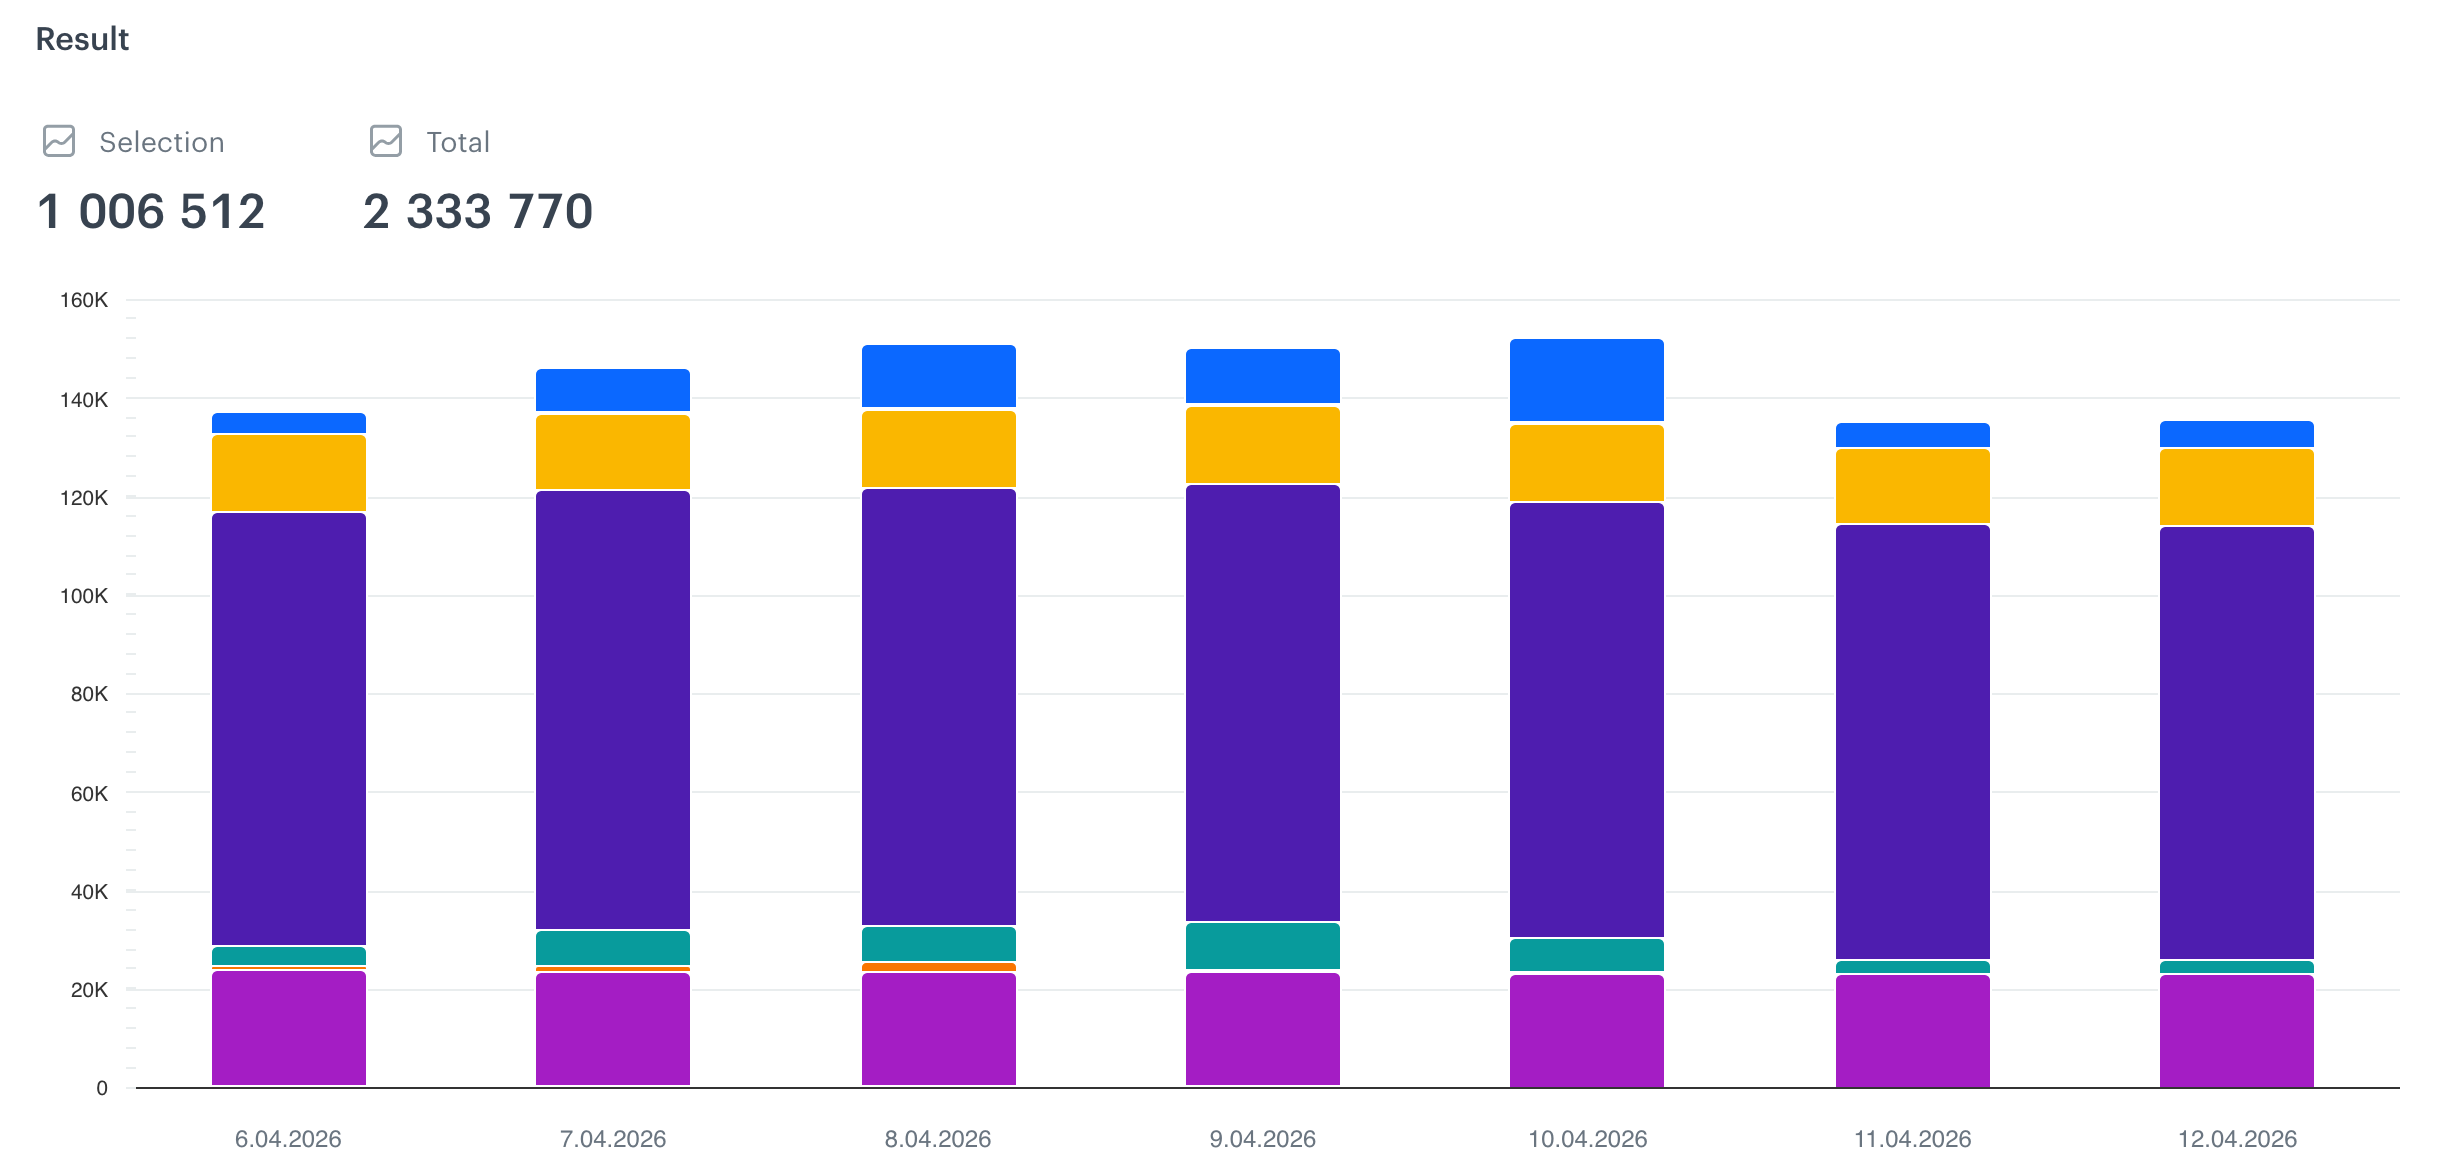
Selection is the number of calls that met the filters.
Total is the number of all calls in the selected period.
Each column is one unit of time (day or month, depending on the Interval setting).
The columns illustrate API calls according to the Group by setting.
You can hover over a column to see the details.
In the legend under the graph, you can select and deselect values from the graph. The value type depends on the Group by setting.
You can see a brief summary of the data in the table under the legend.
CSV report
Under the filters, click Download CSV.
Save the report on your computer and open it.
Each report in the row corresponds to a resource (for example: endpoint, workspace) according to the Group by setting. The columns are:
date: the day or month that the row describes.
periodCount: the total number of API calls to show in the graph for the period (count or incremental, according to the Show as setting).
periodTransferSize: the total number of bytes transferred in the period in all API calls (count or incremental).
label: the name of the resource (for example: endpoint path, workspace name) that the row describes.
count: the number of API calls associated with the resource in the graph (count or incremental).
transferSize: the number of bytes transferred in this period in API calls associated with the resource requests to this endpoint (count or incremental).
 Statistics.