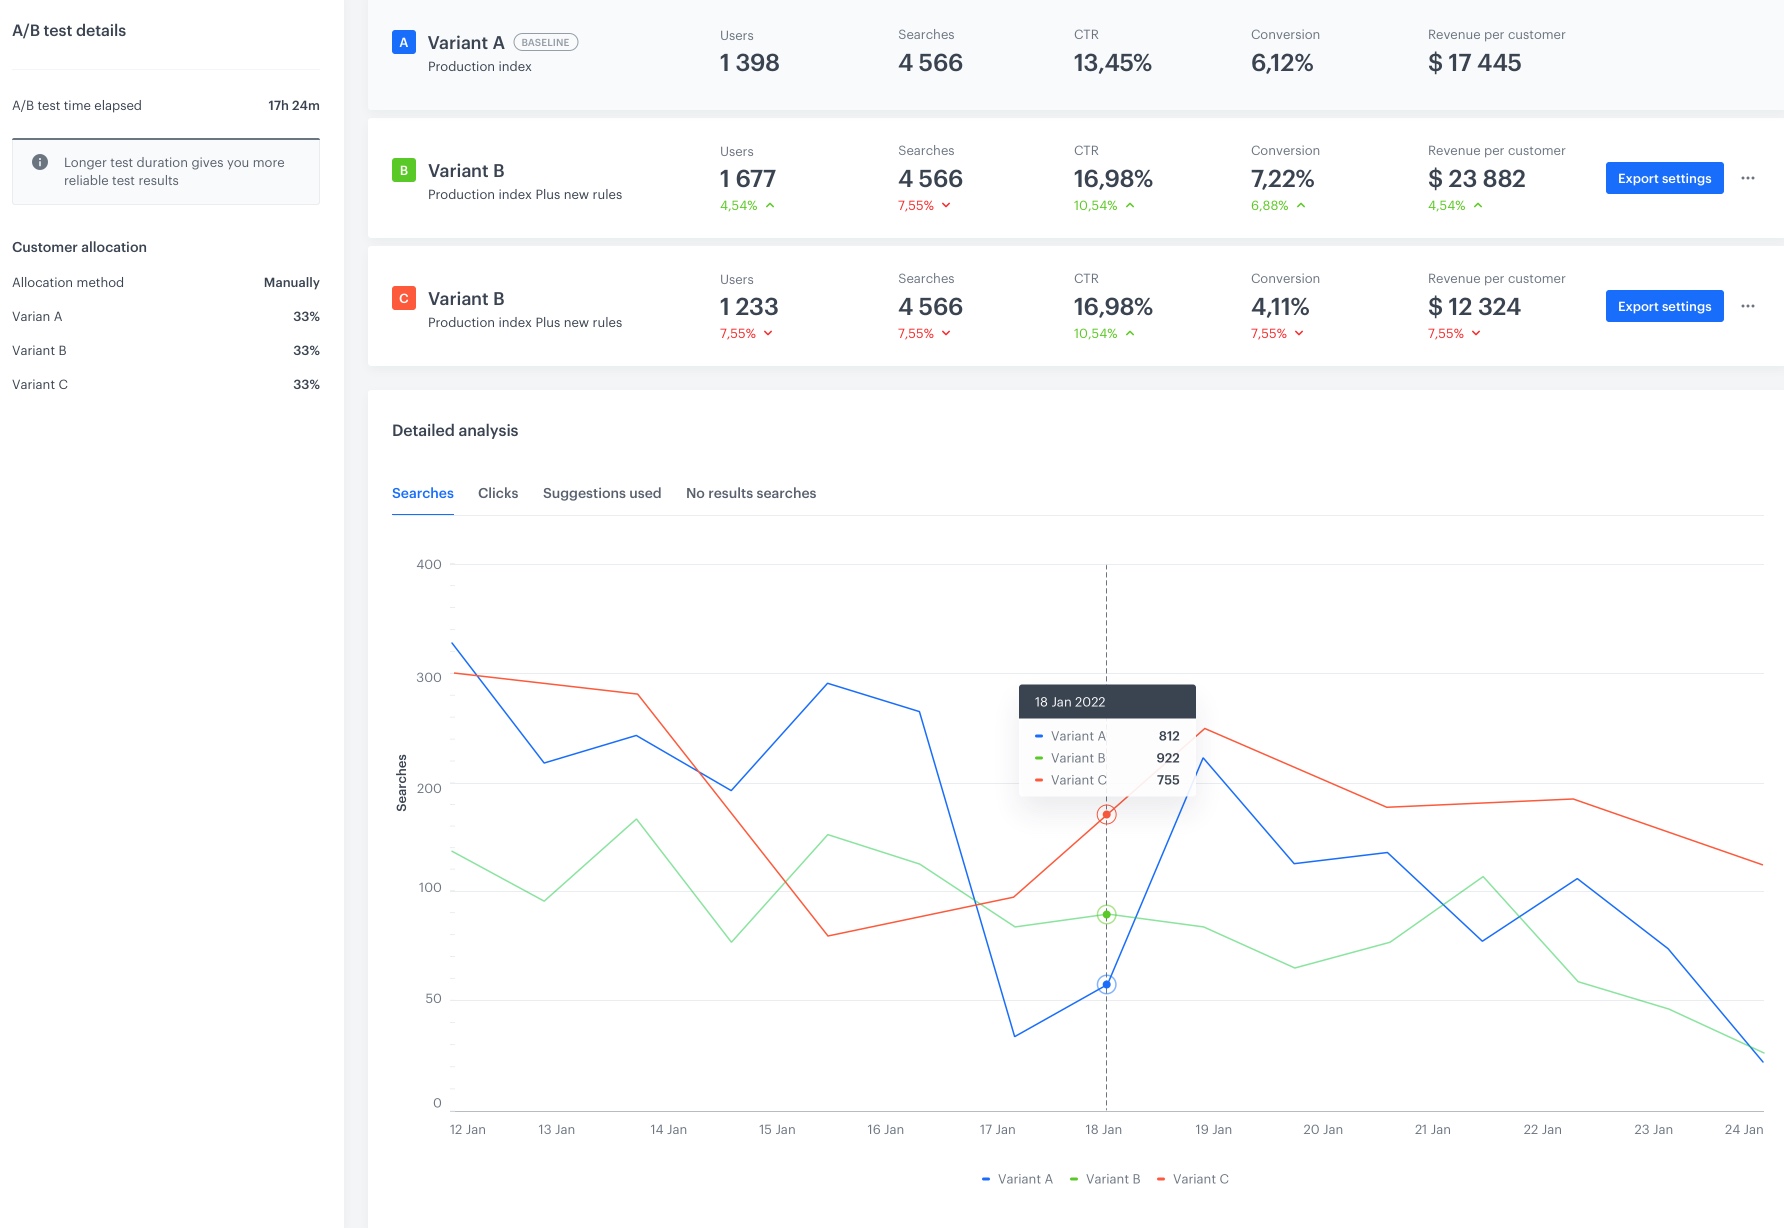
A/B test statistics
When the A/B tests has been running for long enough, you can analyze the statistics for each variant. If one of the variants performed exceptionally well, you can export its settings to the base variant.
- To preview the A/B test statistics, go to
 AI Search > A/B tests.
 - From the list, select the A/B test.
- Click the Statistics tab.

| Data | Description |
|---|---|
| Searches | The total number of searches performed through the index. |
| CTR | (Click Through Rate) It is the ratio of the number of clicks in search results from an index to all searches within this index. |
| Conversion | This metric shows the ratio of clicked search results that ended up with a purchase to those which were clicked. A purchased item is bound to the search click event when the item is purchased in 5 or fewer days since clicking the search result. |
| Avg. click position | It is the average placement of a clicked item on a list of search results. This position is indicated by ordinal ranking, with the higher numbers representing lower positions in the search results. This metric is calculated by dividing the sum of all positions to the number of all clicks on search results. |
| Revenue per profile | It is the value of transactions made by a unique profile after clicking the product in the search results. |