AI Search Engine statistics
The statistics module of the AI search engine allows you to break down the search results of the customers into data categories such as filter usage, popular searches, and so on. It also gives you an insight into the words and phrases the customers use.
This article explains the way the statistics are counted.
Benefits
- You receive an idea about how product data should be structured.
- You can get to know how to configure ranking and relevance.
- You can check whether your products are properly described or represented.
- It helps you to keep the number of products balanced (to avoid having too much or too less of some products).
Requirements
The table below shows events which must be sent to Synerise in order to make specific statistics work. The item.search events are generated automatically when search results are sent back from Synerise and they are used by all models.
| Event name: | item.search.click |
transaction.charge |
|---|---|---|
| CTR | ||
| Conversion | ||
| Conversion rate | ||
| Revenue | ||
| Avg. click position | ||
| Avg. order value | ||
| Searches | ||
| Clicks | ||
| Suggestions used | ||
| No results | ||
| Most popular searches |
Statistics
- Go to
 AI Search > Indexes.
 - Select an index from the list.
- Select the Statistics tab.
- From the Search type dropdown list, select the type of search which you want to see the statistics. You can select:
- All
- Autocomplete
- Full-text
- Listing
Note:
When setting up Synerise AI Search, you can use different endpoints. Each endpoint allows you to implement AI search in a different way:
- With autocomplete, you can make requests while the user is typing.
- With full-text, make the request when the user presses ENTER.
- With listing, you can can make a search without a query phrase. You can find more information in the “Implementation” section of Configuring AI Search.
- By clicking the calendar icon, you can select the period from which you want to preview the statistics.
Global
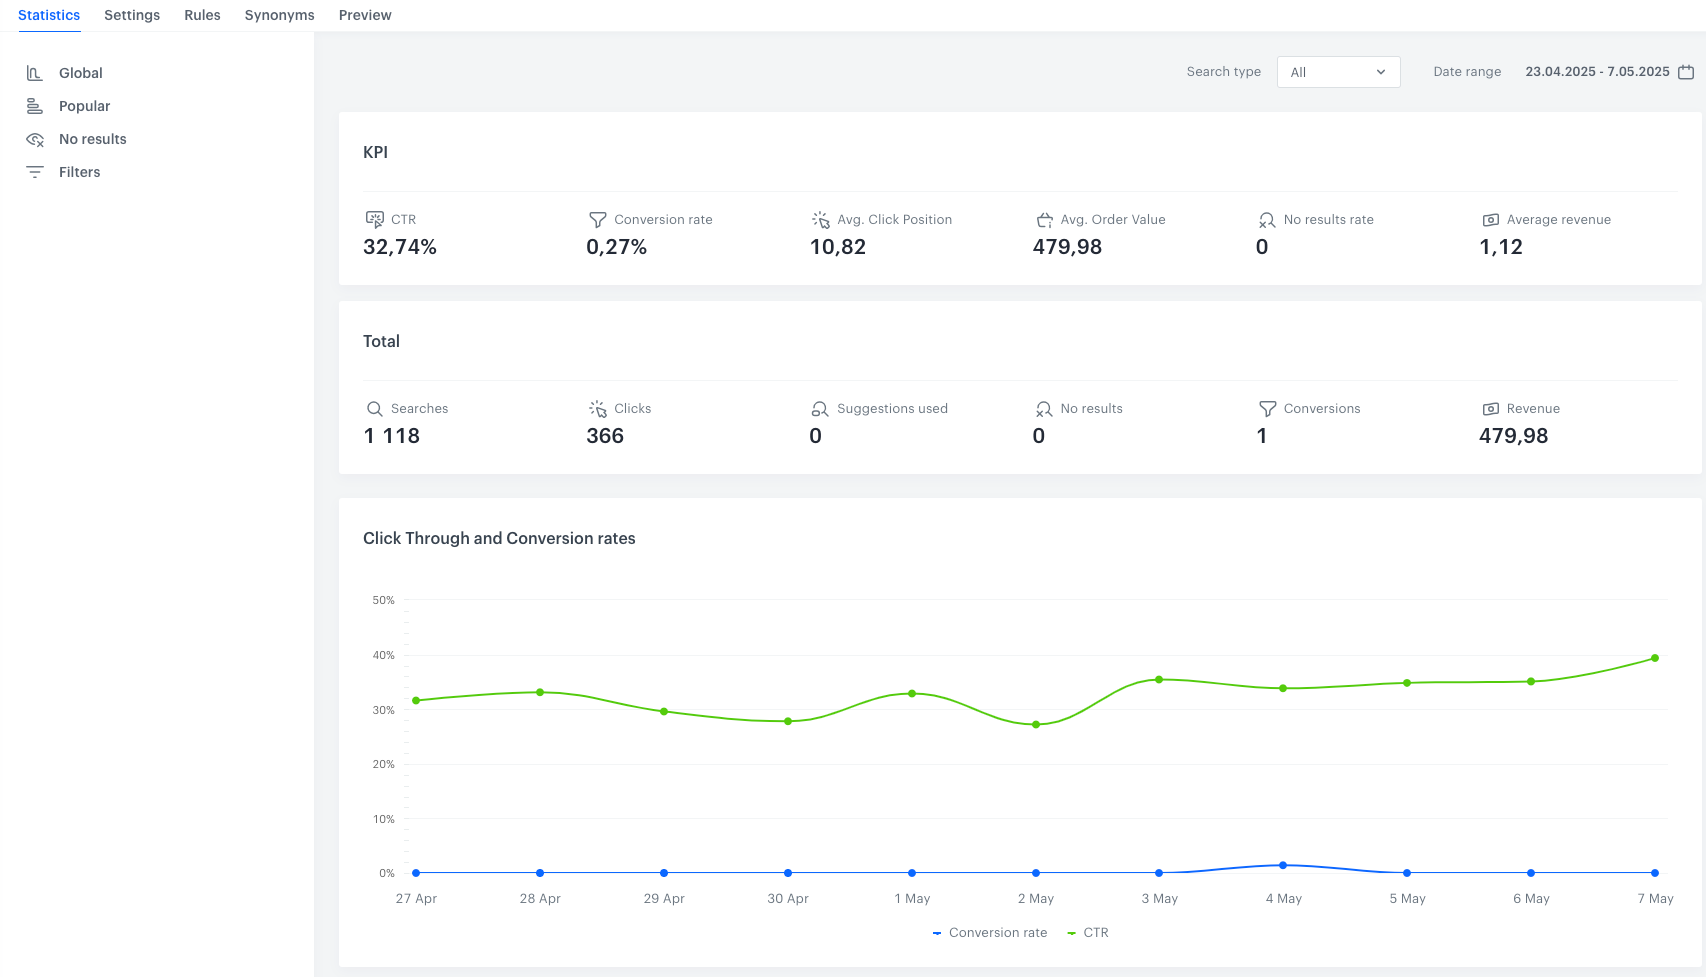
By selecting Global in the Statistics tab, you can check general search statistics for the selected index. The interface displays metrics for a specific time period. The table below shows the description of the metrics.

| Metric name | Description |
|---|---|
| CTR | (Click Through Rate) It is the ratio of the number of clicks in search results to all searches. |
| Conversion Rate | It represents the ratio of the number of conversions to the total number of clicks on search results. |
| Avg. Click Position | It is the average placement of a clicked item on a list of search results. This position is indicated by ordinal ranking, with the higher numbers representing lower positions in the search results. This metric is calculated by dividing the number of all positions to the number of all clicks on search results. |
| Avg. Order Value | It is the average amount spent by customers on a single transaction. A higher value indicates that customers are making larger purchases per transaction. This metric is calculated by dividing the value of all transactions by the number of conversions. |
| No Results rate | It is the ratio of number of search requests that returned no results to the number of all search queries. |
| Average Revenue | It is the ratio of conversions to the number of customers using the search. |
| Searches | It is the number of search queries. |
| Clicks | It is the number of clicks on the search results. |
| Suggestions Used | When a customer sends a search query that doesn’t produce any results, an internal request for suggestions is made before showing the results. This is the number of such requests. |
| No Results | It is the number of search queries with no results and no suggestions. |
| Conversions | It is the effectiveness indicator that shows how many times a unique product was bought after clicking it in the search results. A purchased item is bound to the search click event when the item is purchased in 5 or fewer days since clicking the search result. |
| Revenue | It is the value of all transactions made after clicking the product in the search results. |
Popular
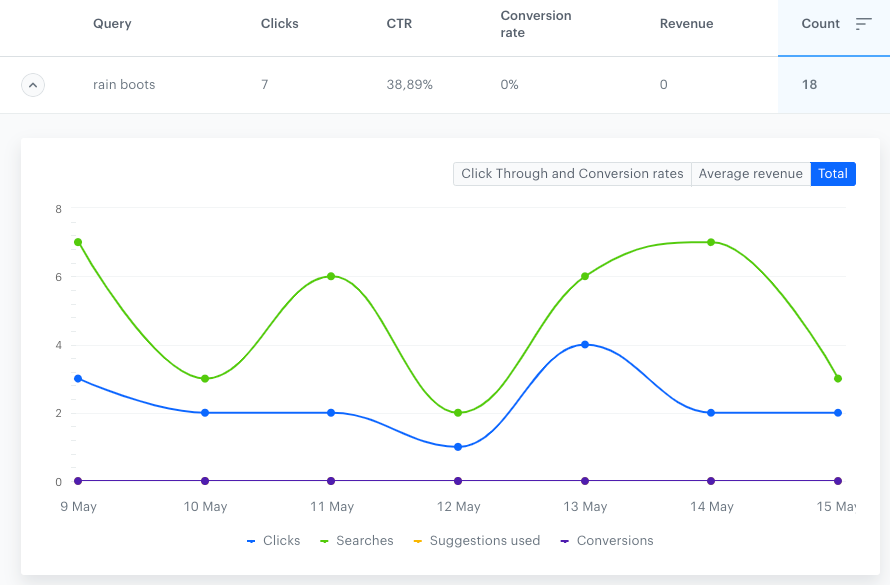
To view popular query statistics, choose the Popular option in the Statistics tab. You’ll see a list of the most commonly used queries and how often they’re used. The numbers in the columns represent the total for each metric during the chosen period. To see the metrics for each day, click the arrow on the left.

| Metric name | Description |
|---|---|
| Clicks | It is the number of clicks on the query. |
| CTR | (Click Through Rate) It is the ratio of the number of clicks in search results to all searches for this query. |
| Conversion Rate | It represents the ratio of the number of conversions* to the total number of clicks on search results for this query. |
| Revenue | It is the value of all transactions made after clicking the results of the query. |
*Conversions- It is the effectiveness indicator that shows how many times a unique product was bought after clicking it in the search results. An item is counted as purchased if the time between clicking on the search result and completing the transaction is 5 days or fewer.
No results
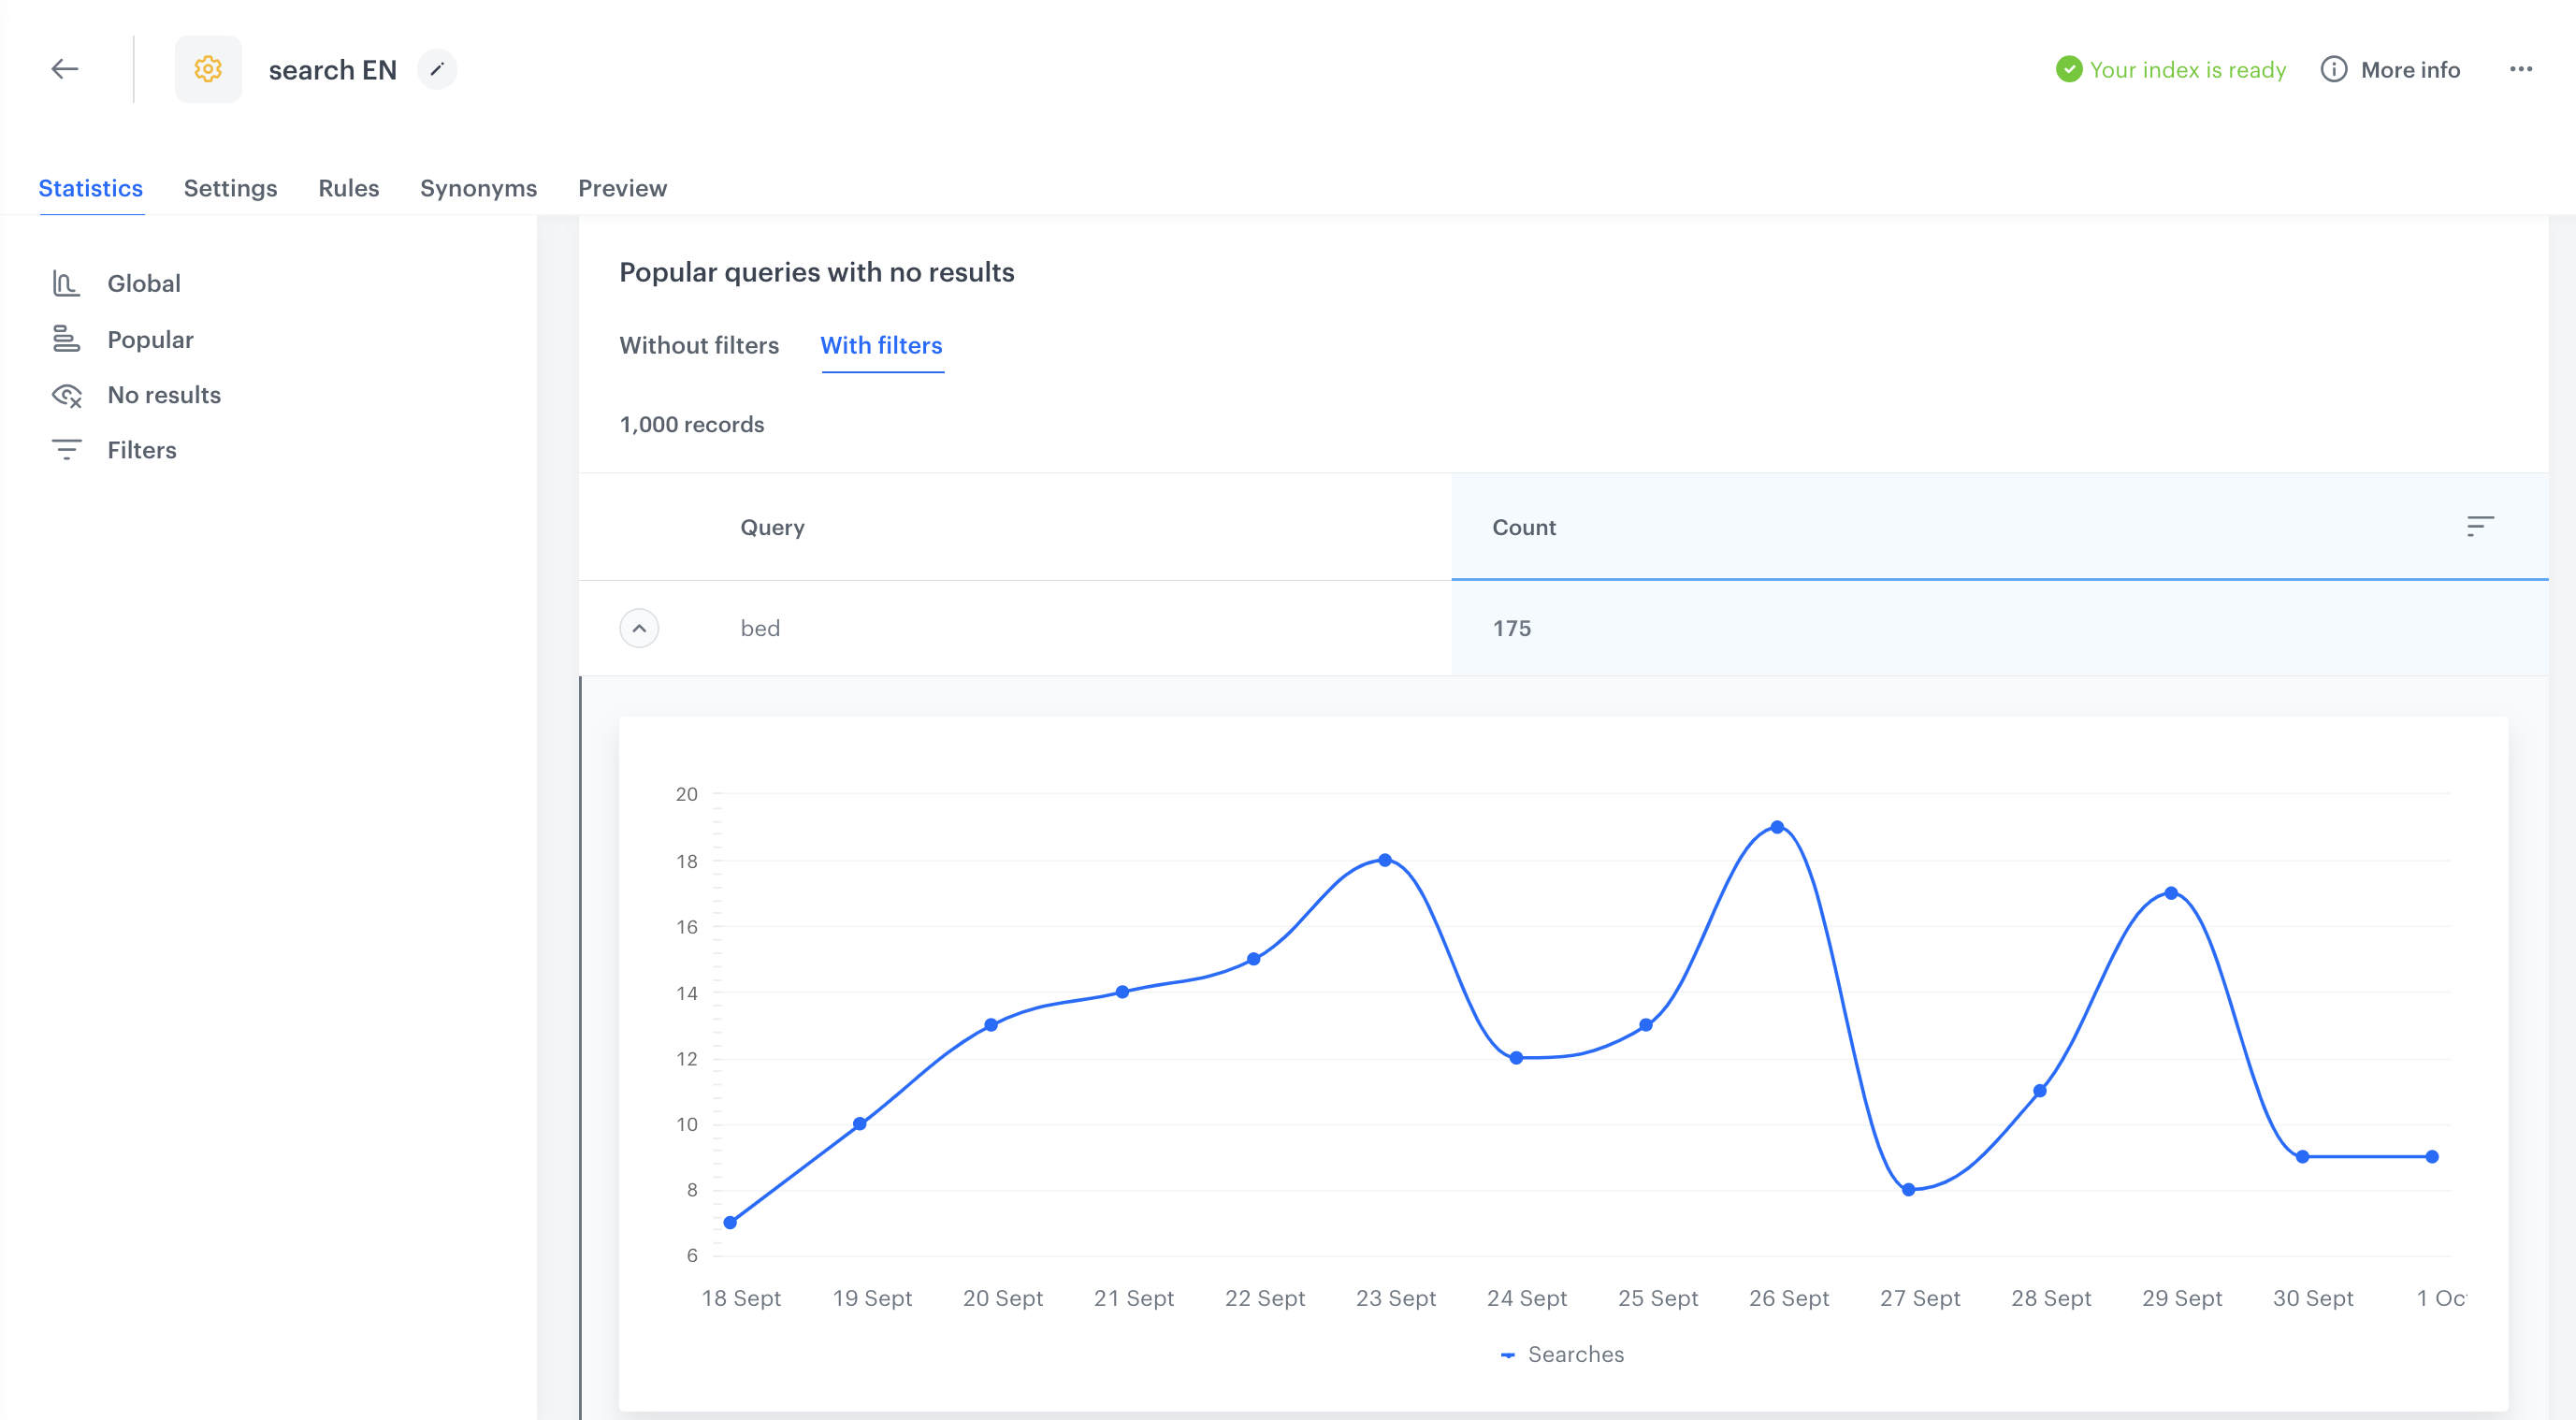
By selecting No results in the Statistics tab, you can check the results on how many times a search query didn’t find any results, with or without the visitor to the website applying search filters available on the interface.

- Query - This column contains the list of all popular queries searched in the chosen period that returned no results.
- Count - This column shows the number of times a particular phrase was searched.
Filters
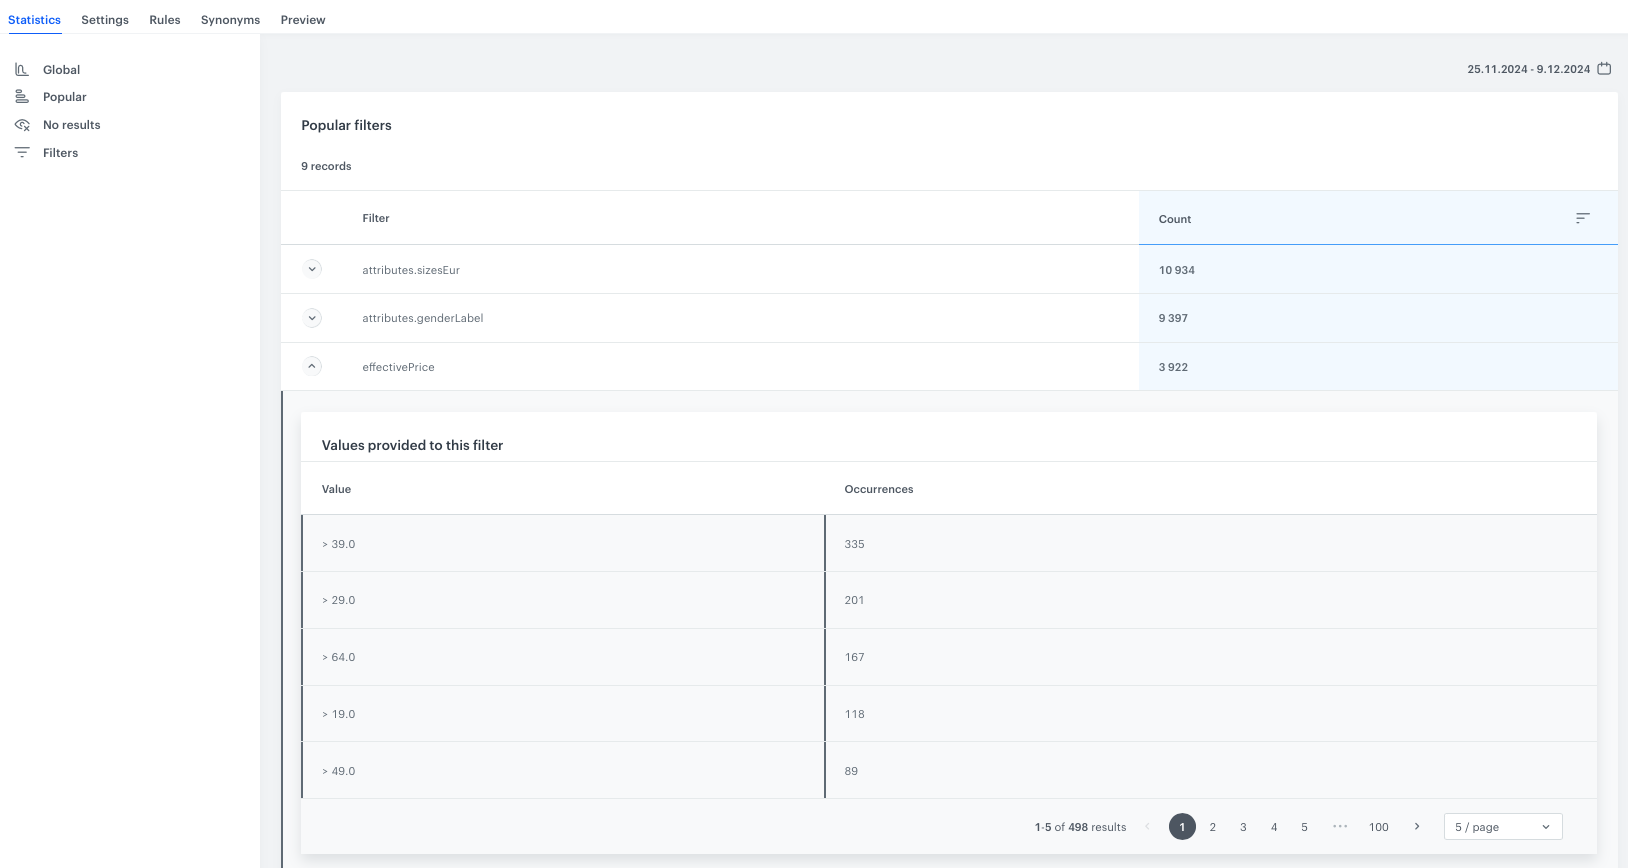
By selecting Filters in the Statistics tab, you can check how many times a particular item attribute and its value were used in the filters. Details for each attribute are accessible by clicking the arrow beside the item attribute name.
