Histograms allow users to present metrics on a chart in order to analyze the results of several metrics achieved in a specific time range. This way you can compare the sets of data against each other and examine the correlations between them.
Business benefits
- The possibility of more detailed analysis of the metrics in a specific time interval.
- Histograms can be useful when you want to compare several marketing metrics.
- You can view the change history for this analysis from its configuration - see Audit Log.
Requirements
You need to create metrics first.
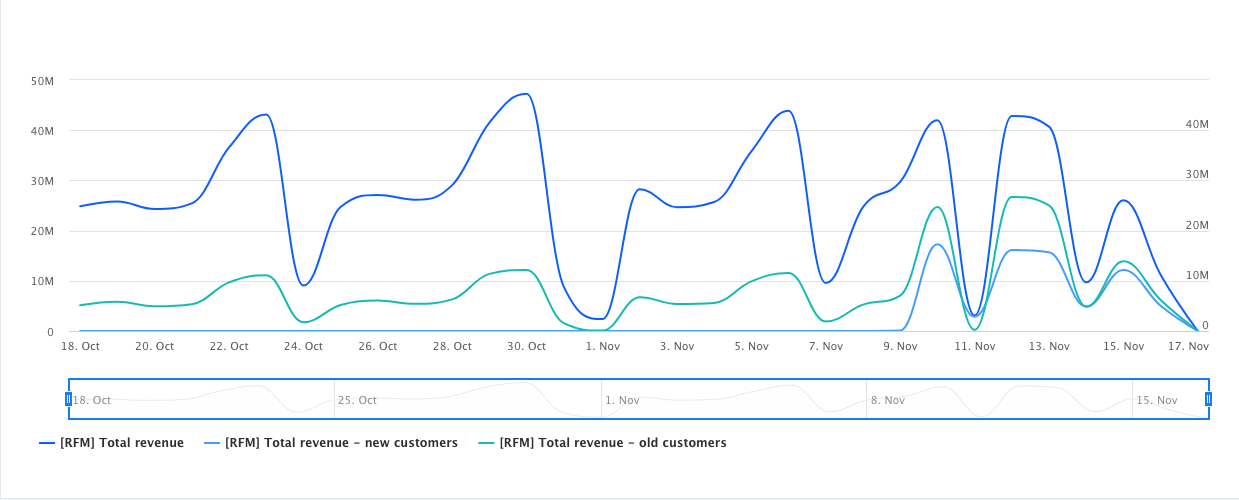
Histogram example