Calculate CTR, OR, and CTOR based on unique event occurrences
OR (Open rate), CTR (Click-through rate), and CTOR (Click-to-open rate) are indicators which marketers use to estimate the success of campaigns. One of the challenge in calculating these rates is that the customers may open the message and click the links multiple times. That is why it is so important to consider only the first (unique) occurrences of such activity.
By using the Synerise Decision Hub, you can create analyses which analyze only the unique occurrences of opening a message or clicking links included in them.
The use case describes a process of creating expressions that enrich events such as sending an email, opening of the email, clicking a link in the email with parameters like campaign and customer ID, as well as the journeyId parameter related to automation. Later on, the expressions are used in the metrics to calculate CTR, OR, and CTOR.
Prerequisites
- Configure an email account
- Send an email for which you can prepare the analysis or prepare a workflow sending emails.
Process
- Create expressions that enrich events.
- Create metrics that return the unique values of CTR, OR, CTOR
Create expressions
In this part of the process, create two event expressions of the newsletter.open, and newsletter.click events. Those expressions will enrich the events with an email address and customer ID, as well as the journeyId parameter related to automation, if the email was sent through Automation Hub. You will use these expressions in the further part of the process.
Open newsletter event
-
Go to Behavioral Data Hub > Expressions > New expression.
-
Enter a meaningful name of the expression.
-
Set the Expression for option to Event.
-
From the Choose event dropdown list, select newsletter.open event.
-
Build the expression as shown on the screenshot below:
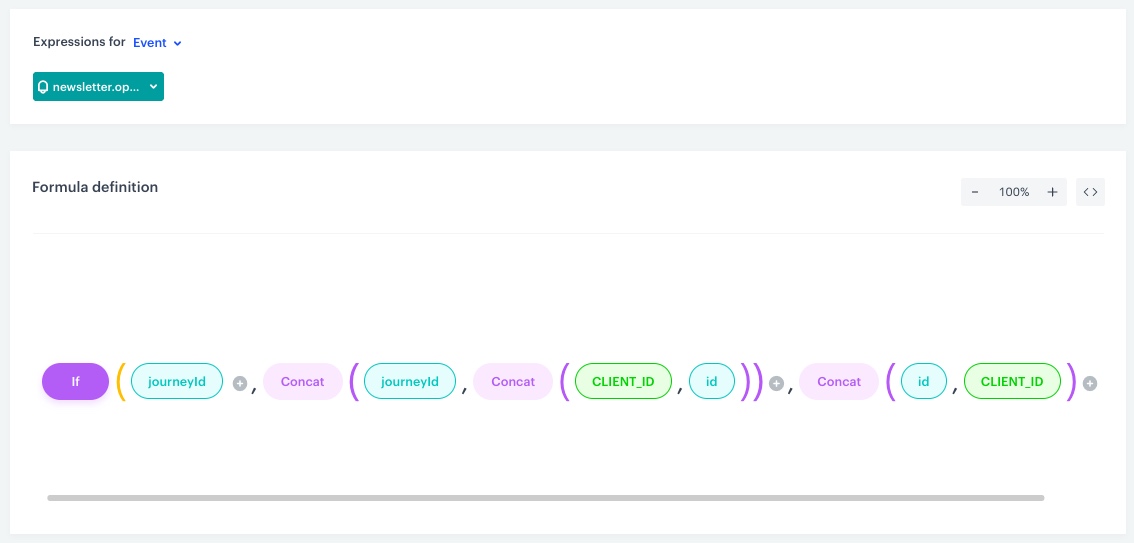
The configuration of the expression with the newsletter.open event -
Save the expression.
Click newsletter event
-
Go to Behavioral Data Hub > Expressions > New expression.
-
Enter a meaningful name of the expression.
-
Set the Expression for option to Event.
-
From the Choose event dropdown list, select newsletter.click event.
-
Build the expression as shown on the screenshot below:
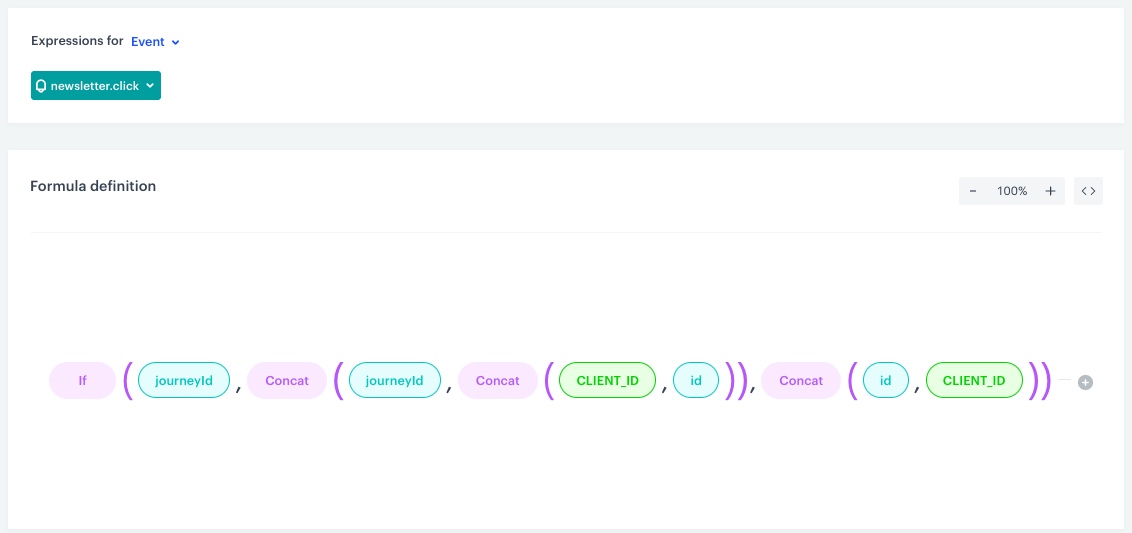
The configuration of the expression with the newsletter.click event -
Save the expression.
Create metrics
In this part of the process, use the expressions you created in the previous part of the process as factors in formula metrics which calculate CTR, OR, and CTOR as a percentage.
CTR
- Go to Decision Hub > Metrics > New metric.
- Enter the name of the metric.
- As the kind of the metric, select Formula metric.
- Click the Select node.
- From the dropdown list, select Event.
- As the aggreator, select Count distinct.
- From the Choose event dropdown list, select the
newsletter.clickevent. - In the Choose parameter dropdown, choose Expressions and from the dropdown list select the the expression for the unique occurrences of the newsletter.click event you have created in the previous step.
- Next to the node with the newsletter.click event, click the plus button.
- From the dropdown list, select Event.
- As the aggreator, select Count.
- From the Choose event dropdown list, select the
message.sendevent. - Change the mathematical operator between the nodes to division sign by clicking the plus sign between them.
- Next to the second aggregate, click the plus button.
- From the dropdown list, select Number.
- Click the added node and change the number to
100. - Change the mathematical operator between the message.send node and
100to multiplication sign by clicking the plus sign between them. - Save the metric.
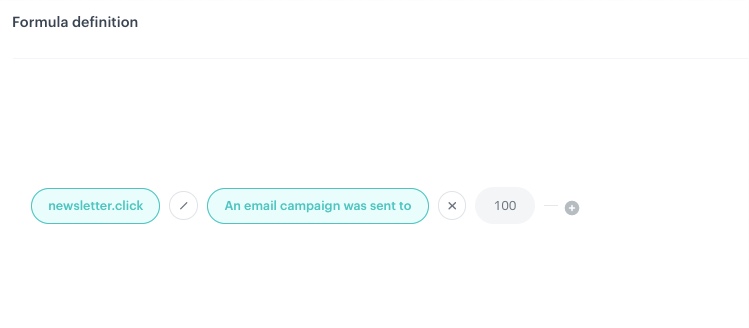
OR
-
Go to Decision Hub > Metrics > New metric.
-
Enter the name of the metric.
-
As the kind of the metric, select Formula metric.
-
Click the Select node.
-
From the dropdown list, select Event.
-
As the aggreator, select Count distinct.
-
From the Choose event dropdown list, select the
newsletter.openevent. -
In the Choose parameter dropdown, choose Expressions and from the dropdown list select the the expression for the unique occurrences of the newsletter.open event you have created in the previous step.
-
Next to the node with the newsletter.open event, click the plus button.
-
From the dropdown list, select Event.
-
As the aggreator, select Count.
-
From the Choose evente dropdown list, select the
message.sendevent. -
Change the mathematical operator between the nodes to division sign by clicking the plus sign between them.
-
Next to the second aggregate, click the plus button.
-
From the dropdown list, select Number.
-
Click the added node and change the number to
100. -
Change the mathematical operator between the message.send node and
100to multiplication sign by clicking the plus sign between them. -
Save the metric.
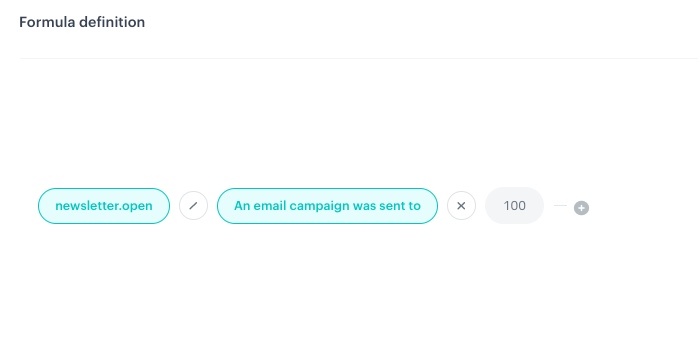
The formula of the OR metric
CTOR
-
Go to Decision Hub > Metrics > New metric.
-
Enter the name of the metric.
-
As the kind of the metric, select Formula metric.
-
Click the Select node.
-
From the dropdown list, select Event.
-
As the aggreator, select Count distinct.
-
From the Choose event dropdown list, select
newsletter.clickevent. -
In the Choose parameter dropdown, choose Expressions and from the dropdown list select the the expression for the unique occurrences of the newsletter.click event you have created in the previous step.
-
Next to the node with the
newsletter.clickevent, click the plus button. -
From the dropdown list, select Event.
-
As the aggreator, select Count distinct.
-
From the Choose event dropdown list, select the
newsletter.openevent. -
From the Choose parameter dropdown list, select the expression for the unique occurrences of the newsletter.open event you have created in the previous step.
-
Change the mathematical operator between the nodes to division sign by clicking the plus sign between them.
-
Next to the second aggregate, click the plus button.
-
From the dropdown list, select Number.
-
Click the added node and change the number to
100. -
Change the mathematical operator between the newsletter.open node and
100to multiplication sign by clicking the plus sign between them. -
Save the metric.
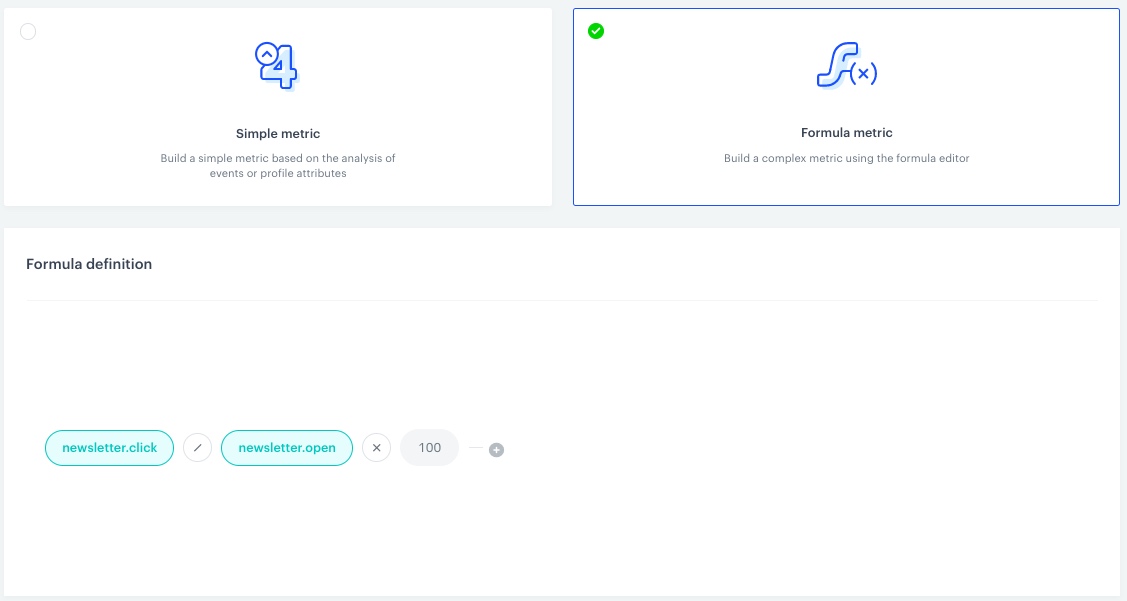
The formula of the CTOR metric
What’s next
You can display the metrics you created on a dashboard, which will help you present them in convenient and readable form as well as setting time periods from which you want the data to be presented.
Check the use case set up on the Synerise Demo workspace
You can check the configuration of each analysis from this use case in our Synerise Demo workspace.
You can find the following aggregates:
Also, you can find the following metrics:
If you’re our partner or client, you already have automatic access to the Synerise Demo workspace (1590), where you can explore all the configured elements of this use case and copy them to your workspace.
If you’re not a partner or client yet, we encourage you to fill out the contact form to schedule a meeting with our representatives. They’ll be happy to show you how our demo works and discuss how you can apply this use case in your business.


