RFM analysis
RFM segmentation is a method used to identify clusters of customers for special treatment. It is commonly used in database marketing and direct marketing, and has received particular attention in many different industries. In order to differentiate customers from data sets, the RFM method uses three different attributes:
- Recency of the last purchase (R) - refers to the interval between the time of the latest customer purchase and the current date. The shorter the interval between current date and last purchase, the higher R score is.
- Frequency of the purchases (F) - refers to the number of transactions in a particular period. The higher number of transactions, the higher the F score is.
- Monetary value of the purchases (M) - refers to monetary value of products purchased by the customer. The more the customer spends, the higher the M score is.
This lets you isolate groups, identify new or most active customers, and target personalized messages based on transaction data.
Prerequisites
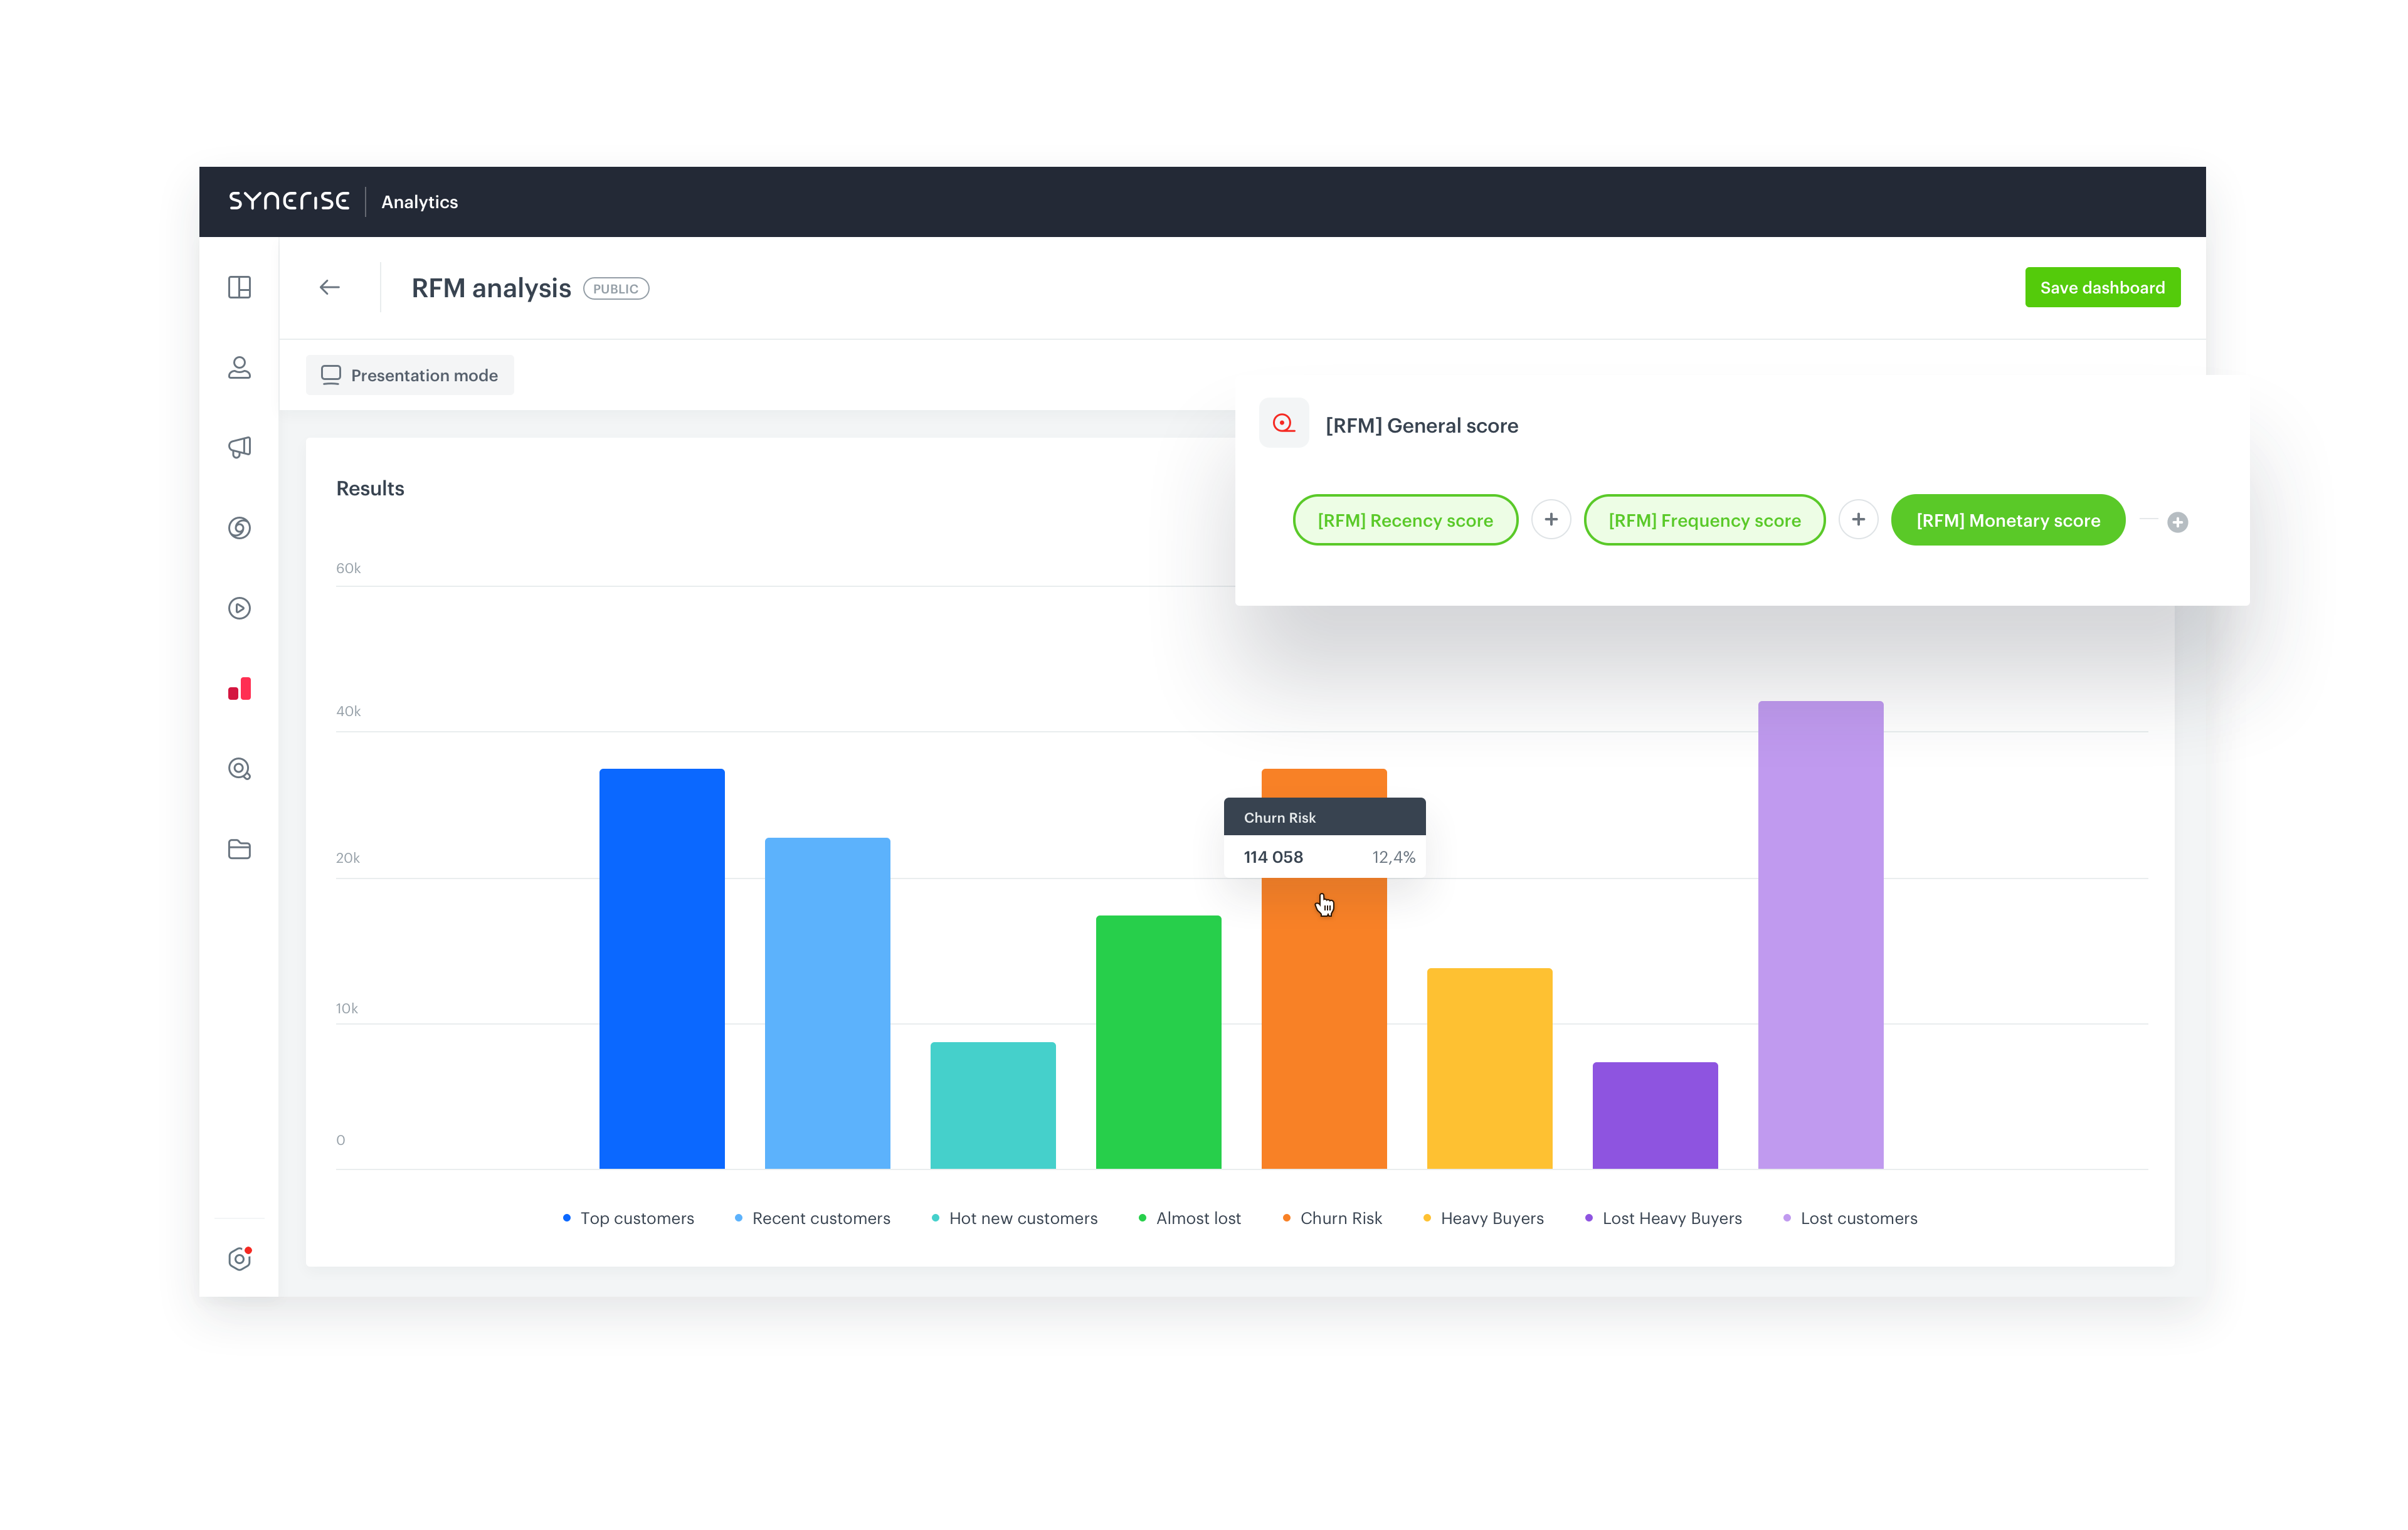
- Come up with the categories you want to organize your customers, for example: Top customers, Recent customers, Churn risk, Heavy buyers, Lost heavy buyers, Lost customers.
Process
- Create some basic analyses for later use in more complex calculations.
- Create a set of metrics for Recency, Frequency, and Monetary scores to return the value of 0.20, 0.40, 0.60, 0.80 quantiles. This way you receive four thresholds for all scores.
- Prepare segmentations for Recency, Frequency, and Monetary scores based on the values returned by the metrics you created before. The segments in these segmentations are named in the following way:
- For Recency score: 500, 400, 300, 200, 100
- For Frequency score: 50, 40, 30, 20, 10
- For Monetary score: 5, 4, 3, 2, 1
- Create an expression that adds all three segmentations, the example result is 555, which is the highest score a customer can get.
- Create a RFM segmentation that contains the segments which correspond to the customer categories (for example, Top customers, Heavy buyers, Lost customers, and so on). Define the range of scores for each category.
- Create a workflow which automates the process of updating the values of the quantile calculation metrics used in the Recency, Frequency, and Monetary segments. Such automation will ensure that you are always operating with the most up-to-date metrics, maintaining an appropriate range between all segments.
- Create a dashboard to conveniently display the results of the metrics.
Create a set of basic analyses
In this part of the process, you must create a number of analyses which will be reused later in the process.
Number of transactions
Create the aggregate that calculates the number of transactions for a single customer. It will be reused in the further analyses.
- Go to
 Behavioral Data Hub > Aggregates > Create aggregate.
 - As the aggregate type, select Profile.
- Enter a meaningful name of the aggregate.
- Set the Analyze profiles by option to Count.
- Click the Choose event dropdown list.
- From the dropdown list, select the event that signifies a purchase.
Tip: Events may have different labels between workspaces, but you can always find them by their action name (in this step, it’s transaction.charge). - Using the date picker in the lower-right corner, set the time range to Lifetime.
- Save the aggregate.

Time of the first purchase
Create the aggregate which returns the time when a customer made the first purchase. It will be reused in the further analyses.
- Go to
 Behavioral Data Hub > Aggregates > Create aggregate.
 - As the aggregate type, select Profile.
- Enter a meaningful name of the aggregate.
- Set the Analyze profiles by option to First.
- Click the Choose event dropdown list.
- From the dropdown list, select the event that signifies a purchase.
Tip: Events may have different labels between workspaces, but you can always find them by their action name (in this step, it’s transaction.charge). - Click + where button.
- On the dropdown list, click
 > Specials.
 - Choose TIMESTAMP.
- Using the date picker in the lower-right corner, set the time range to Lifetime.
- Save the aggregate.

Time of the last purchase
Create the aggregate which returns the time when a customer made the latest purchase. It will be reused in the further analyses.
- Go to
 Behavioral Data Hub > Aggregates > Create aggregate.
 - As the aggregate type, select Profile.
- Enter a meaningful name of the aggregate.
- Set the Analyze profiles by option to Last.
- Click the Choose event dropdown list.
- From the dropdown list, select the event that signifies a purchase.
Tip: Events may have different labels between workspaces , but you can always find them by their action name (in this step, it’s transaction.charge). - Click + where button.
- On the dropdown list, click
 > Specials.
 - Choose TIMESTAMP.
- Using the date picker in the lower-right corner, set the time range to Lifetime.
- Save the aggregate.

Value of purchase
Create the aggregate that returns the total amount of money a single customer spent.
- Go to
 Behavioral Data Hub > Aggregates > Create aggregate.
 - As the aggregate type, select Profile.
- Enter a meaningful name of the aggregate.
- Set the Analyze profiles by option to Sum.
- Click the Choose event dropdown list.
- From the dropdown list, select the event that signifies a purchase.
Tip: Events may have different labels between workspaces, but you can always find them by their action name (in this step, it’s transaction.charge). - Click + where button.
- On the dropdown list, select the parameter that signifies the total amount of a transaction, for example,
$totalAmount - Using the date picker in the lower-right corner, set the time range to Lifetime.
- Save the aggregate.

Number of days since last transaction
Create an attribute expression that calculates how many days passed since the last transaction. This expression reuses the aggregate that returns the timestamp of the last transaction in the last 90 days.
-
Go to
 Behavioral Data Hub > Expressions > New expression.
 -
Enter a meaningful name of the expression.
-
Leave the expression type at default (Attribute).
-
Build the following expression formula:
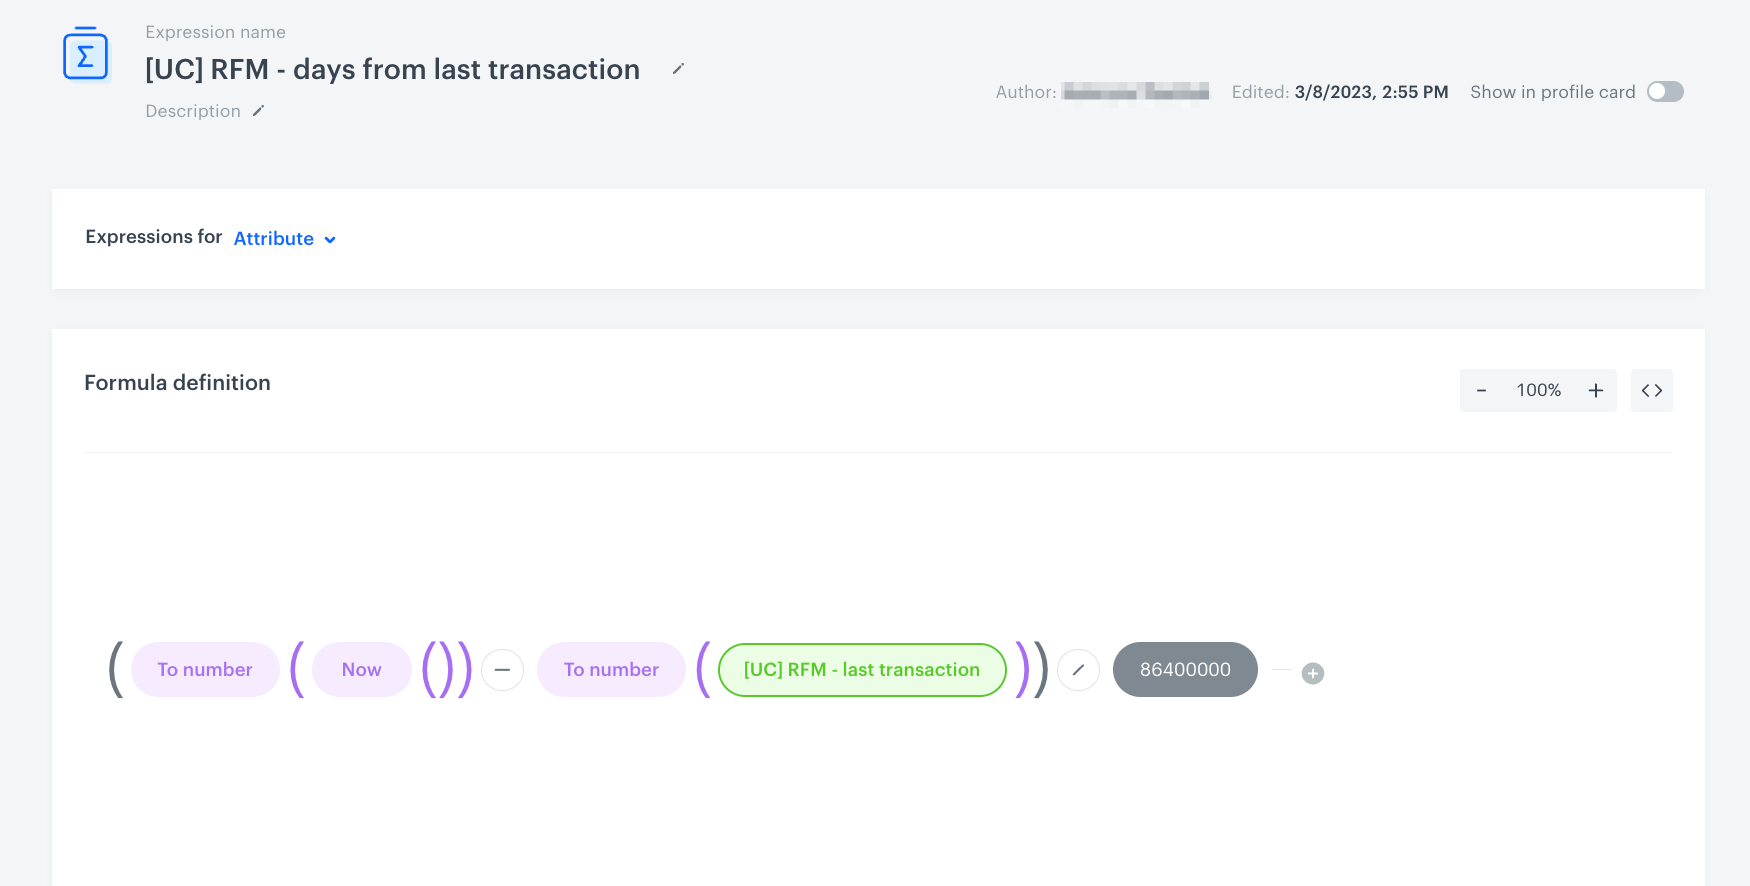
The expression formula that returns the number of days that passed since the last transaction Click here to watch the video tutorialIn the formula of the expression, you must deduct the date of the last transaction from the current date and divide the result by 86400000 to receive the number of days which passed since the last purchase.
-
Save the expression.
Number of days since the first transaction
Create an attribute expression that calculates how much time passed since the first transaction. This expression reuses the aggregate that returns the timestamp of the first transaction in the last 90 days and it will be reused in the expression that returns the number of weeks that passed from the first transaction.
-
Go to
 Behavioral Data Hub > Expressions > New expression.
 -
Enter a meaningful name of the expression.
-
Leave the expression type at default (Attribute).
-
Build the following expression formula:
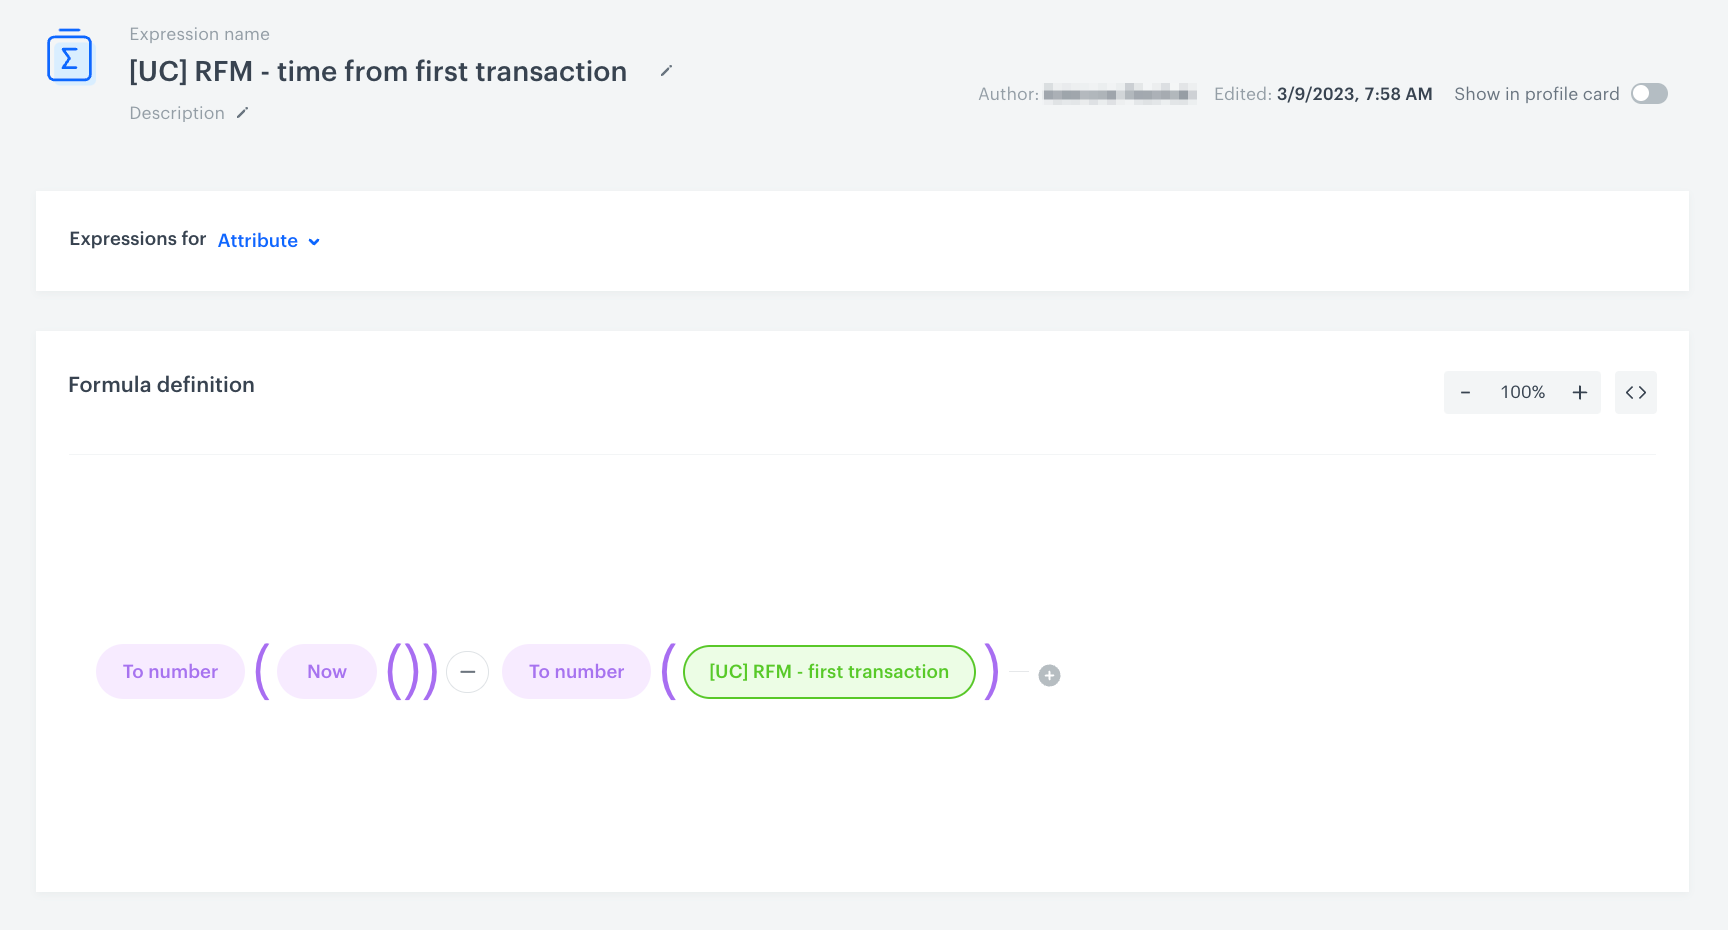
The expression formula that returns the time that passed since the first transaction Click here to watch the video tutorialIn the formula of the expression, you must deduct the date of the first transaction from the current date. The result of the expression is given in milliseconds.
-
Save the expression.
Weeks from the first transaction
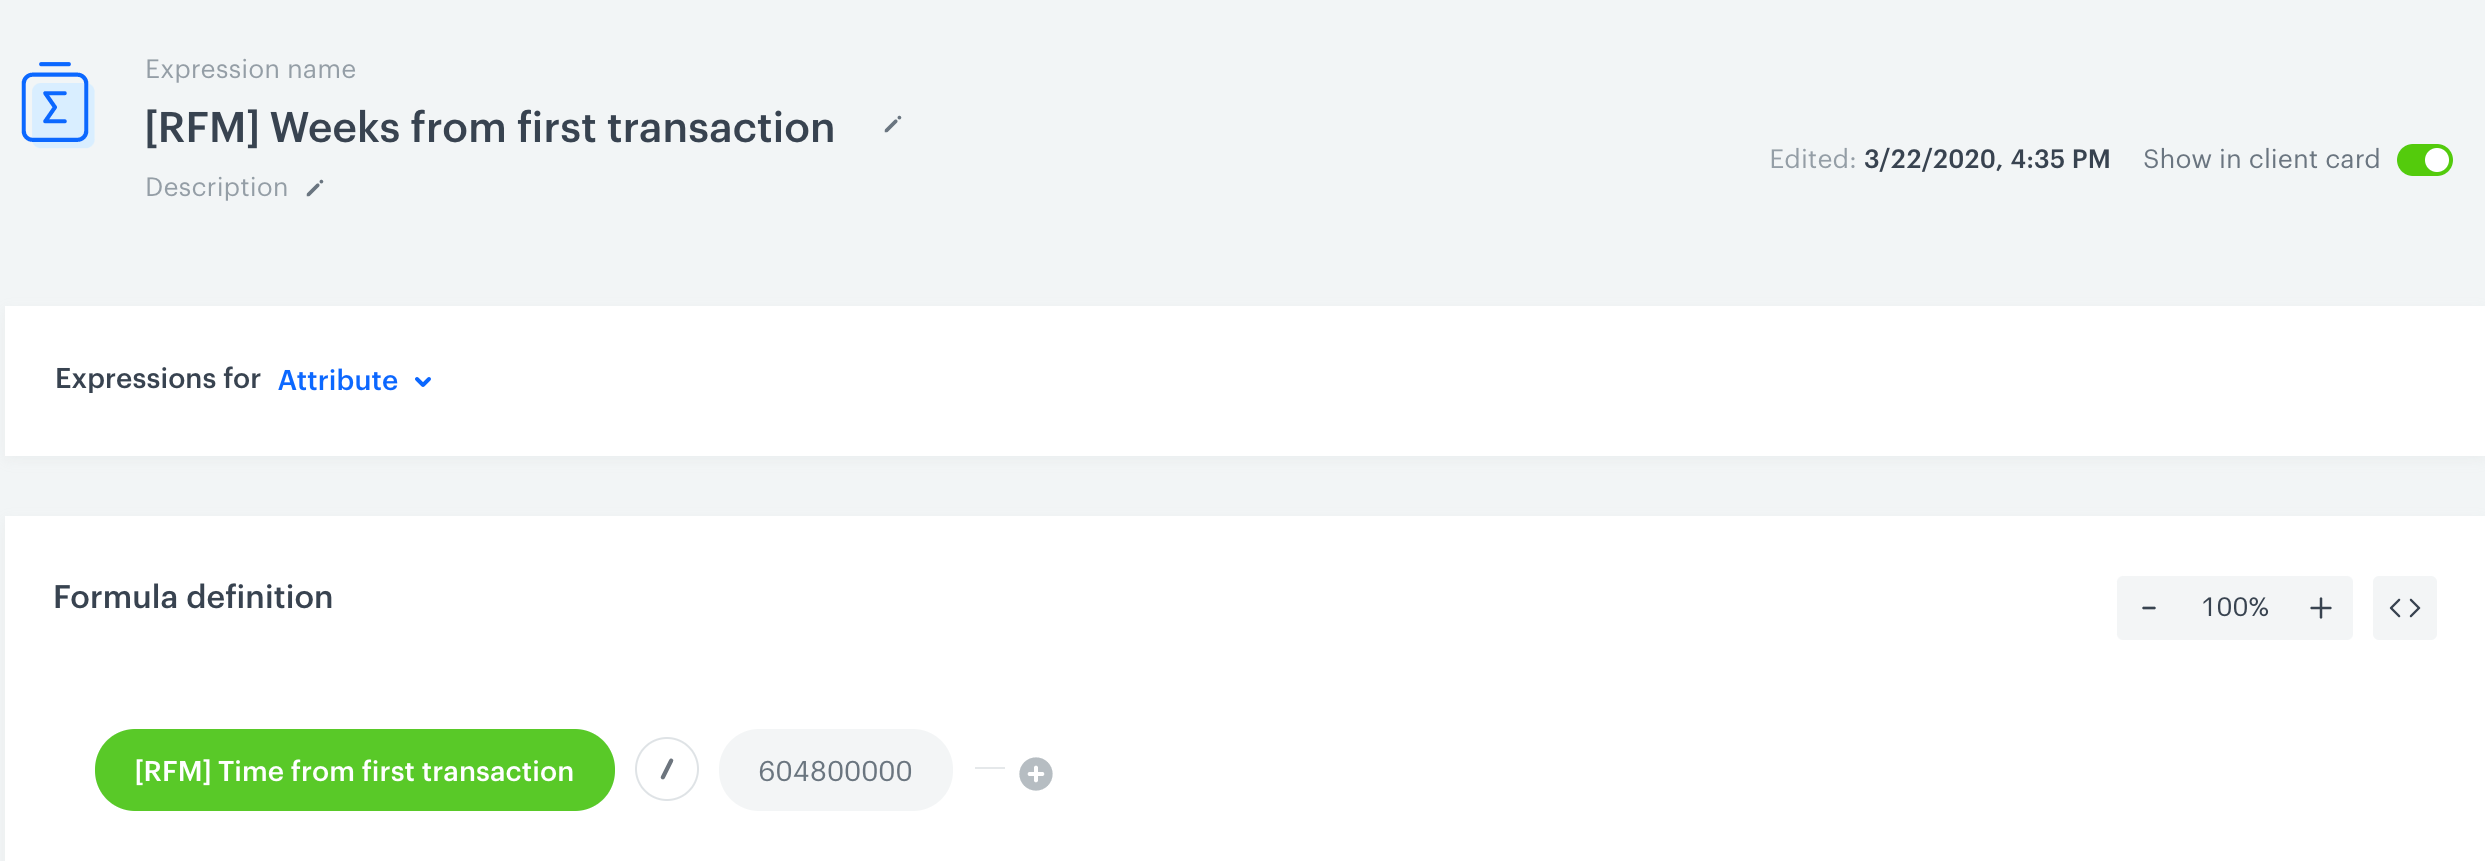
Create an expression that calculates the number of weeks since the first transaction of a customer in the last 90 days. This expression reuses the expression that calculates the time from the first transaction.
- Go to
 Behavioral Data Hub > Expressions > New expression.
 - Enter a meaningful name of the expression.
- Leave the expression type at default (Attribute).
- Build the following expression formula:
- Click the Select node.
- From the dropdown list, select Profile.
- Click the unnamed node that has been added to the canvas.
- Scroll down the page and click Choose attribute.
- Search and select the expression that calculates the time from the first transaction.
- Next to the expression on the canvas, click the plus button icon.
- Select Constant.
- Click 0 that has been added to the canvas.
- Change the number to
604800000. - Click the mathematical operator between the nodes and change it to a division sign.
- Save the expression.
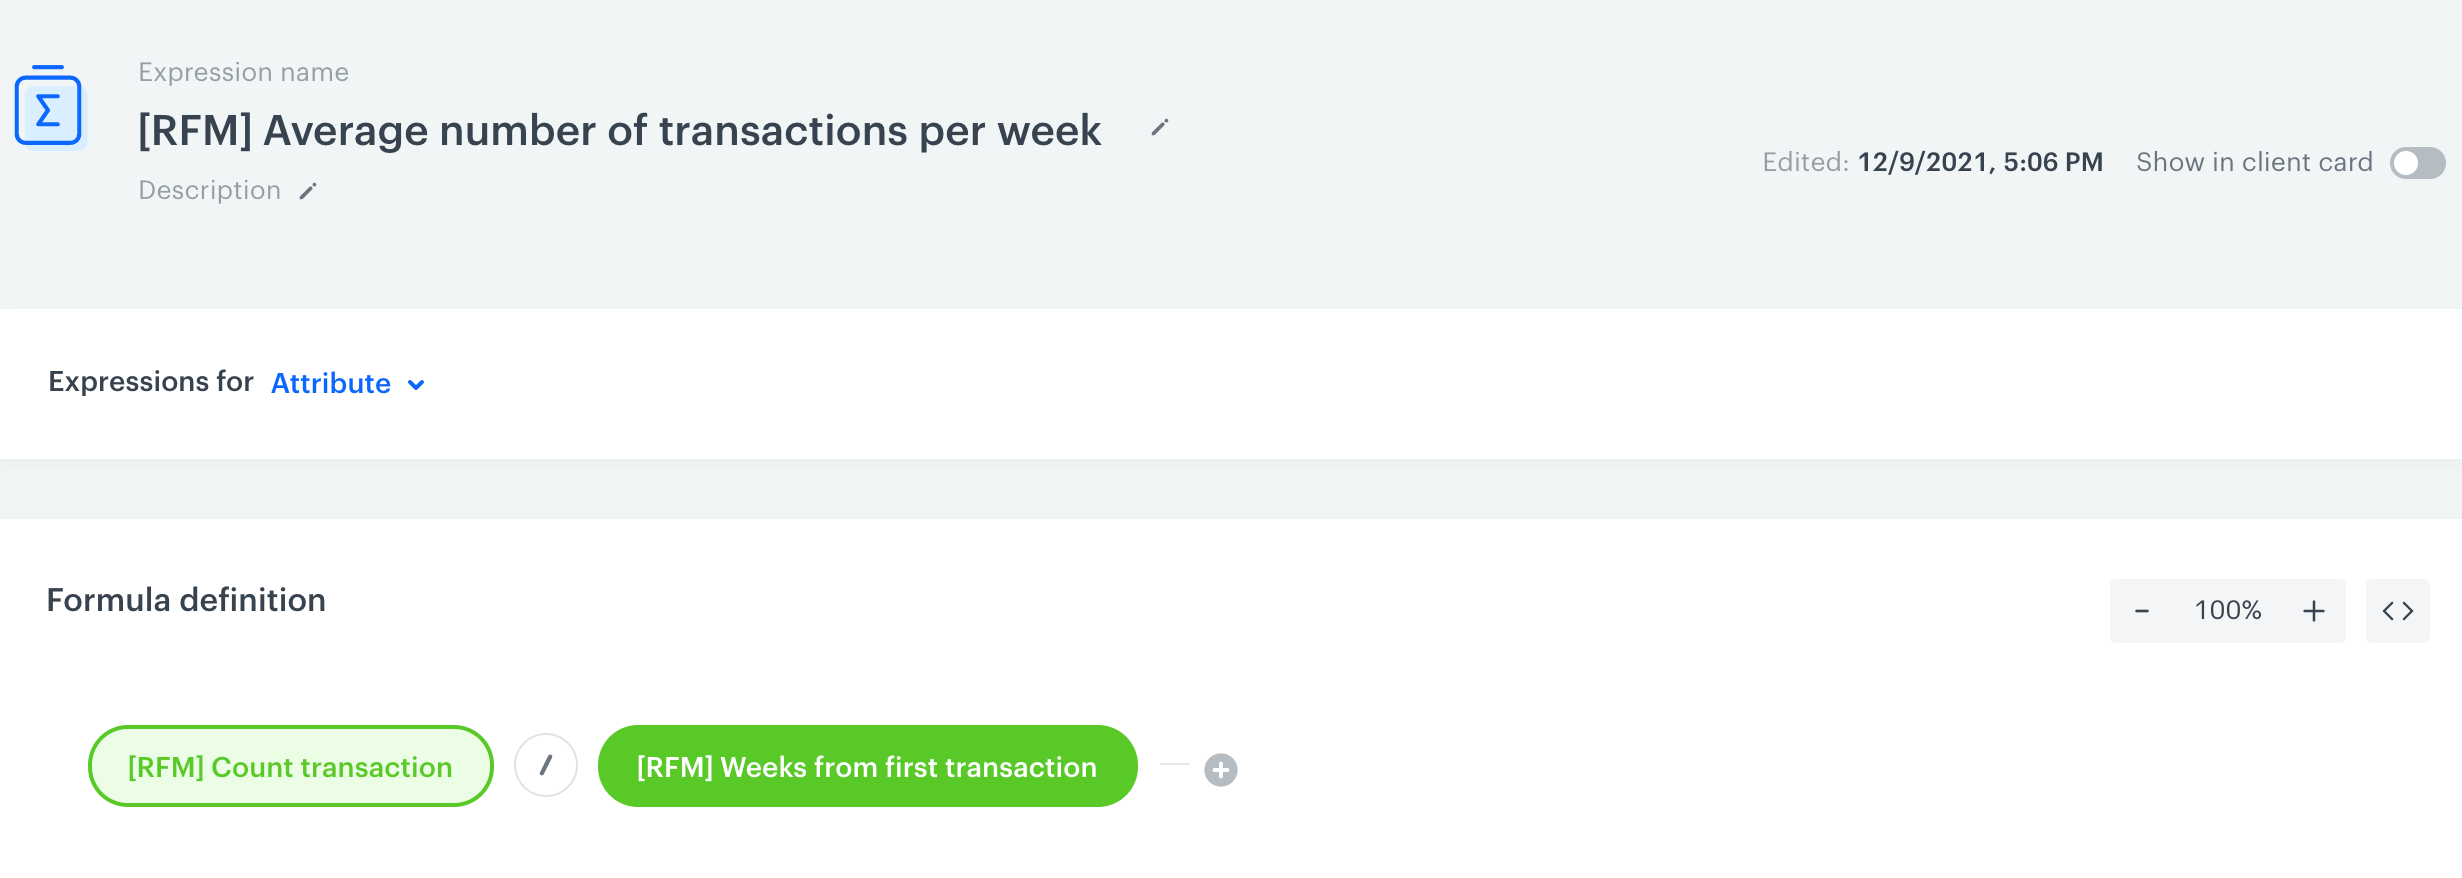
Average number of transactions per week
Create an expression that calculates the average number of transactions a customer made per week in the last 90 days. This expression reuses the aggregate that calculates the number of transactions in the last 90 days and the expression that calculates the number of weeks since the first transaction in the last 90 days.
- Go to
 Behavioral Data Hub > Expressions > New expression.
 - Enter a meaningful name of the expression.
- Leave the expression type at default (Attribute).
- Build the following expression formula:
- Click the Select node.
- From the dropdown list, select Profile.
- Click the unnamed node that has been added to the canvas.
- Scroll down the page and click Choose attribute.
- Search and select the aggregate that calculates the number of transactions.
- Next to the expression on the canvas, click the plus button icon.
- Select Profile.
- Click the unnamed node that has been added to the canvas.
- Scroll down the page and click Choose attribute.
- Search and select the expression that calculates weeks from first transactions.
- Click the mathematical operator between the nodes and change it to a division sign.
- Save the expression.
Create metrics
In this part of the process, prepare metrics which will calculate the following quantiles: 0.80, 0.60, 0.40, 0.20 for the values of the expressions and an aggregate:
- the number of days that passed since last transaction (Recency)
- the average number of transactions in a week (Frequency)
- total value of transactions in last 90 days (Monetary)
Create four metrics for each score (which means that in total you will create 12 metrics). This way, you can distinguish tresholds for Recency, Frequency, and Monetary scores.
Recency score
-
Go to
 Decision Hub > Metrics > New metric.
 -
Enter a meaningful metric name.
-
Leave the metric kind at default (Simple).
-
Change the Metric type to Profile.
-
Change the Aggregator option to Quantile.
-
Next to the Quantile option, in the text field, enter
0.80. -
Click Choose value.
-
Search and select the expression that returns the number of days that passed since the last transaction.
-
Click Enable filter.
-
Click Choose filter.
-
Search and select the transaction.charge event.
-
Set the time range to Lifetime.
-
Confirm the filter settings by clicking Apply.
-
Save the metric.
-
Create three metrics with the same settings for the following quantile values:
0.60,0.40, and0.20.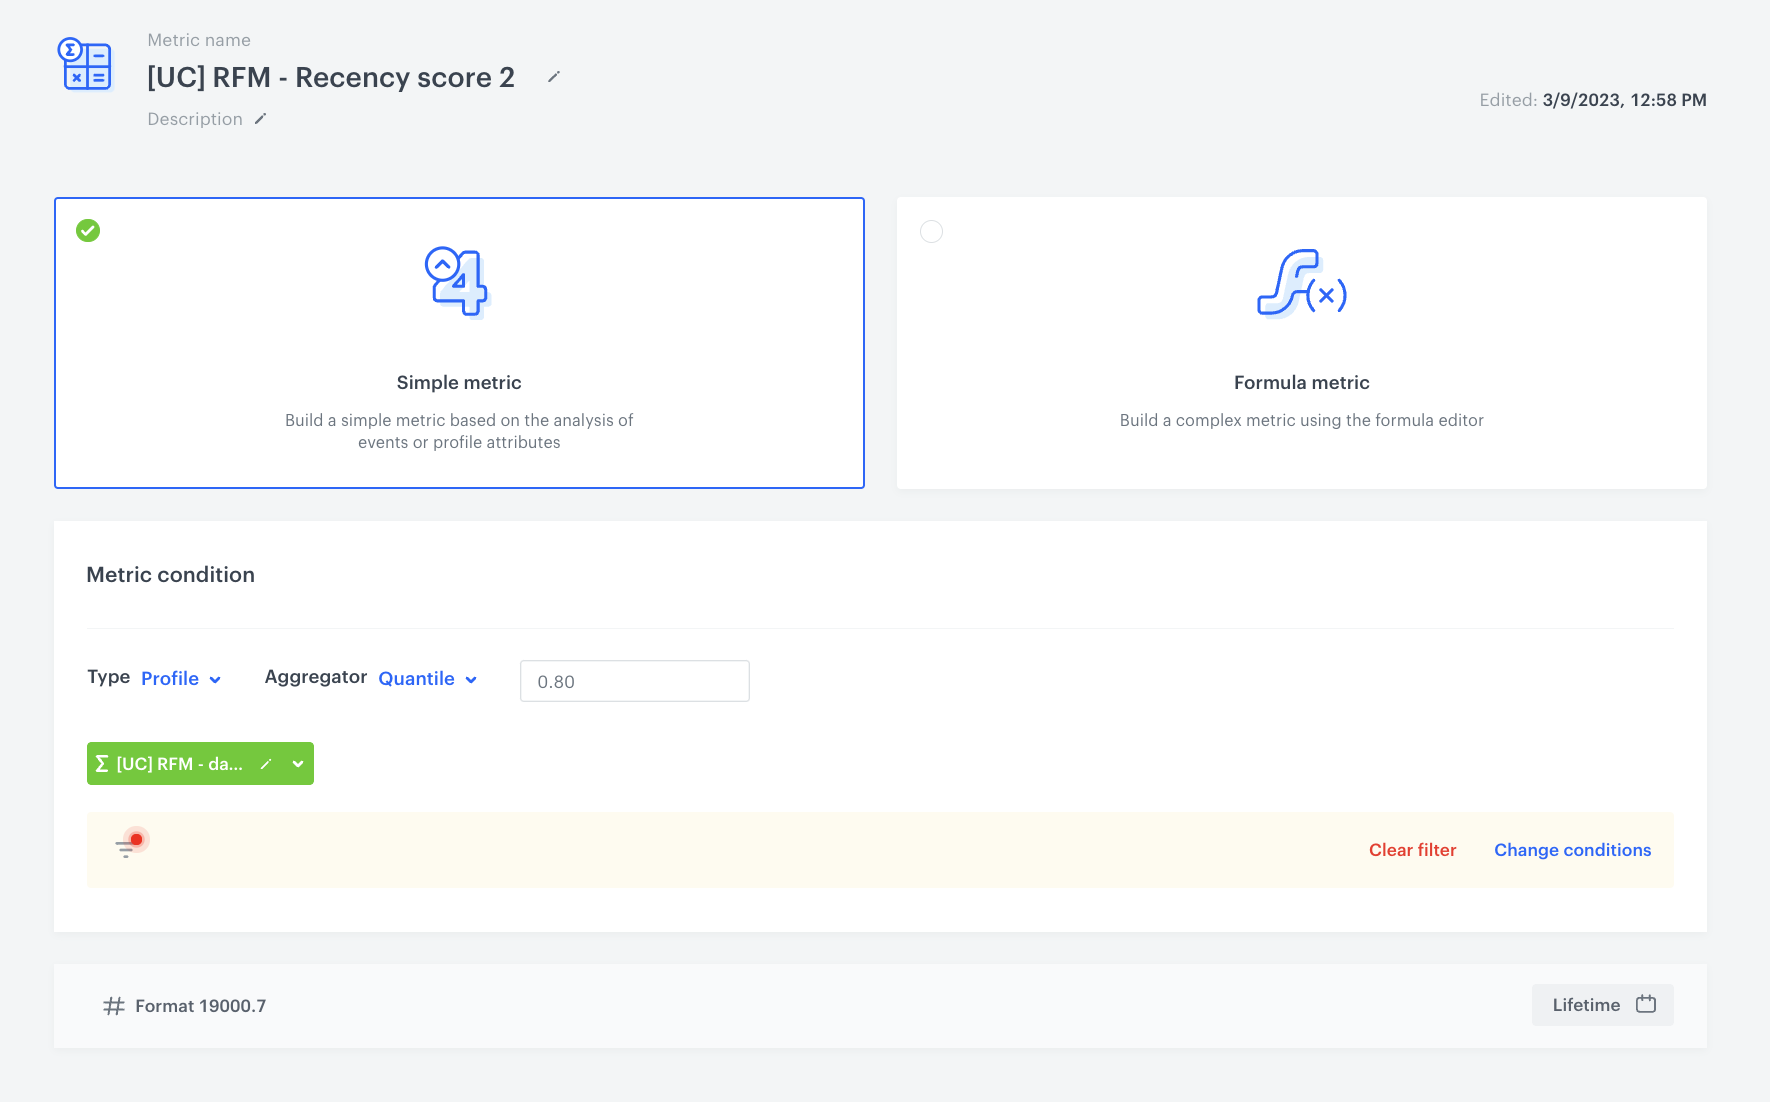
The metric that calculates 0.80 quantile of the expression
Frequency score
- Go to
 Decision Hub > Metrics > New metric.
 - Enter a meaningful metric name.
- Leave the metric kind at default (Simple).
- Change the Metric type to Profile.
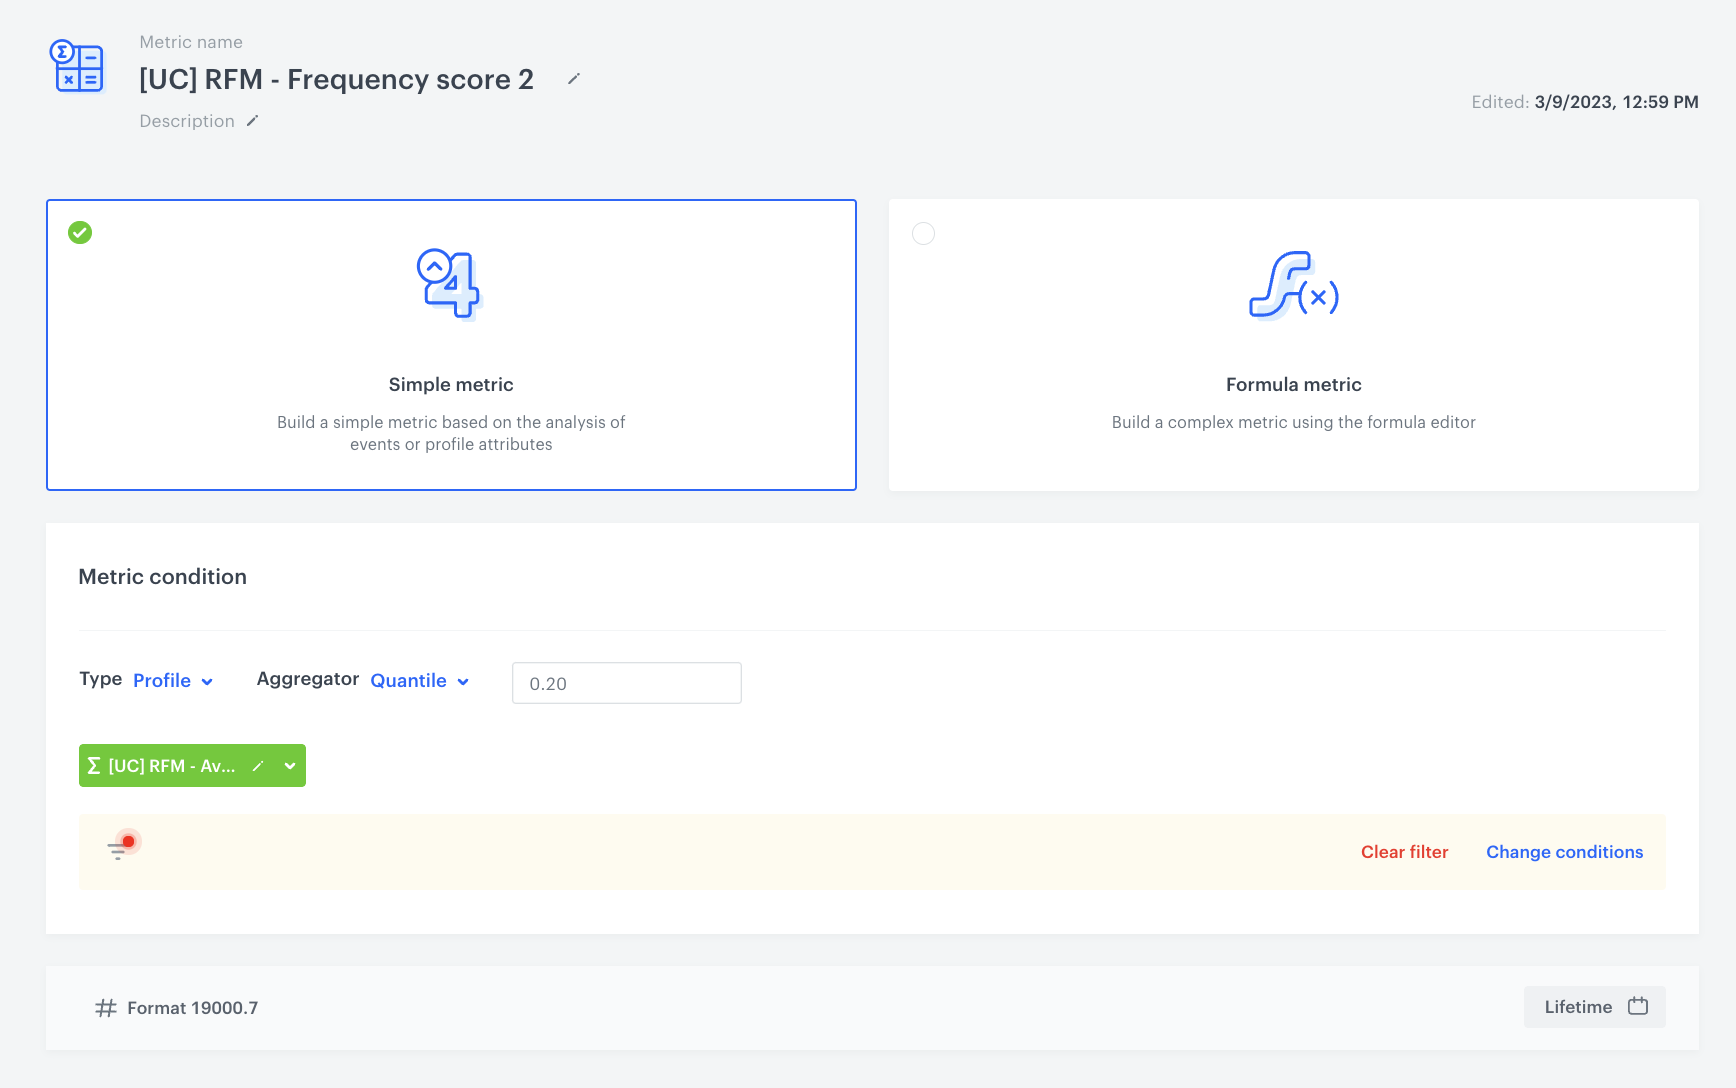
- Change the Aggregator option to Quantile.
- Next to the Quantile option, in the text field, enter
0.20. - Click Choose value.
- Search and select the expression that returns the average number of transactions in a week.
- Click Enable filter.
- Click Choose filter.
- Search and select the transaction.charge event.
- Set the time range to Lifetime.
- Confirm the filter settings by clicking Apply.
- Save the metric.
- Create three metrics with the same settings for the following quantile values:
0.40,0.60, and0.80.
Monetary score
- Go to
 Decision Hub > Metrics > New metric.
 - Enter a meaningful metric name.
- Leave the metric kind at default (Simple).
- Change the Metric type to Profile.
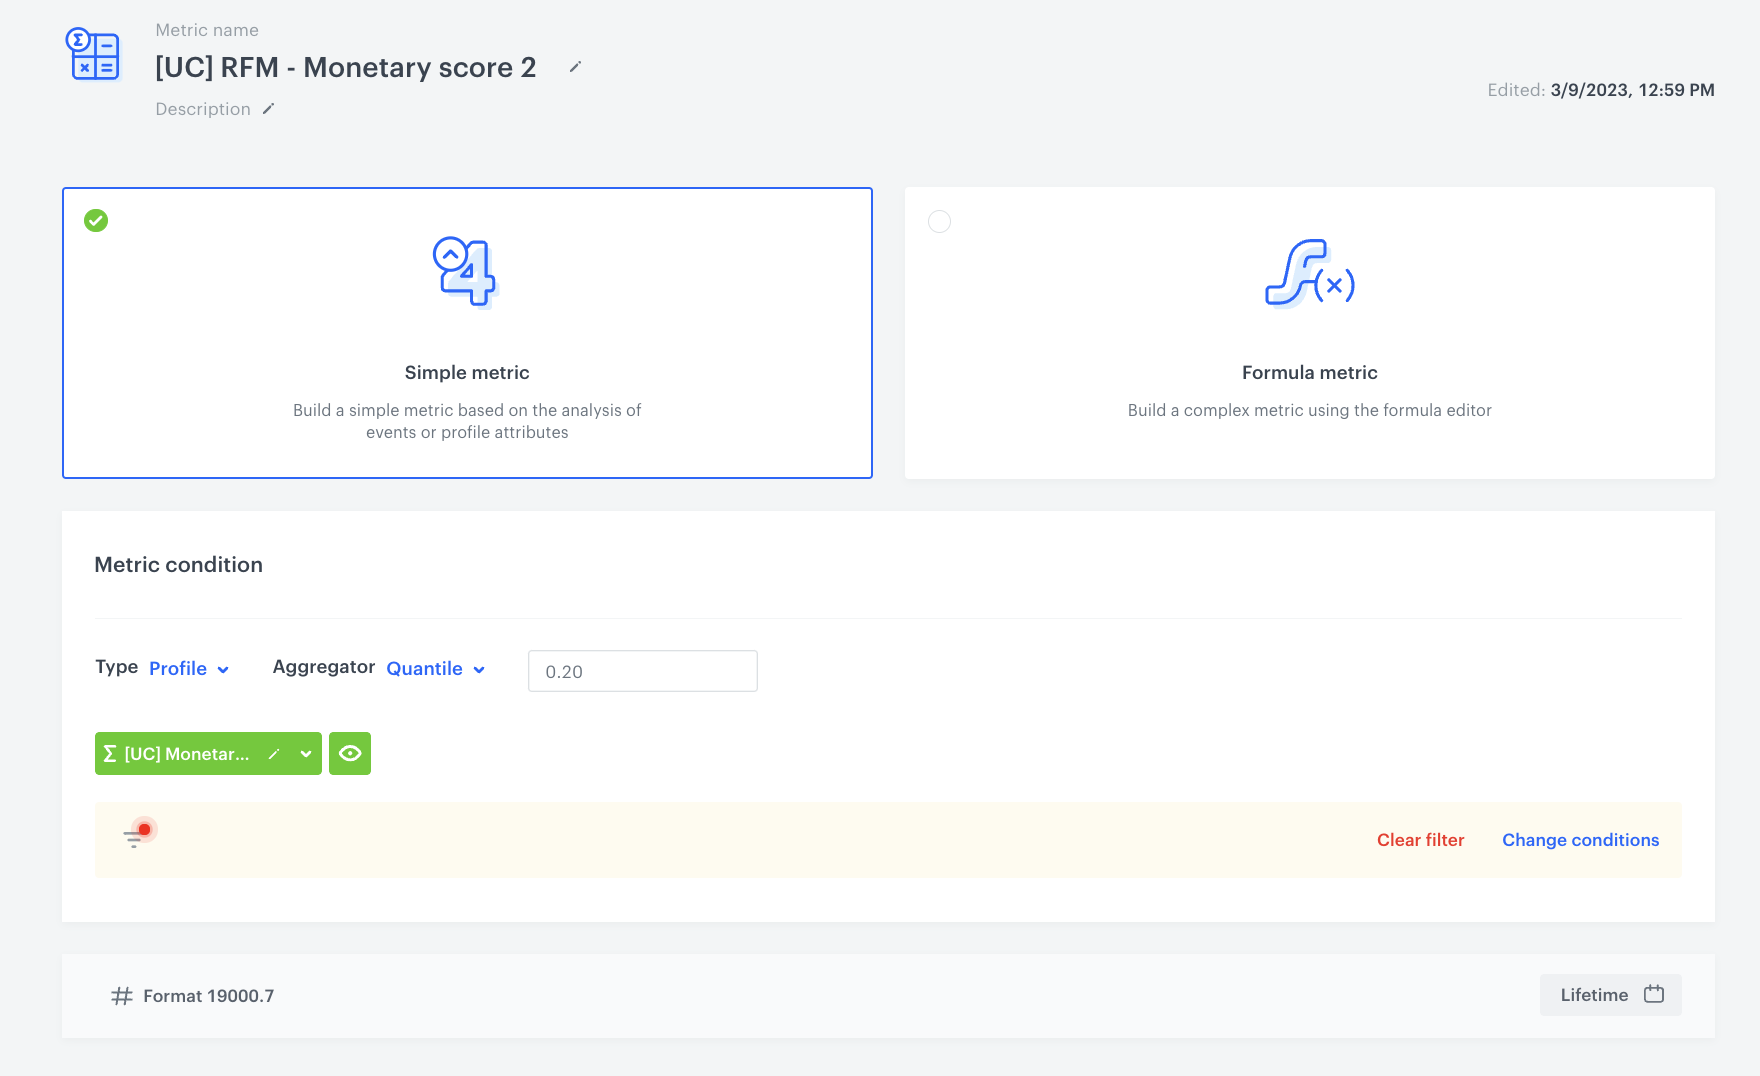
- Change the Aggregator option to Quantile.
- Next to the Quantile option, in the text field, enter
0.20. - Click Choose value.
- Search and select the aggregate that returns the value of purchases in last 90 days.
- Click Enable filter.
- Click Choose filter.
- Search and select the transaction.charge event.
- Set the time range to Lifetime.
- Confirm the filter settings by clicking Apply.
- Save the metric.
- Create three metrics with the same settings for the following quantile values:
0.40,0.60, and0.80.
Create segmentations
Based on the values returned by the metrics you created before, create three segmentations for Recency, Frequency and Monetary scores. Each of the segmentation contains 5 segments. Each segment reuses the result of a quantile calculated by the metrics.
The segments are named in the following way:
- For Recency score: 500, 400, 300, 200, 100
| Segment | 500 | 400 | 300 | 200 | 100 |
|---|---|---|---|---|---|
| Conditions | The value lower than the 0.20 quantile |
The value lower than the 0.40 quantile but higher than 0.20 quantile |
The value lower than the 0.60 quantile but higher than 0.40 quantile |
The value lower than the 0.80 quantile but higher than 0.60 quantile |
The value higer than 0.80 quantile |
- For Frequency score: 50, 40, 30, 20, 10
| Segment | 50 | 40 | 30 | 20 | 10 |
|---|---|---|---|---|---|
| Conditions | The value higher than 0.80 quantile |
The value lower than 0.80 quantile but higher than 0.60 quantile |
The value lower than 0.60 quantile but higher than 0.4 quantile |
The value lower than 0.40 quantile but higher than 0.20 quantile |
The value lower than 0.20 quantile |
- For Monetary score: 5, 4, 3, 2, 1
| Segment | 5 | 4 | 3 | 2 | 1 |
|---|---|---|---|---|---|
| Conditions | The value higher than 0.80 quantile |
The value lower than 0.80 quantile but higher than 0.60 quantile |
The value lower than 0.60 quantile but higher than 0.4 quantile |
The value lower than 0.40 quantile but higher than 0.20 quantile |
The value lower than 0.20 quantile |
Customers belong to a specific segment under defined circumstances and based on the segment classification the overall score will be created, for example, a customer can belong to the following segments: 500 (R), 20 (F), 3 (M). In the next part of the process, these values will be added in an expression to produce the final RFM score, which in this example will be 523.
Recency
- Go to
 Decision Hub > Segmentations > New segmentation.
 - Enter a meaningful name of the segmentation.
- As the name of the segment, enter
500. - Click Add condition.
- Search and select the expression that returns the number of days since the last transaction.
- As the logical operator select Less than.
- In the text field, next to the logical operator, enter the number returned by the metrics that calculate the
0.20quantile. In this use case, the quantile result amounts to43.3, so the customers who made a transaction less than 43 days after the date of the last transaction, belong to 500. It means that the R score of the customer is 500, which is the highest. - Add the rest of segments by clicking the
 icon.
icon. - For the following segments, add the conditions listed below:
- For the 400 segment: more than the value of the
0.20quantile AND less than0.40quantile - For the 300 segment: more than the value of the
0.40quantile AND less than0.60quantile - For the 200 segment: more than the value of the
0.60quantile AND less than0.80quantile - For the 100 segment: less than the value of the
0.80quantile AND segment of loyal customers AND add the transaction.charge event with the Lifetime time range.

The configuration of the Recency score segmentation - For the 400 segment: more than the value of the
Frequency
- Go to
 Decision Hub > Segmentations > New segmentation.
 - Enter a meaningful name of the segmentation.
- As the name of the segment, enter
50. - Click Add condition.
- Search and select the expression that returns the average number of transactions per week.
- As the logical operator select More than or equal.
- In the text field, next to the logical operator, enter the number returned by the metrics that calculate the
0.80quantile. In this use case, the quantile result amounts to0.4, so the customers who make more than 0.4 transaction a week, belong to 50. It means that the F score of the customer is 50, which is the highest. - Add the rest of segments by clicking the
 icon.
icon. - For the following segments, add the conditions listed below:
- For the 40 segment: more than the value of the
0.60quantile AND less than0.80quantile - For the 30 segment: more than the value of the
0.40quantile AND less than0.60quantile - For the 20 segment: more than the value of the
0.20quantile AND less than0.40quantile - For the 10 segment: less than the value of the
0.20quantile AND segment of loyal customers AND add the transaction.charge event with the Lifetime time range.

The configuration of the Frequency segmentation - For the 40 segment: more than the value of the
Monetary
- Go to
 Decision Hub > Segmentations > New segmentation.
 - Enter a meaningful name of the segmentation.
- As the name of the segment, enter
5. - Click Add condition.
- Search and select the aggregate that returns the value of transactions.
- As the logical operator select More than or equal.
- In the text field, next to the logical operator, enter the number returned by the metrics that calculate the
0.80quantile. In this use case, the quantile result amounts to2243 PLN, so the customers who spent this amount of money or more, belong to 5. It means that the M score of the customer is 5, which is the highest. - Add the rest of segments by clicking the
 icon.
icon. - For the following segments, add the conditions listed below:
- For the 4 segment: more than the value of the
0.60quantile AND less than0.80quantile - For the 3 segment: more than the value of the
0.40quantile AND less than0.60quantile - For the 2 segment: more than the value of the
0.20quantile AND less than0.40quantile - For the 1 segment: less than the value of the
0.20quantile AND add the transaction.charge event with the Lifetime time range.

The configuration of the Monetary segmentation - For the 4 segment: more than the value of the
Create an expression
In this part of the process, create an expression that adds the segmentations a customer belongs to, in order to produce the final RFM score.
- Go to
 Behavioral Data Hub > Expressions > New expression.
 - Enter a meaningful name of the expression.
- Leave the expression type at default (Attribute).
- Build the formula of the expression that adds the three segmentations you created in the previous part of the procedure.
- Click the Select node.
- From the dropdown list, select Profile.
- Click the unnamed node that appeared on the canvas.
- Scroll down the page and click Choose attribute.
- On the dropdown list select the Recency segmentation.
- Next to the segmentation added to the canvas, click the plus button.
- Repeat steps from 1 to 6 for the Frequency and Monetary segmentations.
- Click the mathematical operator between the nodes and change it to a plus sign.
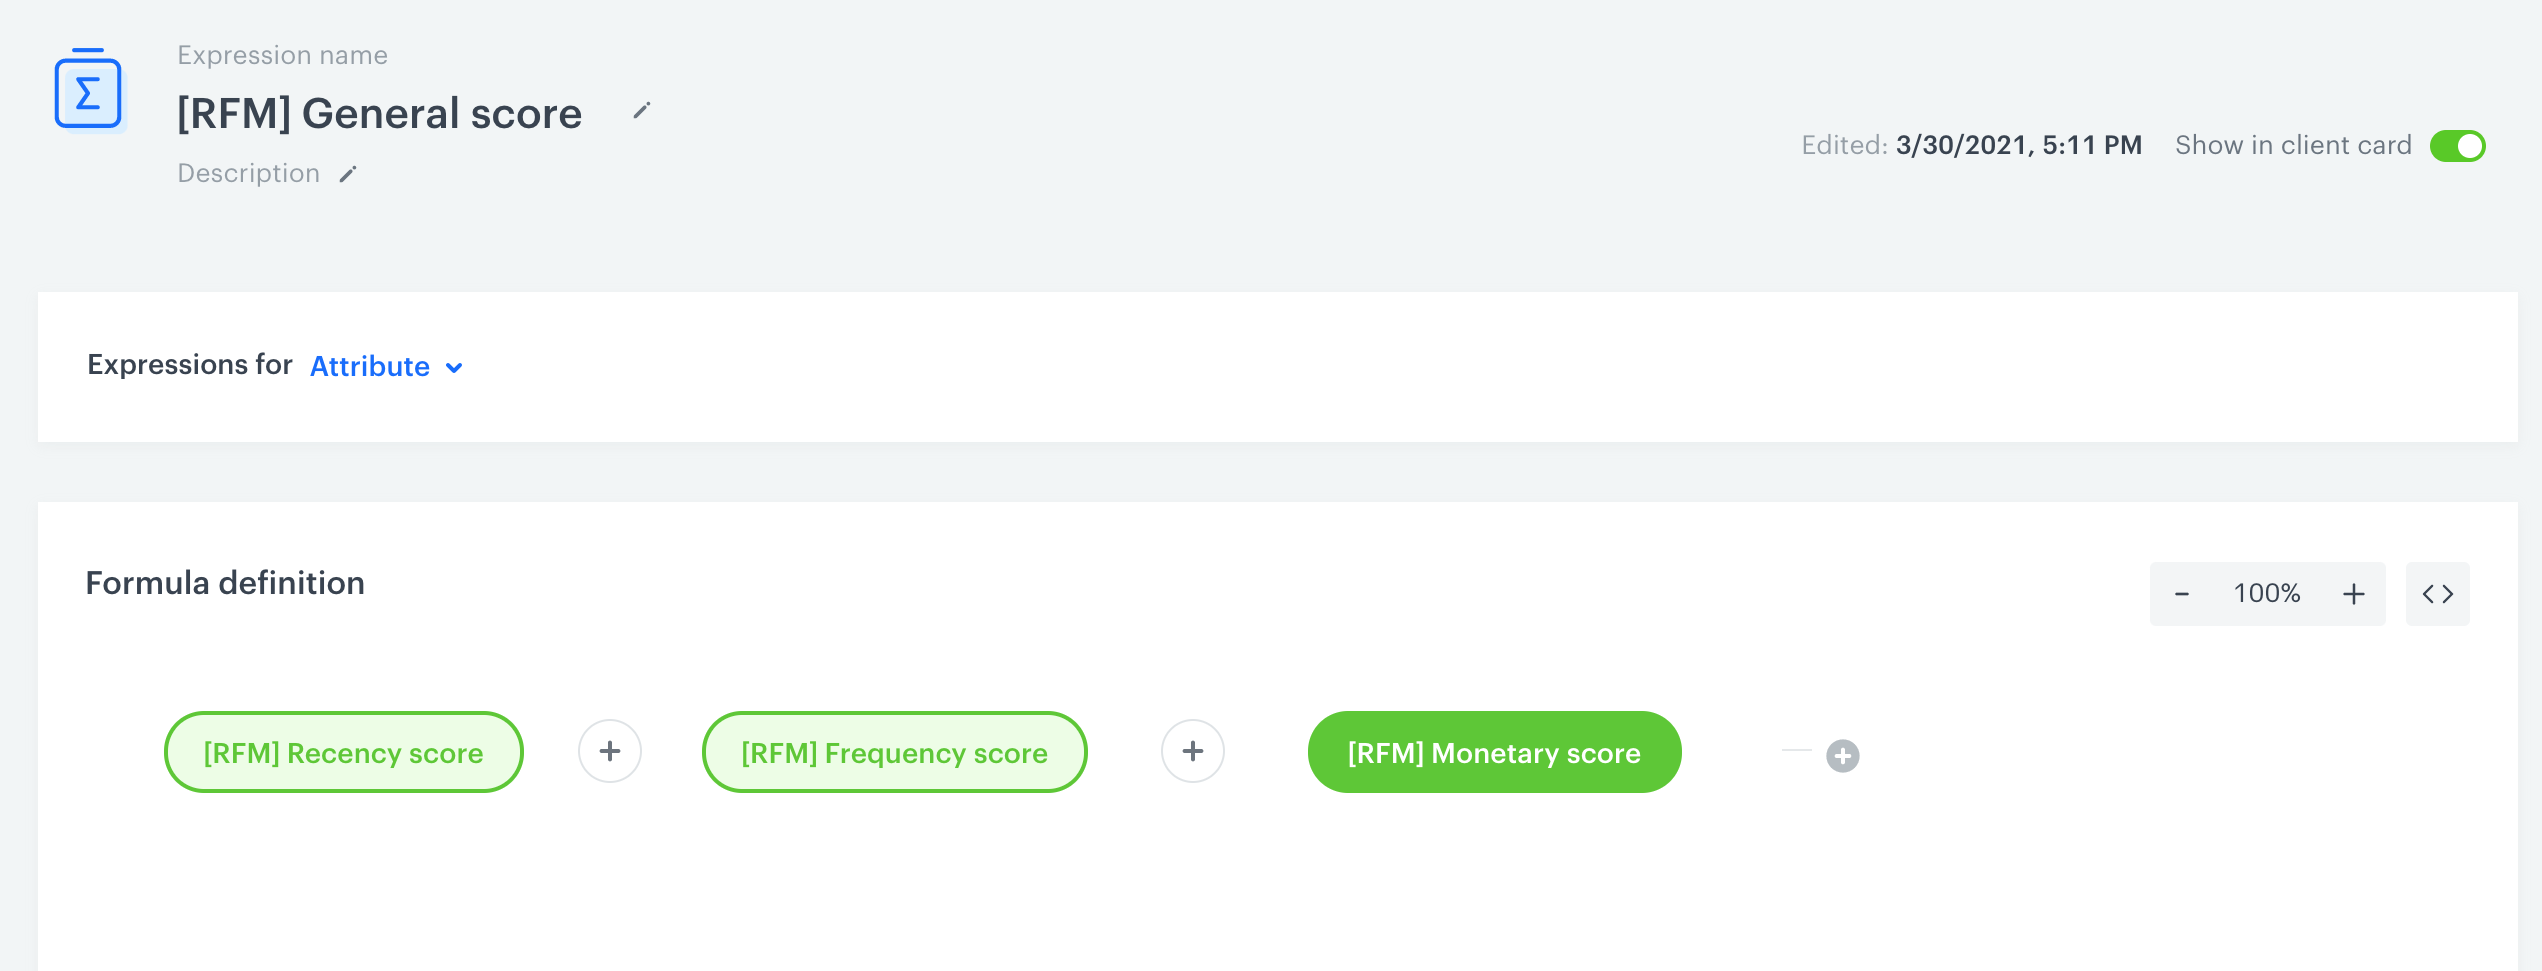
The configuration of the expression
- Save the expression.
Result: The table below contains all possible results:
| Possible results |
|---|
| 111, 112, 113, 114, 115, 121, 122, 123, 124, 125,131, 132, 133, 134, 135, 141, 142, 143, 144, 145, 151, 152, 153, 154, 155, 211, 212, 213, 214, 215, 221, 222, 223, 224, 225, 231, 232, 233, 234, 235, 241, 242, 243, 244, 245, 251, 252, 253, 254, 255, 311, 312, 313, 314, 315, 321, 322, 323, 324, 325, 331, 332, 333, 334, 335, 341, 342, 343, 344, 345, 351, 352, 353, 354, 355, 411, 412, 413, 414, 415, 421, 422, 423, 424, 425, 431, 432, 433, 434, 435, 441, 442, 443, 444, 445, 451, 452, 453, 454, 455, 511, 512, 513, 514, 515, 521, 522, 523, 524, 525, 531, 532, 533, 534, 535, 541, 542, 543, 544, 545, 551, 552, 553, 554, 555 |
You need to come up with categories of the customers and assign the results to the specific category. Example categories can be: Top customers, Recent customers, Churn risk, Heavy buyers, Lost heavy buyers, Lost customers.
Create a RFM segmentation
In the final part of the process, create a segmentation that contains segments. Each segment represents a category of customers. As the condition for each segment, use the expression created in the previous part of the process and define the scores that fall into a particular category.
-
Go to
 Decision Hub > Segmentations > New segmentation.
 -
Enter a meaningful title of the segmentation.
-
Click Add condition.
-
On the dropdown list, search and select the expression created in the previous part of the process.
-
As the logical operator, select In.
-
Enter the score that fall into a category.
-
Click the
 icon.
icon. -
Repeat steps from 3 to 7 for the rest of the categories.

The configuration of the RFM segmentation -
Save the segmentation.
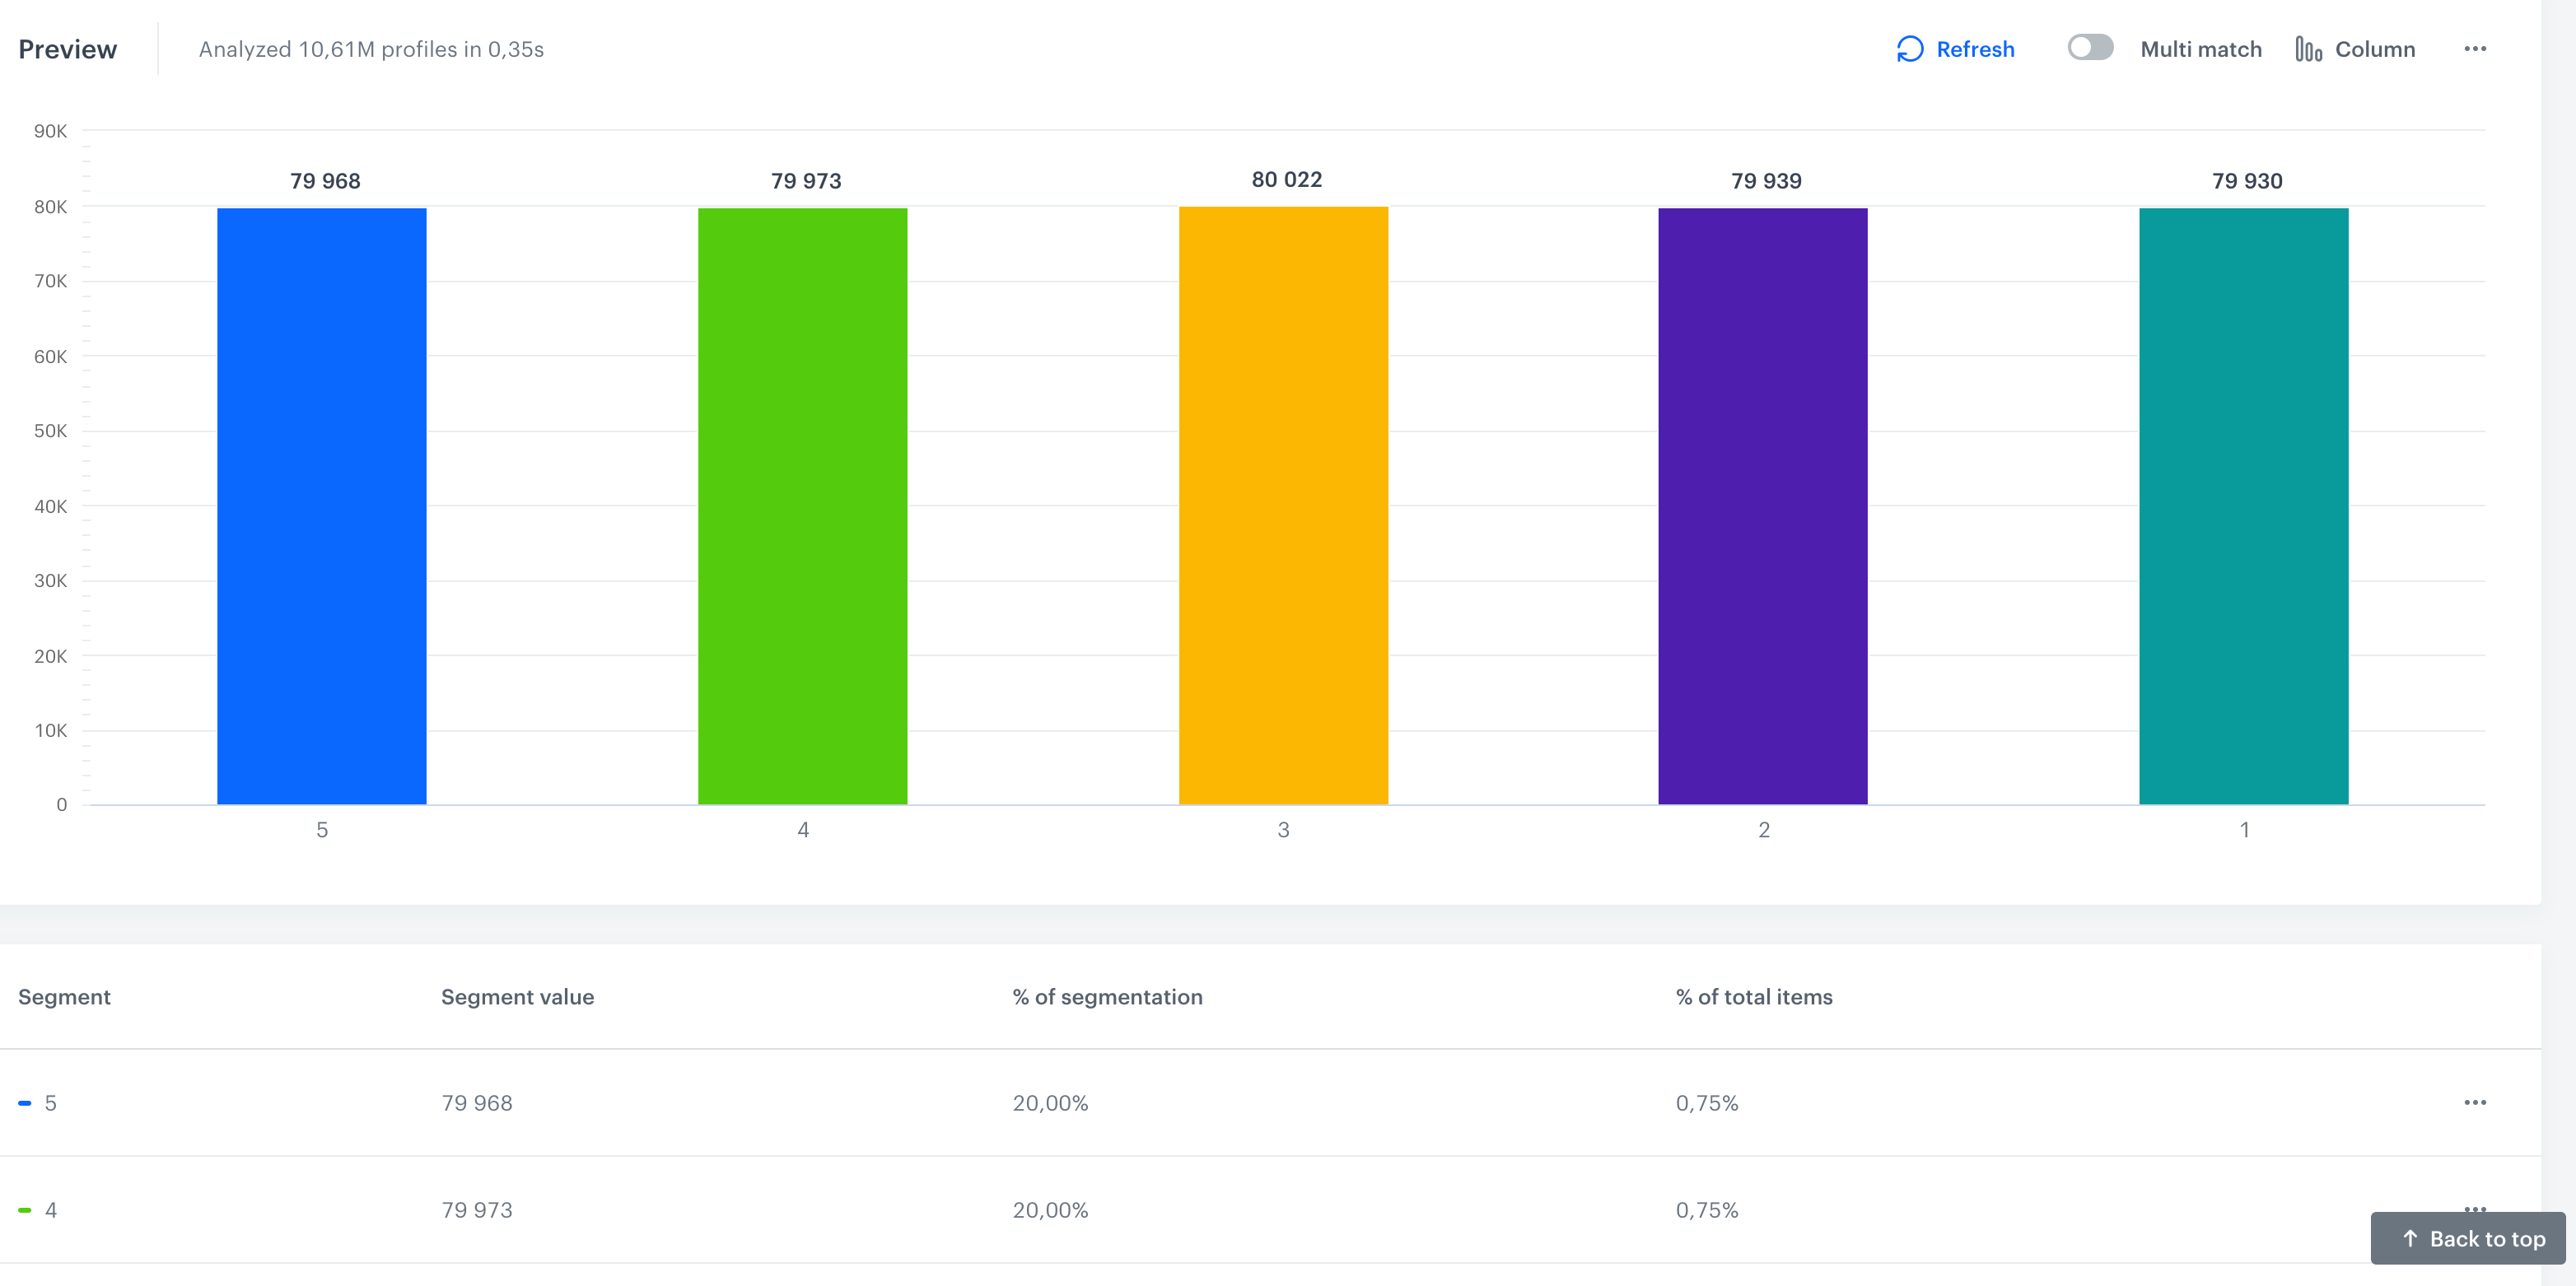
Example preview of the RFM analysis
Create a workflow
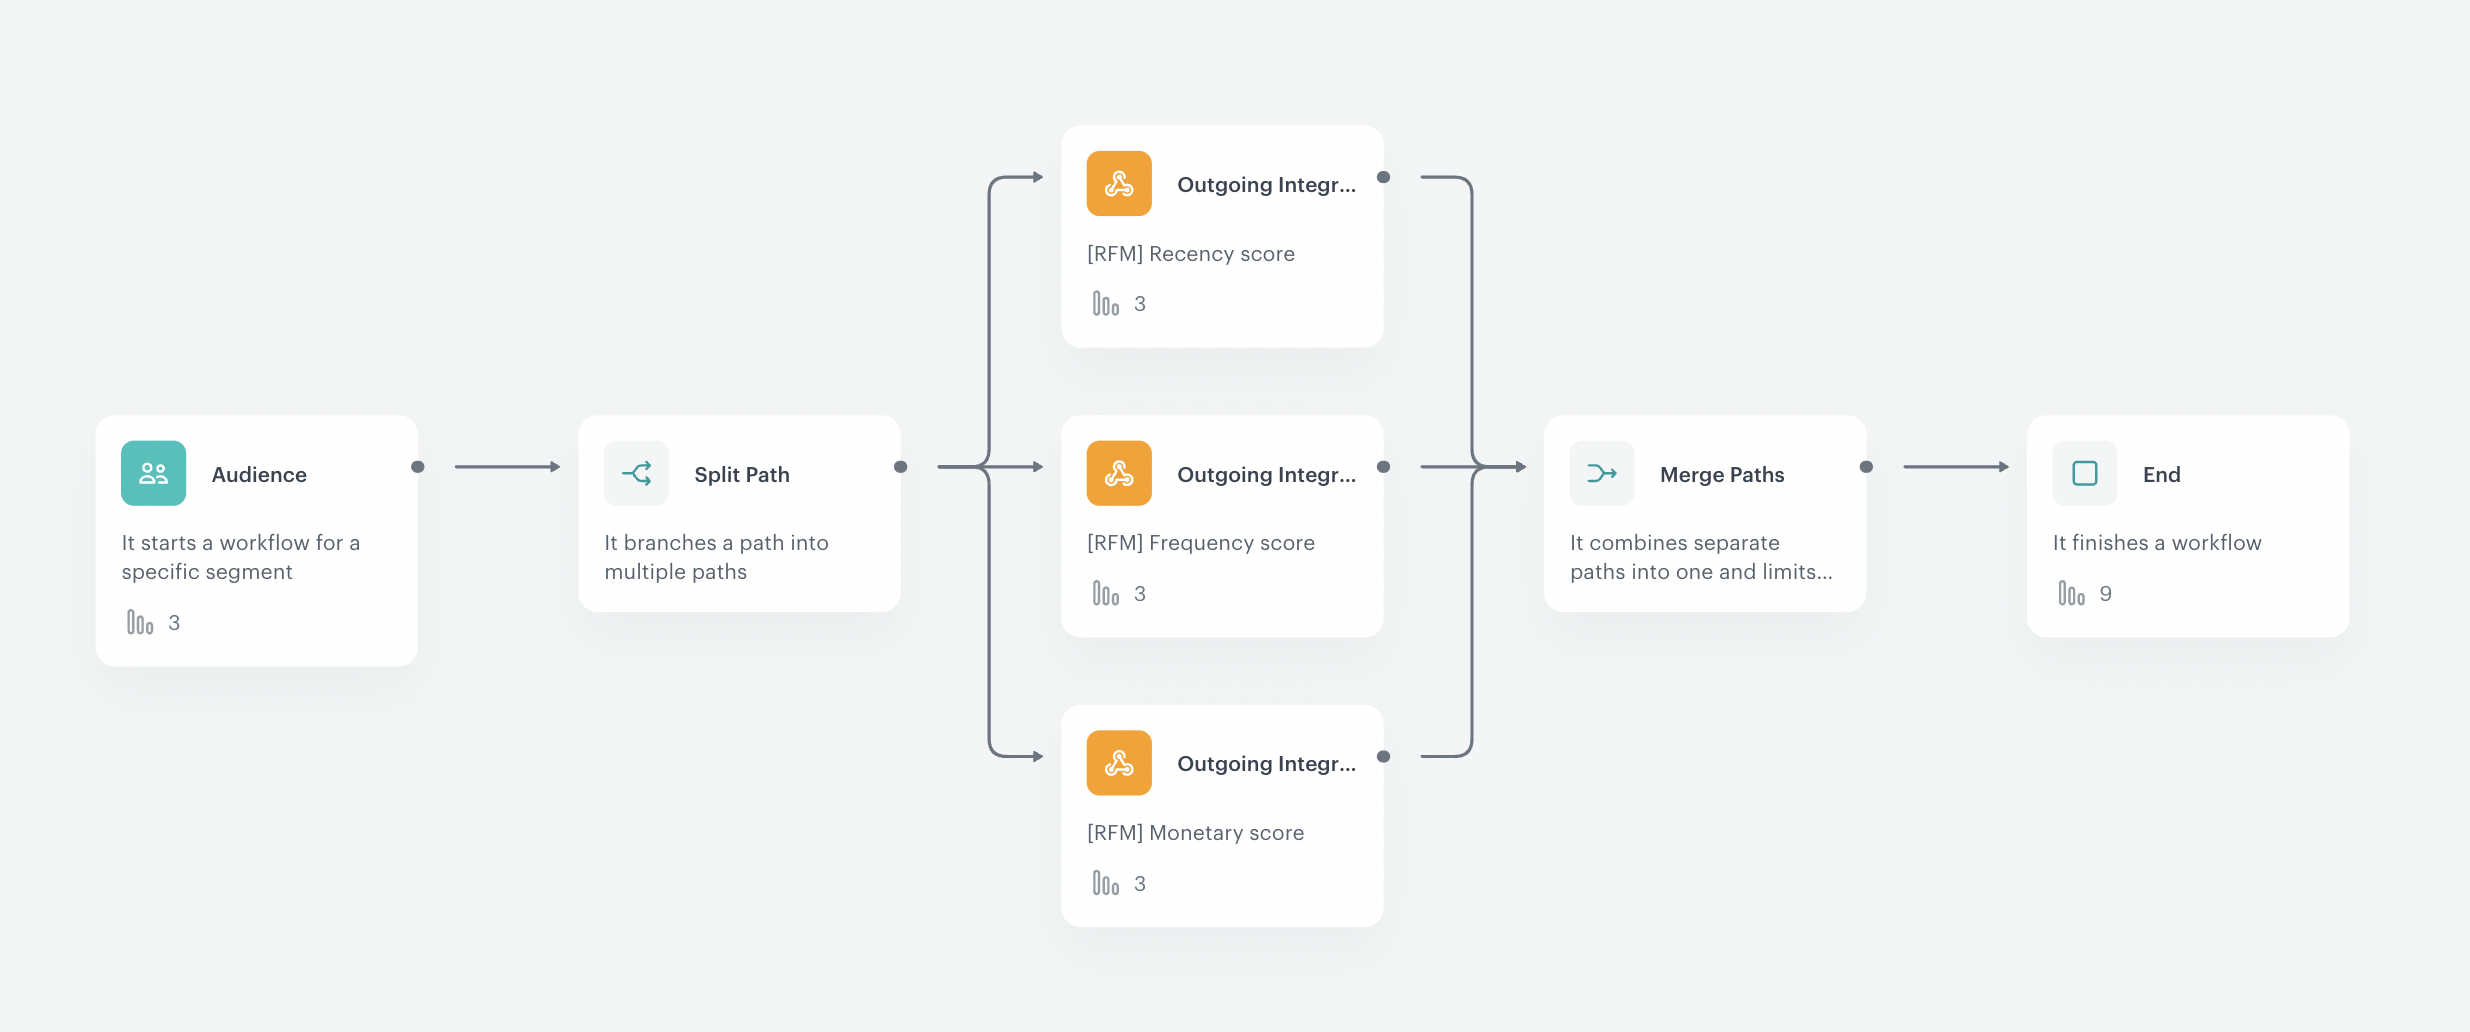
Create a workflow which automates the process of updating the values of the quantile calculation metrics used in the Recency, Frequency, and Monetary segmentations. These segmentations will be updated using webhooks, where each webhook is dedicated to updating the value of the metrics in one segmentation.
Before you start creating a workflow, create a test user that you will later use in the trigger node. All webhook responses will be sent to this profile, this way you will be able to check if the update was successful.
- Go to
 Automation Hub > Workflows > New workflow.
 - Enter the name of the workflow.
Define the Audience node
Choose the Audience node as the trigger. In this step, you will select a test user for whom the automation will be run.
- Start the workflow with the Audience node.
- In the configuration of the node, set the Run trigger option to repeatable.
- Set the interval to 1 per day.
- Choose the day and time when the process starts.
- Select the time zone.
- In Define audience, choose New Audience and click Define conditions.
- As the first condition, from Choose filter dropdown menu, choose
Email addressattribute.Note: You may have a different naming for the attribute responsible for the email address. Choose the attribute you use for this purpose. - From the Choose operator dropdown list, select Equal.
- In the right field, enter the email address of your test user.
- Click Apply.
- As the first condition, from Choose filter dropdown menu, choose
- Add the Split Path node.
Outgoing Integration
- Add the Outgoing Integration node, which will update the value of metrics used in the Recency score segmentation.
- In the configuration of the node:
- Change the webhook type to Custom.
- As the connection type, select API Key.
- Click Select connection and select a connection. If you want to create a connection, click Add connection and create it.
- Enter the title of the Outgoing Integration node.
- In the Webhook name field, enter the value of the
nameparameter of the event generated by this node. - In Webhook event name, click Create event and create a new event:
- As Name, enter
rfm.reportGenerated - As Display name, enter
RFM report generated
Tip: In this use case, you will create 3 nodes. If you want to differentiate between the events they generate, you can set different webhook names and/or event names for each of them.
- As Name, enter
- Select the PUT method.
- In the URL of the endpoint, enter the endpoint for the segmentation update:
https://api.synerise.com/analytics/analytics/v2/segmentations/f08a0f4d-4209-40cc-bfe9-4734cd9e0db9. - Replace the segmentation ID in this endpoint (
f08a0f4d-4209-40cc-bfe9-4734cd9e0db9) with the ID of the Recency score segmentation. - Enter the body of the request.
In the body, you need to add the payload of the segmentation you want to update. To get the payload perform the following steps:- Open the respective segmentation.
- Open console and go to the Network tab.
- Refresh the page.
- Search for preview in the Network.
- Right click and copy the object.
Click here to see the console view
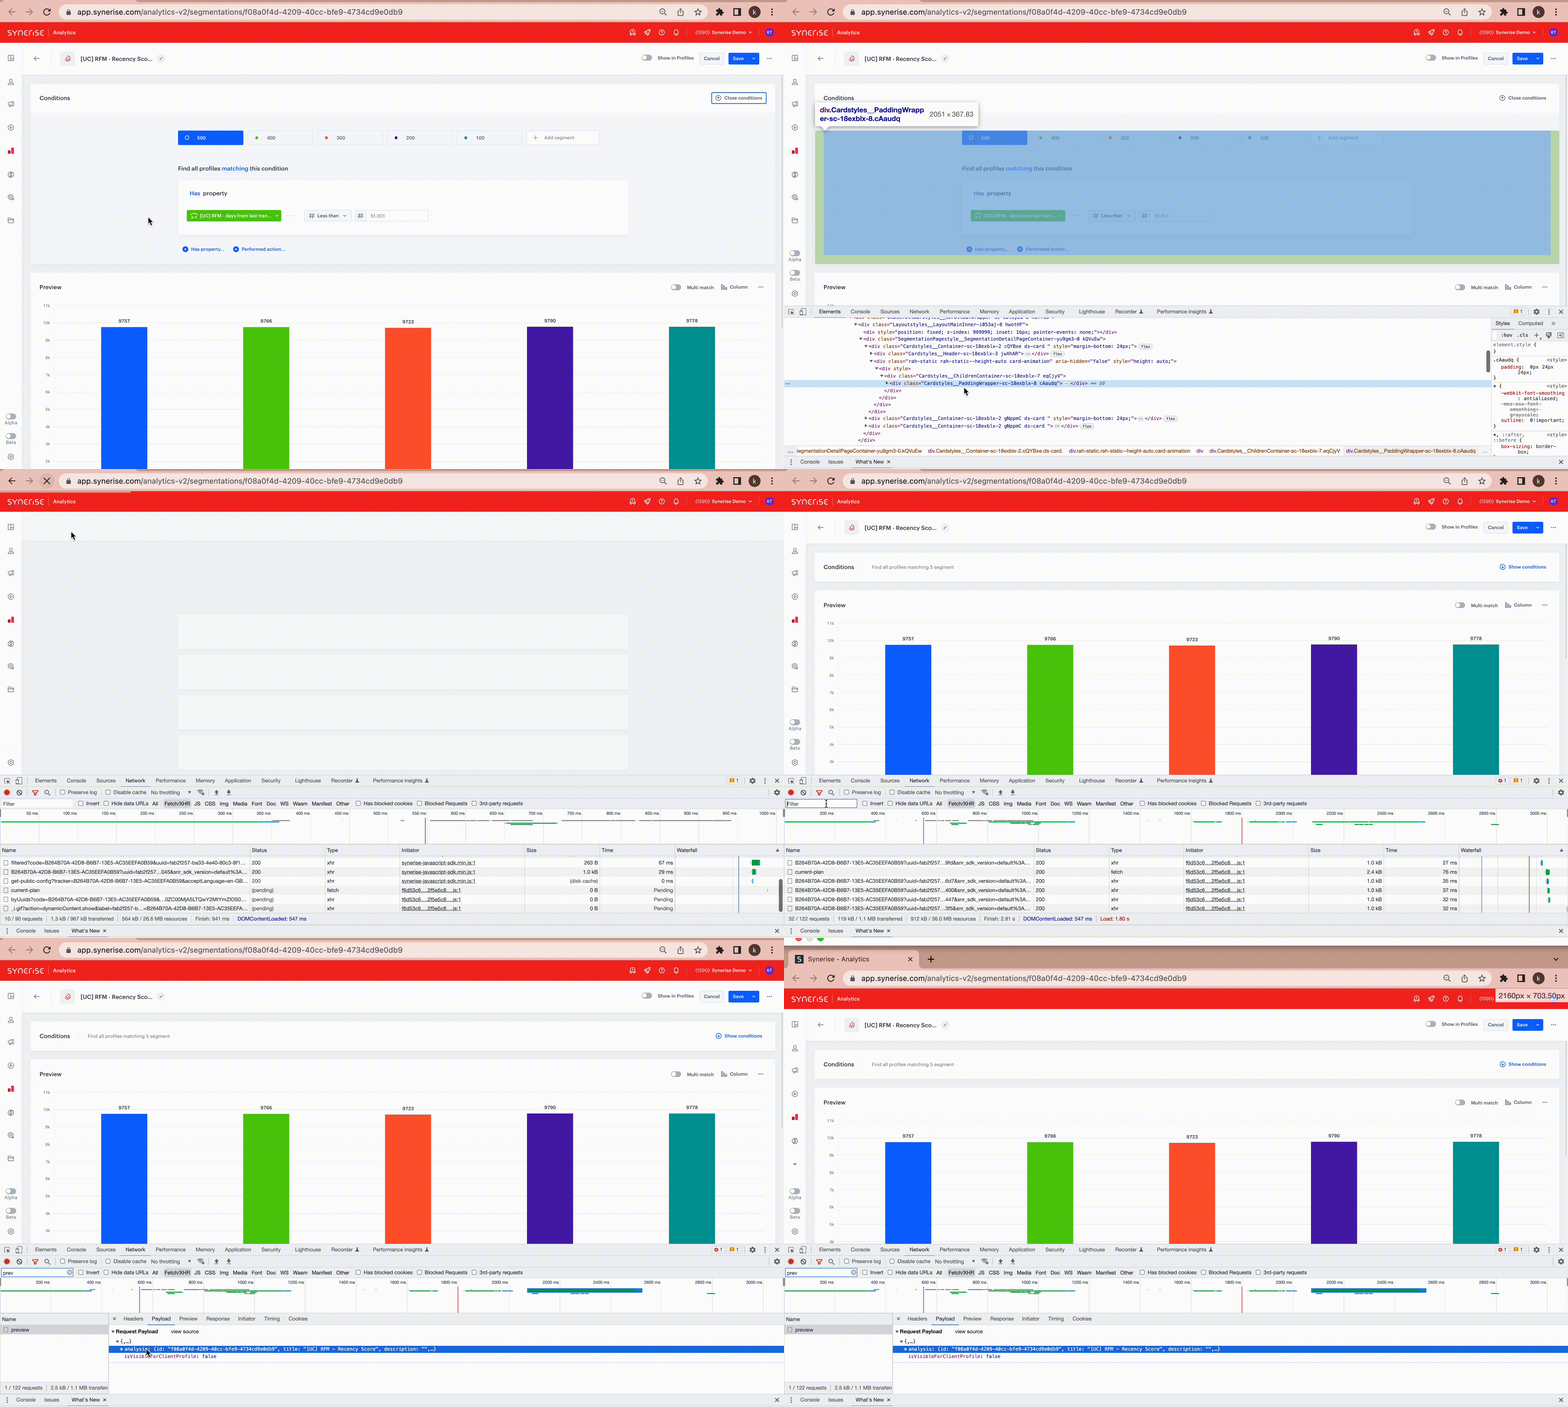
How to copy an object of segmentation - In the copied body replace all constant values with the dynamic values of relevant metrics.
Example:
You have the folowing constant: “constant”:43.3
43.3should be replaced in this case with the relevant metric ID. You can additionally round the value of the metric to three decimal places. The final appearance of the substituted constant will look as follows:
"constant": {% metricsvar metric_id:97488c6a-746e-42fc-a1ca-b2fb4b8dfa94%}{{ metric_result|round(3,'floor') }} {% endmetricsvar %}Click here to see the example of body request for the Recency segment{ "analysis": { "title": "[UC] RFM - Recency Score", "description": "", "segments": [ { "title": "500", "description": "", "filter": { "matching": true, "expressions": [ { "name": "", "type": "ATTRIBUTE", "matching": true, "attribute": { "expressions": [ { "constraint": { "type": "NUMBER_ONE", "logic": "LESS", "value": { "type": "CONSTANT", "constant": {% metricsvar metric_id:97488c6a-746e-42fc-a1ca-b2fb4b8dfa94%}{{ metric_result|round(3,'floor') }} {% endmetricsvar %} } }, "attribute": { "type": "EXPRESSION", "id": "73d13360-2074-463c-9978-79861889dff0" } } ] } } ], "expression": { "name": "", "type": "ATTRIBUTE", "matching": true, "attribute": { "expressions": [ { "constraint": { "type": "NUMBER_ONE", "logic": "LESS", "value": { "type": "CONSTANT", "constant": {% metricsvar metric_id:97488c6a-746e-42fc-a1ca-b2fb4b8dfa94%}{{ metric_result|round(3,'floor') }} {% endmetricsvar %} } }, "attribute": { "type": "EXPRESSION", "id": "73d13360-2074-463c-9978-79861889dff0" } } ] } } }, "profileMetrics": [] }, { "title": "400", "description": "", "filter": { "matching": true, "expressions": [ { "name": "", "type": "ATTRIBUTE", "matching": true, "attribute": { "expressions": [ { "constraint": { "type": "NUMBER_ONE", "logic": "MORE_OR_EQUAL", "value": { "type": "CONSTANT", "constant": {% metricsvar metric_id:97488c6a-746e-42fc-a1ca-b2fb4b8dfa94%}{{ metric_result|round(3,'floor') }} {% endmetricsvar %} } }, "attribute": { "type": "EXPRESSION", "id": "73d13360-2074-463c-9978-79861889dff0" } } ] } }, { "type": "OPERATOR", "logic": "AND" }, { "name": "", "type": "ATTRIBUTE", "matching": true, "attribute": { "expressions": [ { "constraint": { "type": "NUMBER_ONE", "logic": "LESS", "value": { "type": "CONSTANT", "constant": {% metricsvar metric_id:e571679c-0f04-466f-aa43-ff6d5023bb09%}{{ metric_result|round(3,'floor') }} {% endmetricsvar %} } }, "attribute": { "type": "EXPRESSION", "id": "73d13360-2074-463c-9978-79861889dff0" } } ] } } ], "expression": { "type": "FUNCTION", "function": "AND", "arg1": { "name": "", "type": "ATTRIBUTE", "matching": true, "attribute": { "expressions": [ { "constraint": { "type": "NUMBER_ONE", "logic": "LESS", "value": { "type": "CONSTANT", "constant": {% metricsvar metric_id:e571679c-0f04-466f-aa43-ff6d5023bb09%}{{ metric_result|round(3,'floor') }} {% endmetricsvar %} } }, "attribute": { "type": "EXPRESSION", "id": "73d13360-2074-463c-9978-79861889dff0" } } ] } }, "arg2": { "name": "", "type": "ATTRIBUTE", "matching": true, "attribute": { "expressions": [ { "constraint": { "type": "NUMBER_ONE", "logic": "MORE_OR_EQUAL", "value": { "type": "CONSTANT", "constant": {% metricsvar metric_id:97488c6a-746e-42fc-a1ca-b2fb4b8dfa94%}{{ metric_result|round(3,'floor') }} {% endmetricsvar %} } }, "attribute": { "type": "EXPRESSION", "id": "73d13360-2074-463c-9978-79861889dff0" } } ] } } } }, "profileMetrics": [] }, { "title": "300", "description": "", "filter": { "matching": true, "expressions": [ { "name": "", "type": "ATTRIBUTE", "matching": true, "attribute": { "expressions": [ { "constraint": { "type": "NUMBER_ONE", "logic": "MORE_OR_EQUAL", "value": { "type": "CONSTANT", "constant": {% metricsvar metric_id:e571679c-0f04-466f-aa43-ff6d5023bb09%}{{ metric_result|round(3,'floor') }} {% endmetricsvar %} } }, "attribute": { "type": "EXPRESSION", "id": "73d13360-2074-463c-9978-79861889dff0" } } ] } }, { "type": "OPERATOR", "logic": "AND" }, { "name": "", "type": "ATTRIBUTE", "matching": true, "attribute": { "expressions": [ { "constraint": { "type": "NUMBER_ONE", "logic": "LESS", "value": { "type": "CONSTANT", "constant": {% metricsvar metric_id:8031ccf4-2444-42bf-8eba-ba61d952d52f%}{{ metric_result|round(3,'floor') }} {% endmetricsvar %} } }, "attribute": { "type": "EXPRESSION", "id": "73d13360-2074-463c-9978-79861889dff0" } } ] } } ], "expression": { "type": "FUNCTION", "function": "AND", "arg1": { "name": "", "type": "ATTRIBUTE", "matching": true, "attribute": { "expressions": [ { "constraint": { "type": "NUMBER_ONE", "logic": "LESS", "value": { "type": "CONSTANT", "constant": {% metricsvar metric_id:8031ccf4-2444-42bf-8eba-ba61d952d52f%}{{ metric_result|round(3,'floor') }} {% endmetricsvar %} } }, "attribute": { "type": "EXPRESSION", "id": "73d13360-2074-463c-9978-79861889dff0" } } ] } }, "arg2": { "name": "", "type": "ATTRIBUTE", "matching": true, "attribute": { "expressions": [ { "constraint": { "type": "NUMBER_ONE", "logic": "MORE_OR_EQUAL", "value": { "type": "CONSTANT", "constant": {% metricsvar metric_id:e571679c-0f04-466f-aa43-ff6d5023bb09%}{{ metric_result|round(3,'floor') }} {% endmetricsvar %} } }, "attribute": { "type": "EXPRESSION", "id": "73d13360-2074-463c-9978-79861889dff0" } } ] } } } }, "profileMetrics": [] }, { "title": "200", "description": "", "filter": { "matching": true, "expressions": [ { "name": "", "type": "ATTRIBUTE", "matching": true, "attribute": { "expressions": [ { "constraint": { "type": "NUMBER_ONE", "logic": "MORE_OR_EQUAL", "value": { "type": "CONSTANT", "constant": {% metricsvar metric_id:8031ccf4-2444-42bf-8eba-ba61d952d52f%}{{ metric_result|round(3,'floor') }} {% endmetricsvar %} } }, "attribute": { "type": "EXPRESSION", "id": "73d13360-2074-463c-9978-79861889dff0" } } ] } }, { "type": "OPERATOR", "logic": "AND" }, { "name": "", "type": "ATTRIBUTE", "matching": true, "attribute": { "expressions": [ { "constraint": { "type": "NUMBER_ONE", "logic": "LESS", "value": { "type": "CONSTANT", "constant": {% metricsvar metric_id:fb1c9bff-ce29-42c0-93ee-b56f092ae03f%}{{ metric_result|round(3,'floor') }} {% endmetricsvar %} } }, "attribute": { "type": "EXPRESSION", "id": "73d13360-2074-463c-9978-79861889dff0" } } ] } } ], "expression": { "type": "FUNCTION", "function": "AND", "arg1": { "name": "", "type": "ATTRIBUTE", "matching": true, "attribute": { "expressions": [ { "constraint": { "type": "NUMBER_ONE", "logic": "LESS", "value": { "type": "CONSTANT", "constant": {% metricsvar metric_id:fb1c9bff-ce29-42c0-93ee-b56f092ae03f%}{{ metric_result|round(3,'floor') }} {% endmetricsvar %} } }, "attribute": { "type": "EXPRESSION", "id": "73d13360-2074-463c-9978-79861889dff0" } } ] } }, "arg2": { "name": "", "type": "ATTRIBUTE", "matching": true, "attribute": { "expressions": [ { "constraint": { "type": "NUMBER_ONE", "logic": "MORE_OR_EQUAL", "value": { "type": "CONSTANT", "constant": {% metricsvar metric_id:8031ccf4-2444-42bf-8eba-ba61d952d52f%}{{ metric_result|round(3,'floor') }} {% endmetricsvar %} } }, "attribute": { "type": "EXPRESSION", "id": "73d13360-2074-463c-9978-79861889dff0" } } ] } } } }, "profileMetrics": [] }, { "title": "100", "description": "", "filter": { "matching": true, "expressions": [ { "name": "", "type": "ATTRIBUTE", "matching": true, "attribute": { "expressions": [ { "constraint": { "type": "NUMBER_ONE", "logic": "MORE_OR_EQUAL", "value": { "type": "CONSTANT", "constant": {% metricsvar metric_id:fb1c9bff-ce29-42c0-93ee-b56f092ae03f%}{{ metric_result|round(3,'floor') }} {% endmetricsvar %} } }, "attribute": { "type": "EXPRESSION", "id": "73d13360-2074-463c-9978-79861889dff0" } } ] } }, { "type": "OPERATOR", "logic": "AND" }, { "name": "", "type": "FUNNEL", "matching": true, "funnel": { "title": "unnamed", "completedWithin": {}, "dateFilter": { "type": "ABSOLUTE" }, "steps": [ { "action": { "id": 68600, "name": "transaction.charge" }, "title": "Unnamed Step", "expressions": [], "eventName": "transaction.charge" } ], "exact": false } } ], "expression": { "type": "FUNCTION", "function": "AND", "arg1": { "name": "", "type": "FUNNEL", "matching": true, "funnel": { "title": "unnamed", "completedWithin": null, "dateFilter": { "type": "ABSOLUTE" }, "steps": [ { "action": { "id": 68600, "name": "transaction.charge" }, "title": "Unnamed Step", "expressions": [], "eventName": "transaction.charge" } ], "exact": false } }, "arg2": { "name": "", "type": "ATTRIBUTE", "matching": true, "attribute": { "expressions": [ { "constraint": { "type": "NUMBER_ONE", "logic": "MORE_OR_EQUAL", "value": { "type": "CONSTANT", "constant": {% metricsvar metric_id:fb1c9bff-ce29-42c0-93ee-b56f092ae03f%}{{ metric_result|round(3,'floor') }} {% endmetricsvar %} } }, "attribute": { "type": "EXPRESSION", "id": "73d13360-2074-463c-9978-79861889dff0" } } ] } } } }, "profileMetrics": [] } ], "unique": true }, "allowNull": true }Note: This is just an example of the body we are using in this use case, and it contains all the metrics IDs that were created in the previous steps. If your analytics settings differ from the configuration shown in this use case, you will have a different body that matches your custom settings.
- Click Apply.
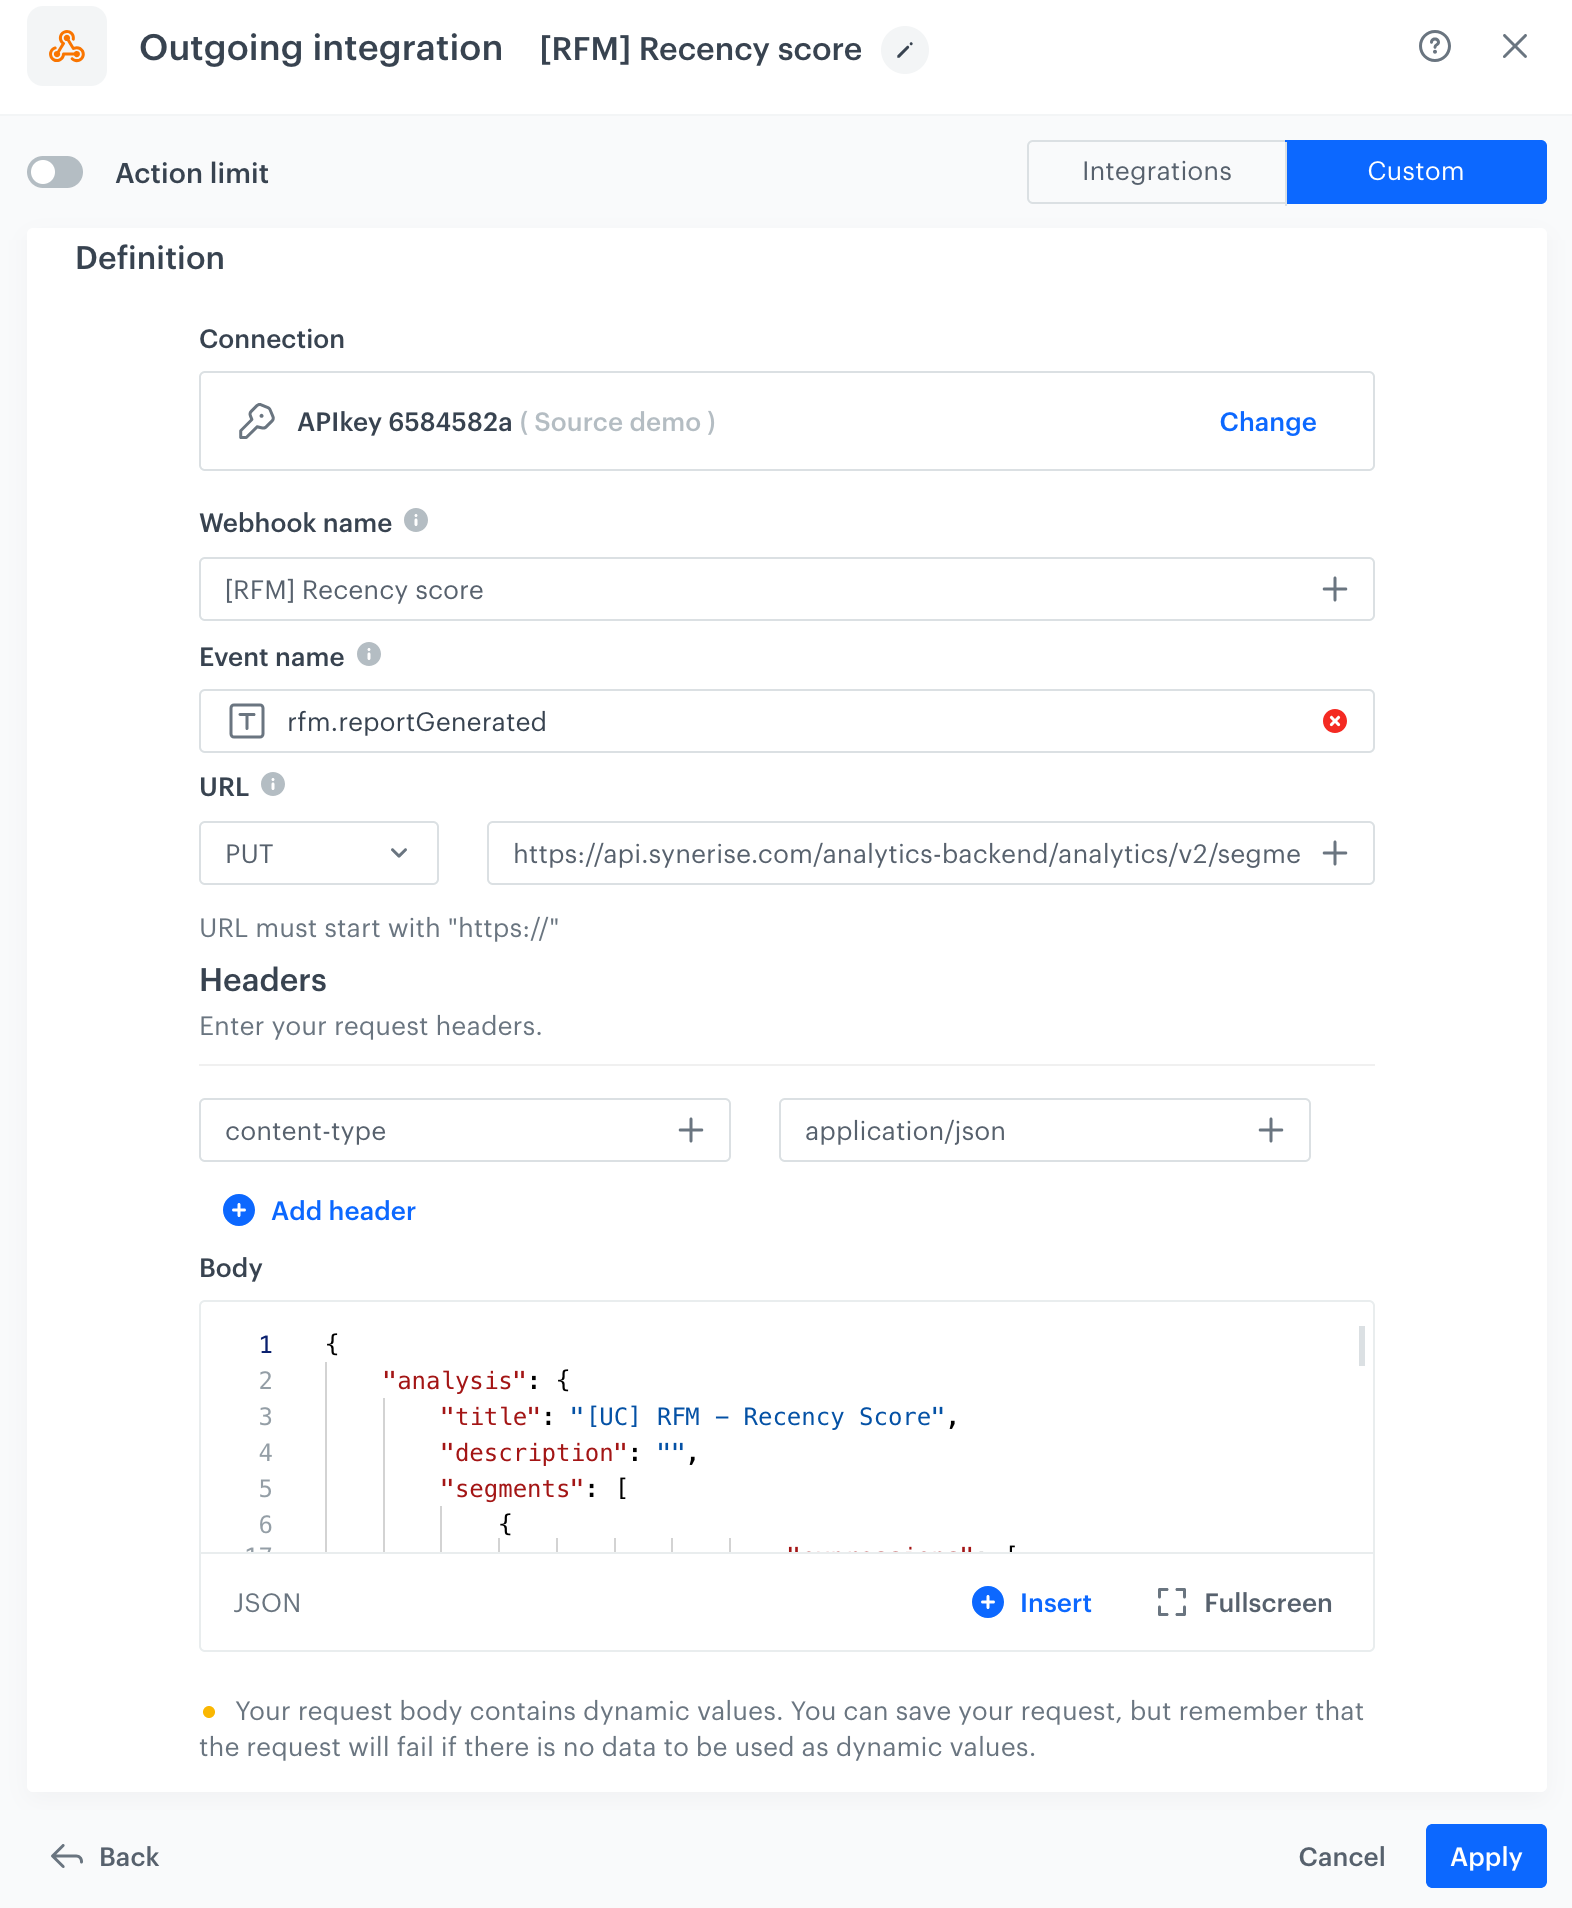
Configure two Outgoing Integration nodes for the remaining Frequency and Monetary segments. Follow the steps described for the configuration of the Outgoing Integration node for the Recency score segmantation, but make sure to adjust the configuration for each specific segment.
Add the Merge Paths node and the End node.
The workflow continuously updates the metrics in the segmentations at a set frequency, ensuring that all segmentations remain up-to-date.
Create a dashboard
In this part of the process, to conveniently preview the results of all metrics you created in the previous part of the process, create a dashboard.
- Go to
 Decision Hub > Dashboard > New dashboard.
 - Enter a meaningful name of the dashboard.
- Add all metrics you created earlier in the process.
Tip: You can learn more about creating dashboards here. - Save the dashboard.
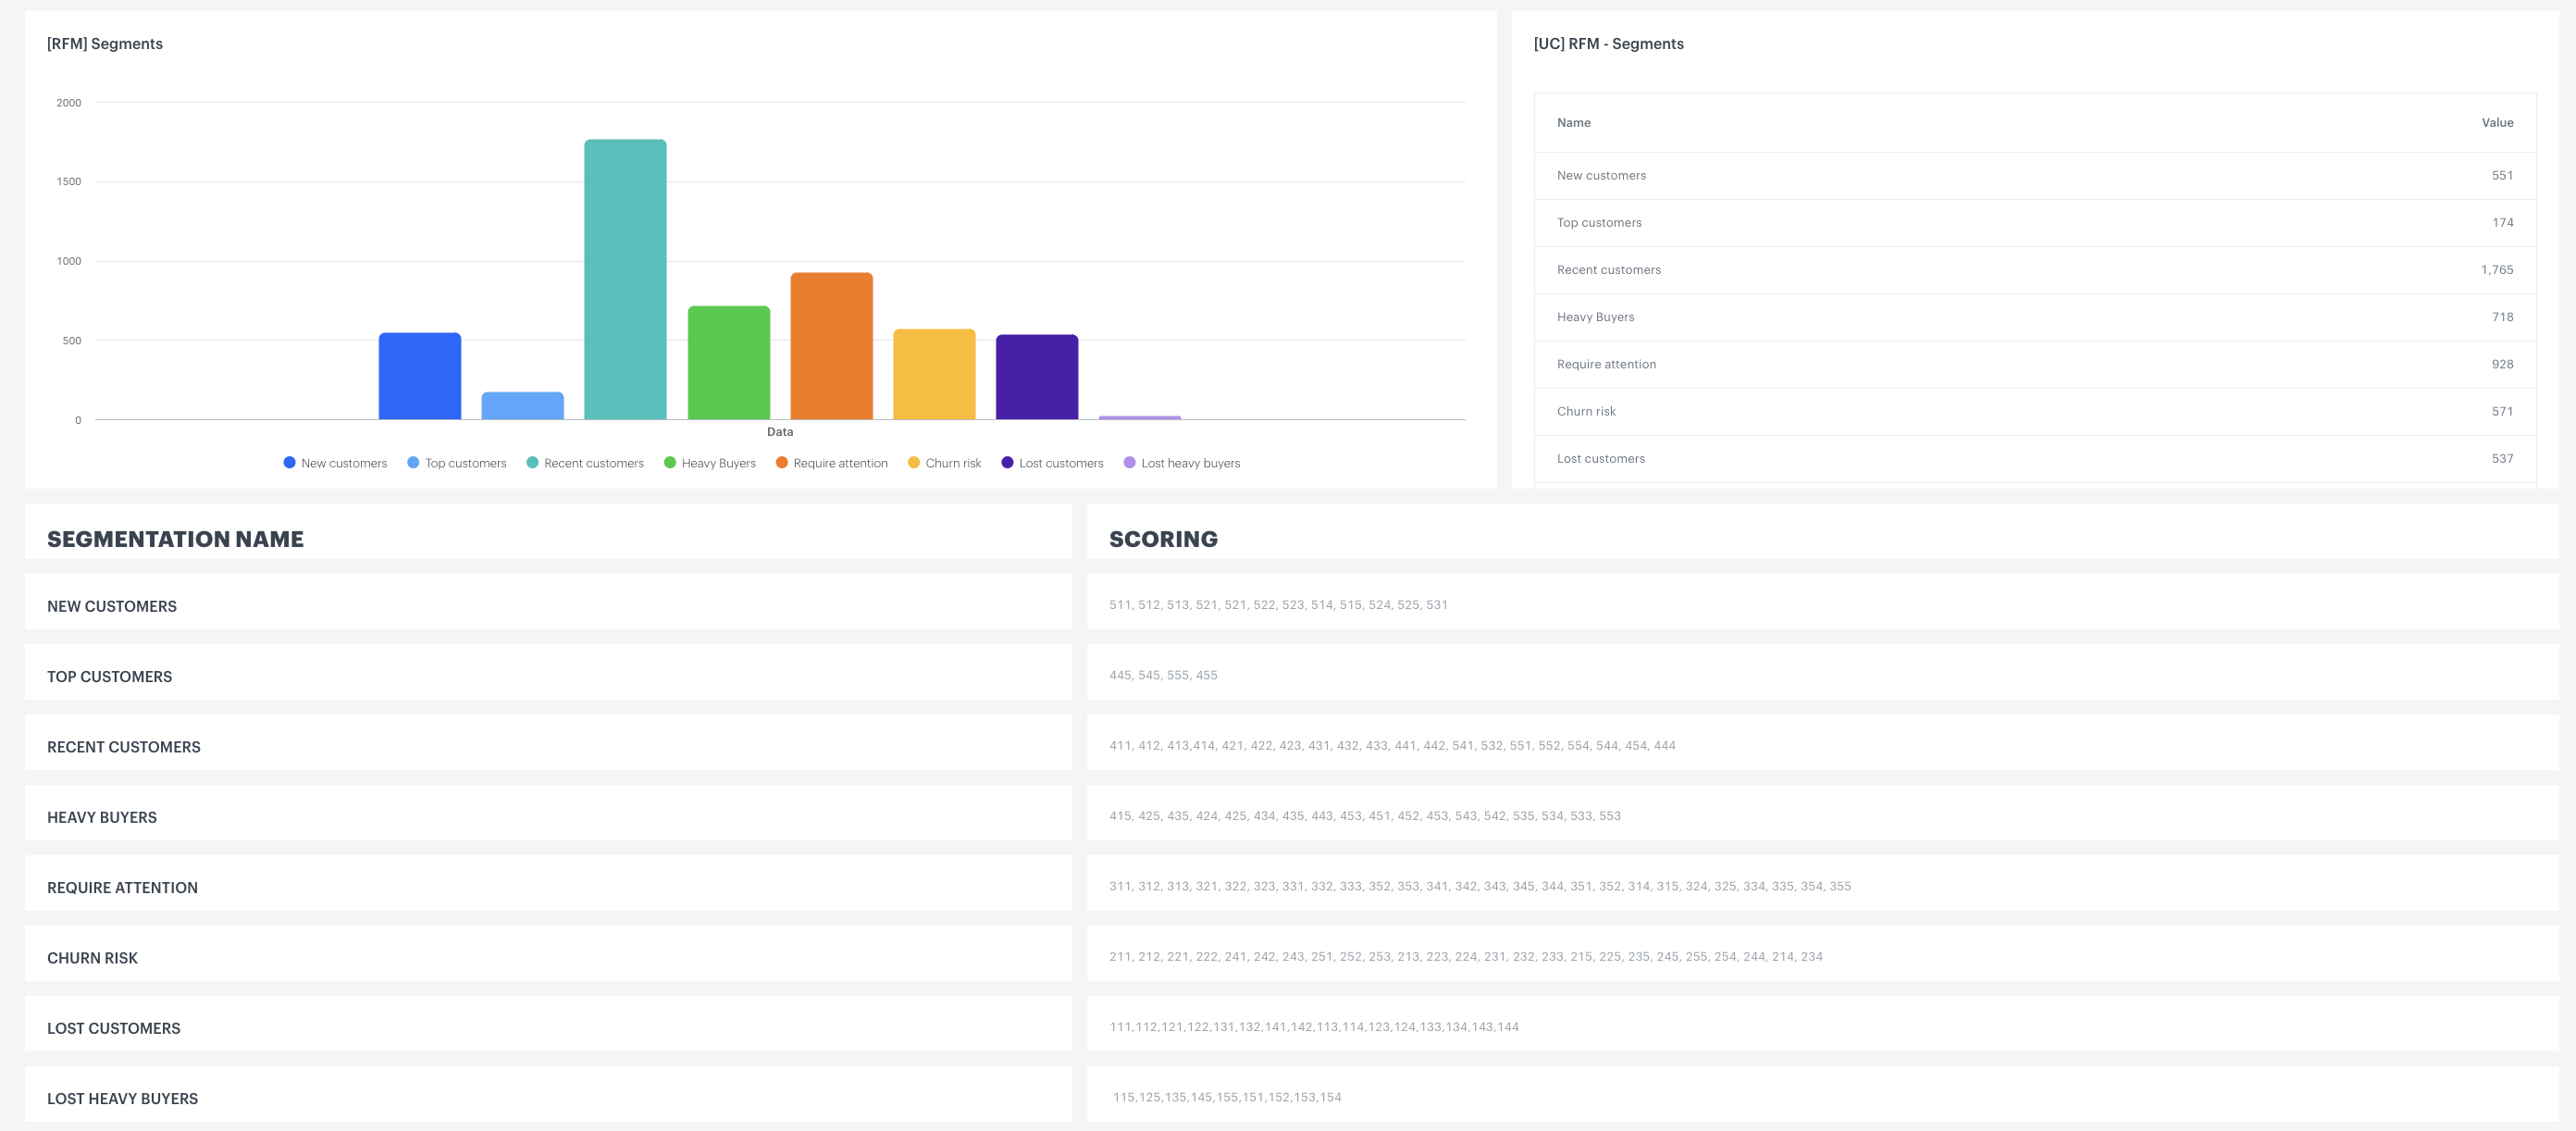
The example dashboard
Check the use case set up on the Synerise demo workspace
Check the analytics from our use case in Synerise demo workspace:
- Aggregate which counts transactions,
- Aggregate counts first transactions,
- Aggregate counts last transactions,
- Aggregate presented monetary value,
- Expression counts days from last transaction,
- Expression that calculates how much time passed since the first transaction,
- Expression that calculates the number of weeks since the first transaction of a customer,
- Expression that calculates the average number of transactions a customer made per week.
See the metrics which will calculate the qunatiles for the values of the expressions and an aggregate"
- Metric 1,Metric 2,Metric 3,Metric 4, counting the number of days that passed since last transaction (Recency),
- Metric 1,Metric 2,Metric 3,Metric 4, counting the average number of transactions in a week (Frequency)
- Metric 1,Metric 2,Metric 3,Metric 4, counting total value of transactions in last 90 days (Monetary).
Check the dashboard presenting RFM summary.
Check three segments, created in this case:
Check the RFM general score and RFM segmentation.
Check the workflow.
If you’re our partner or client, you already have automatic access to the Synerise Demo workspace (1590), where you can explore all the configured elements of this use case and copy them to your workspace.
If you’re not a partner or client yet, we encourage you to fill out the contact form to schedule a meeting with our representatives. They’ll be happy to show you how our demo works and discuss how you can apply this use case in your business.

