Interest-Based Segmentation Using URL Fragments from Page Visits
Having more product categories in your store, you can easily measure which category a customer visits most frequently.
Based on the URL of the visited page, you can find a lot of information. In this use case, we treat visits to specific URL as visits to specific categories (for example, if the URL contains “/shoes/”, we assume that the customer has visited the “Shoes” category).
Using the Decision Hub, we can define how many times a customer visited specific categories and then extract the one most frequently visited by them. Additionally, you can create a segmentation by grouping these customers by favorite category. In this use case, we will show you how to create such a segmentation on the example of 4 selected categories using aggregates and expressions that use the URL fragment in the page visit event.
Prerequisites
Implement tracking code on your website.
page.visit event with the exact path of the category visited by the customer. Based on that, you can simplify the presented analyses and reduce them to one aggregate with the “TOP” aggregator and segmentation (there would be no need to create an expression and aggregates for each category).Process
This procedure consists of three stages:
- Create aggregates that count visits on each of four product categories.
- Create an expression that returns the highest result for every category.
- Create a segmentation that groups customers by the most frequently visited category.
Create aggregates
Create aggregates that count visits on each of product categories. In this stage, we assume that visiting a given fragment of the URL equals visiting a category. To measure the results, create 4 aggregates that count the number of visits to each of the four categories.
- Go to
 Behavioral Data Hub > Aggregates > Create aggregate.
 - As the aggregate type, select Profile.
- Enter the name of the aggregate (in this example, the name of the aggregate will be the same as the category name).
- By clicking the
 button, set Count as the type of the aggregate result.
 - From the Choose event dropdown list, select the
page.visitevent. - Click the Where button and from the Choose parameter dropdown list, select
uri. - Select the Contain logical operator.
- In the text field, next to the logical operator, enter the name of the product category.
- Save the aggregate.
- Create another one or more aggregates for their respective categories. Repeat the steps 1-8.
Result: The aggregates will count visits of individual users to the product category. The aggregates are available in Behavioral Data Hub > Aggregates.

Create an expression
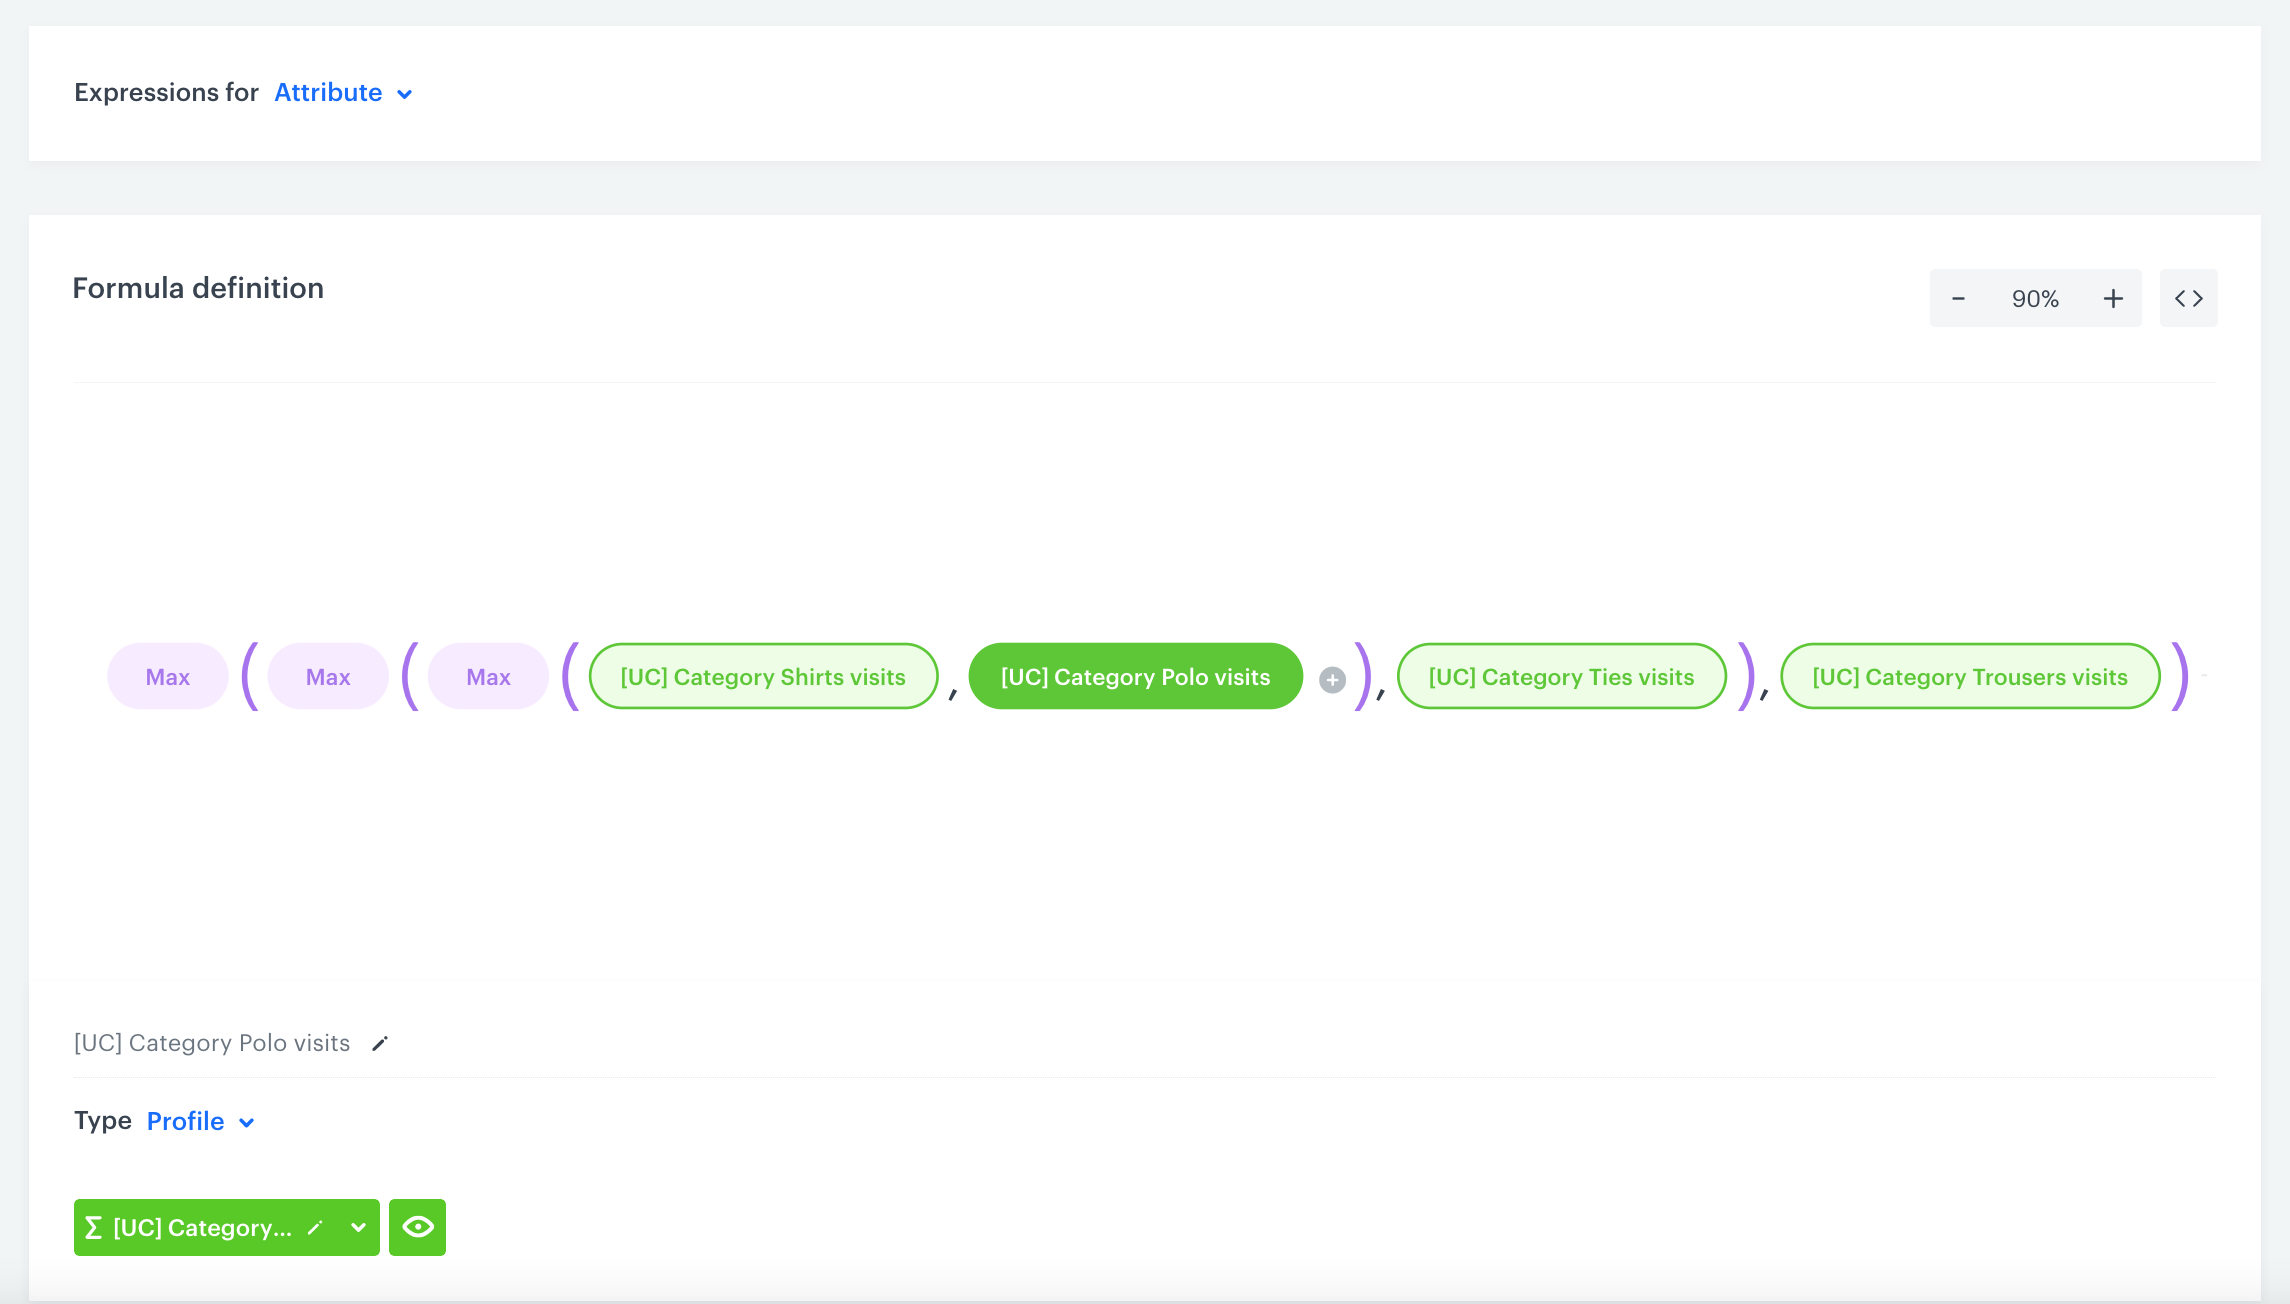
In this step, create an expression that will use the max function. This function returns the highest value in a set of values. Use it in order to return the result of the category most frequently visited by the user. It will be used later in building the segmentation.
- Go to
 Behavioral Data Hub > Expressions > New expression.
 - Enter the name of the expression.
- From the dropdown list, select Attribute.
- To start creating the formula of the expression, click the Select button.
- Create the formula as presented on the video below:
- Save the expression by clicking Save. The expression returns the highest values for every category.

Create a segmentation
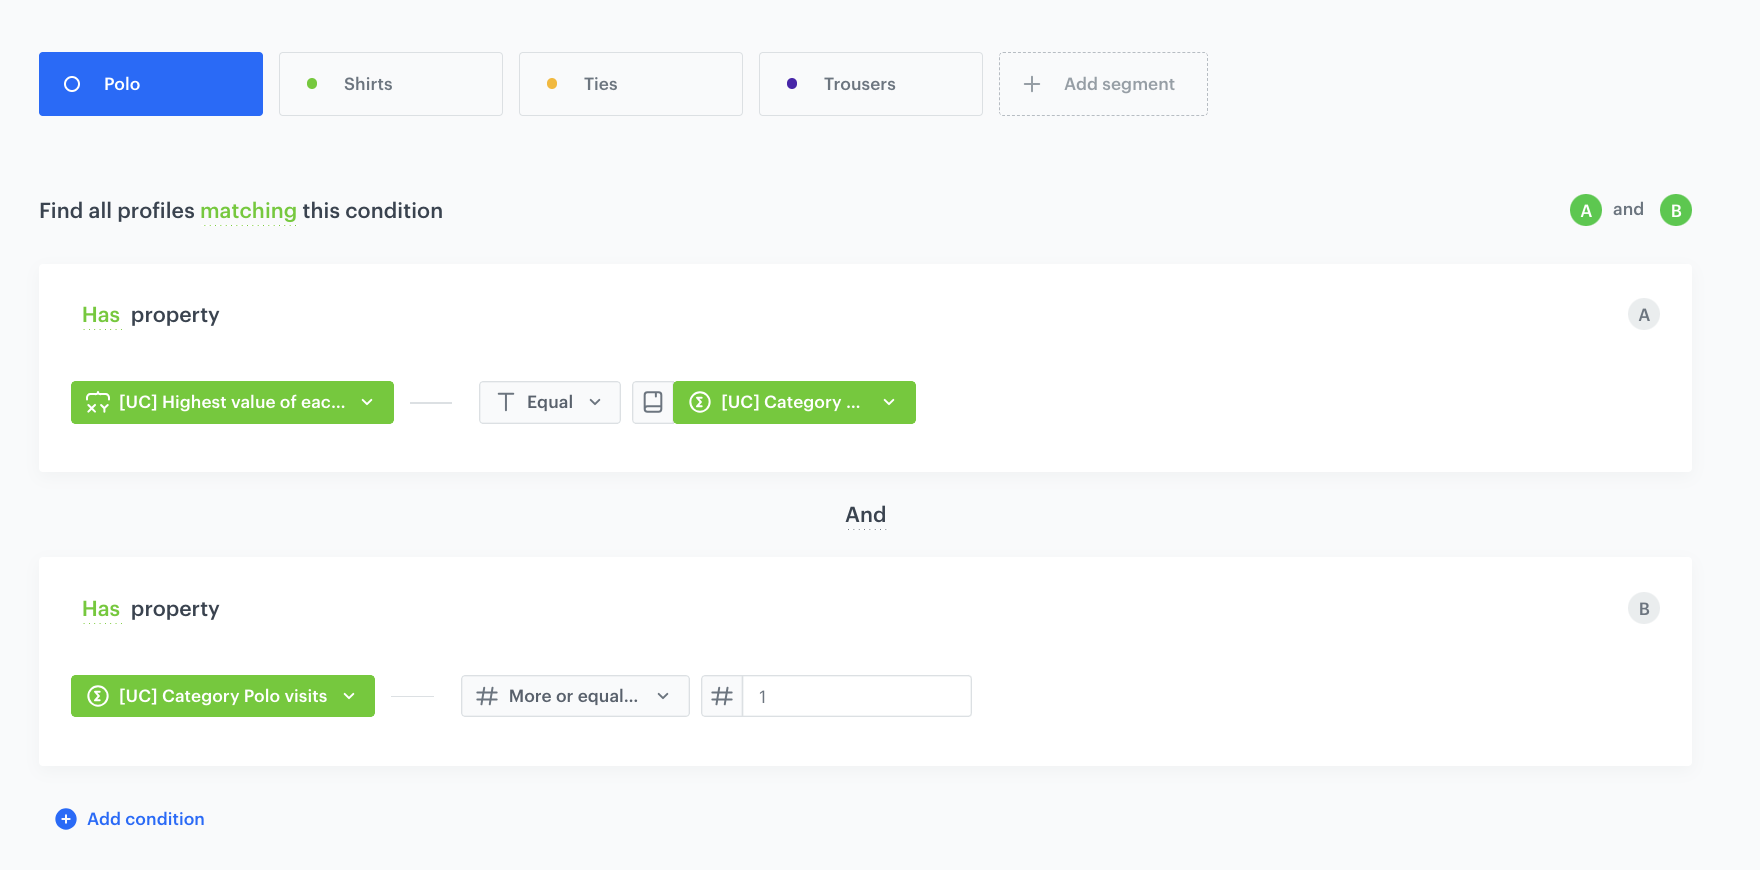
In this stage, create a segmentation based on previously created aggregates and expression. It will contain four segments, each dedicated to one category. This way you will find out which of the categories is most popular.
- Go to
 Decision Hub > Segmentations > New segmentation.
 - Enter the name of the segmentation.
- Click Choose filter.
- Select the Profiles tab.
- Select Expressions.
- Find the expression created in the previous steps.
- Choose the Equal operator.
- Click the icon next to the logic operator and keep clicking until you get
 .
. - From the Choose value dropdown list, click the
 icon, and then select Aggregates.
 - Find the aggregate for the first product category.
- From the Choose filter dropdown list, select an aggregate for the same product category for which you are creating a segment.
- From the Choose operator dropdown, choose Number, and then select More or equal to.
- Next to the logical operator, in the text field, enter
1.
Note: With this additional condition, you ensure to include in the segment only those users who have at least 1 visit on the selected page category. - Create the next segments for the remaining product categories by clicking the
 icon.
icon. - To save the segmentation, click Save.
- To preview the visual form of the segmentation, click Preview analyze.

What’s next
You can use the created segmentation on the dashboard or use it as an audience in any communication channel. You can also display personalized communicates on the website using dynamic content depending on the most often visited category by your customers.
Check the use case set up on the Synerise Demo workspace
The list below contains the aggregates from the use case with example categories created in our Synerise Demo workspace:
- Aggregate that returns the number of visits to the men shirts category
- Aggregate that returns the number of visits to the men trousers category
- Aggregate that returns the number of visits to the men ties category
- Aggregate that returns the number of visits to the men polo category
In our Synerise Demo workspace you can also find the configuration of the expression that returns the most frequently visited category by a customer and segmentation that organizes customers according to the visits to the categories.
If you’re our partner or client, you already have automatic access to the Synerise Demo workspace (1590), where you can explore all the configured elements of this use case and copy them to your workspace.
If you’re not a partner or client yet, we encourage you to fill out the contact form to schedule a meeting with our representatives. They’ll be happy to show you how our demo works and discuss how you can apply this use case in your business.

