Creating histograms
To create a graphic representation of metrics, add a histogram.
Allowed metrics
The table below summarizes metric configurations and their compatibility with histograms.
| Metric conditions* | Allowed in histograms? |
|---|---|
| Contain any profile attributes | No |
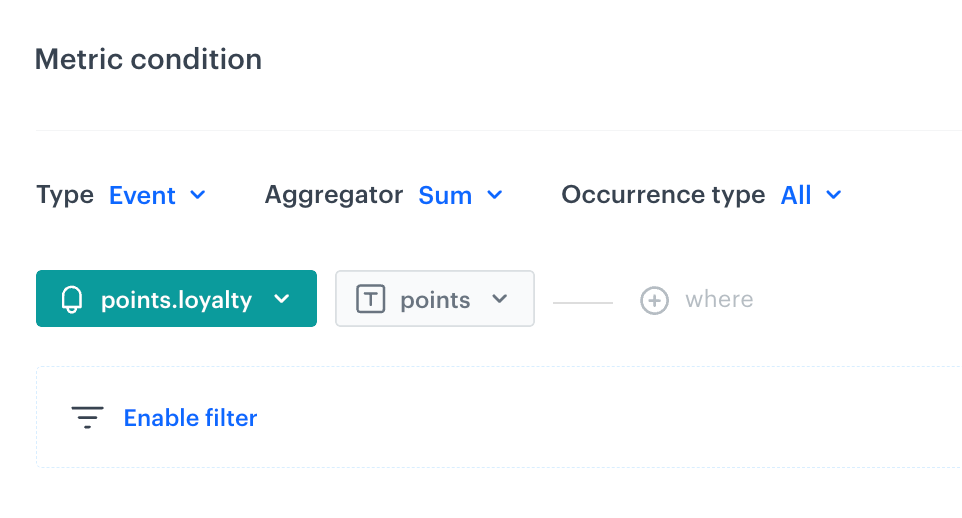
| Contain an event | Yes, except for the metrics with the First and Last aggregators |
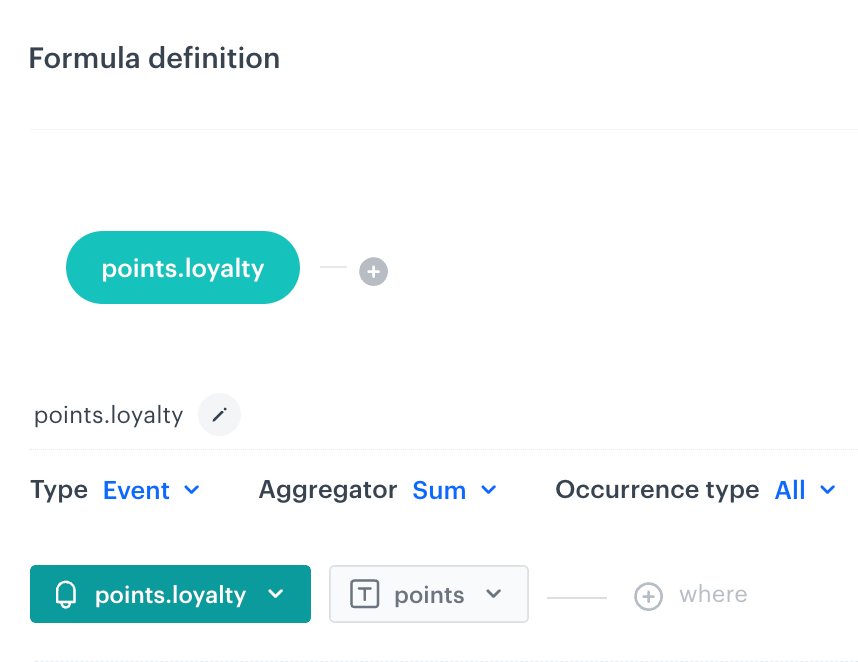
| Contain multiple events or one event with multiple parameters | Yes, except for the metrics with the First and Last aggregators |
| Contain multiple events with multiple parameters | No |
| No event or profile attribute in conditions (for example, a static value metric) | Yes |
* Metric conditions refers to the configuration of a metric on the interface for the following metric types:
Requirements
- You must have a user role with the following permissions:
- Create a metric.
Refer to the table in the “Allowed metrics” section to become familiar with the limits and constraints.
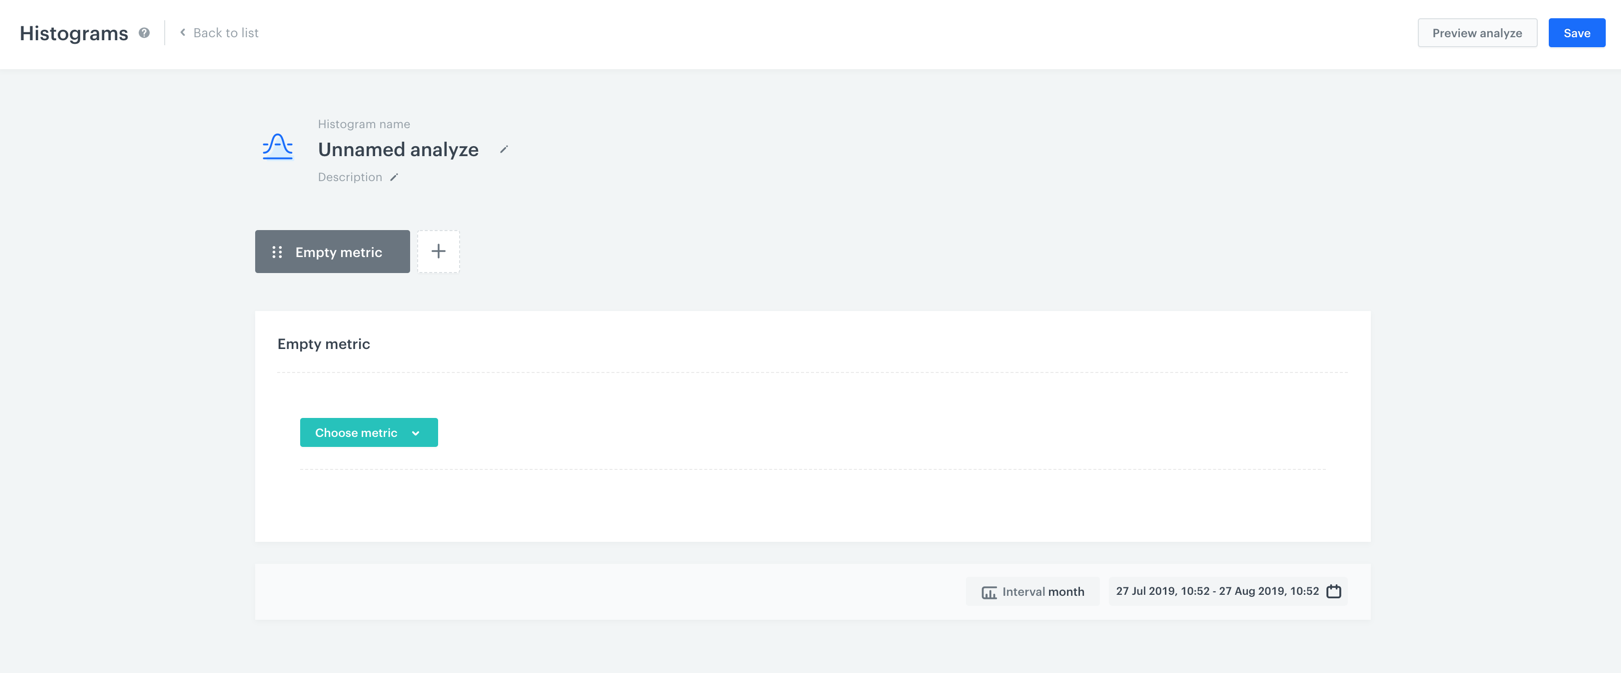
Creating a histogram
-
Go to
 Decision Hub > Histograms > New histogram.
 -
Enter the name of the histogram.
-
Optionally, to let other users know about the purpose of the histogram, write a short description.
-
From the list of metrics, select a metric you want to include in the histogram.
Refer to the table in the “Allowed metrics” section to become familiar with the limits and constraints. -
To choose the time units by which the metric data is aggregated in the histogram, click the Interval button.
Important: When you select the monthly interval option, the display of the histogram presents the results of metrics from 30 days. That is the reason of a slight discrepancy may occur between the results of the histogram and the metric used in the histogram. -
To select the time range analyzed in the histogram, click the calendar icon. The chosen date range will apply to all metrics added to the histogram.
Important: Pay attention to the time intervals set in metrics and in the histogram. If the histogram analyzes a period that is longer than the one set in the metric, you will not see the data for the periods that don’t overlap the metric period. -
To add another metric to the histogram, click the plus button (you can add up to 7 metrics).
-
To complete the process, click the Save button.
Result: You can find the histogram on the list of histograms.