Creating reports
Create a report on the basis of metrics to analyze the aspects of selected metrics.
Allowed metrics
The table below summarizes metric configurations and their compatibility with reports.
Note: The metric type is only determined by whether event parameters or profile attributes are used in the metric conditions. Doing math operations (like adding or subtracting), adding numbers, or using functions in metrics does not change the metric type.
| Metric conditions* | Allowed to be selected in the report conditions? | Allowed dimensions for these metric conditions |
|---|---|---|
| Contain only profile attributes | Yes, except for the metrics with the Count Distinct aggregator | All profile attributes (all options available in the Profiles tab) |
| Contain one event | Yes, except for the metrics with the Count Distinct aggregator | - All profile attributes (all options available in the Profiles tab) - All types of event parameters (event parameters and specials, event expressions, event aggregates) |
| Contain multiple events or one event with multiple parameters | Yes, except for the metrics with the Count Distinct aggregator | Only event parameters, specials, event aggregates that are shared between the events included in the metric |
| Contain a profile attribute and an event | No | n/a |
| No event or profile attribute in conditions (e.g., static value metric) | No | n/a |
How to read this table?
-
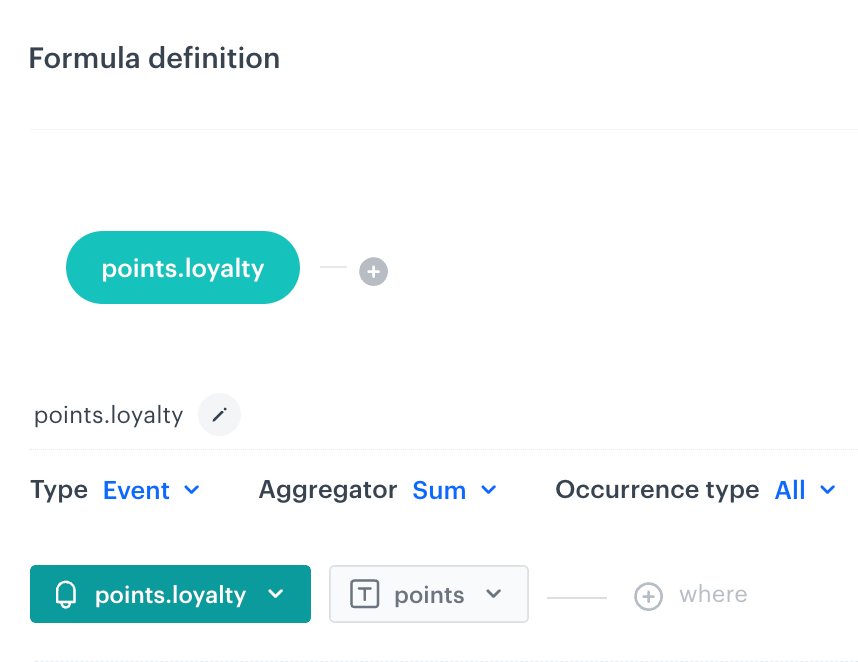
*Metric conditions refers to the configuration of a metric on the interface for the following metric types: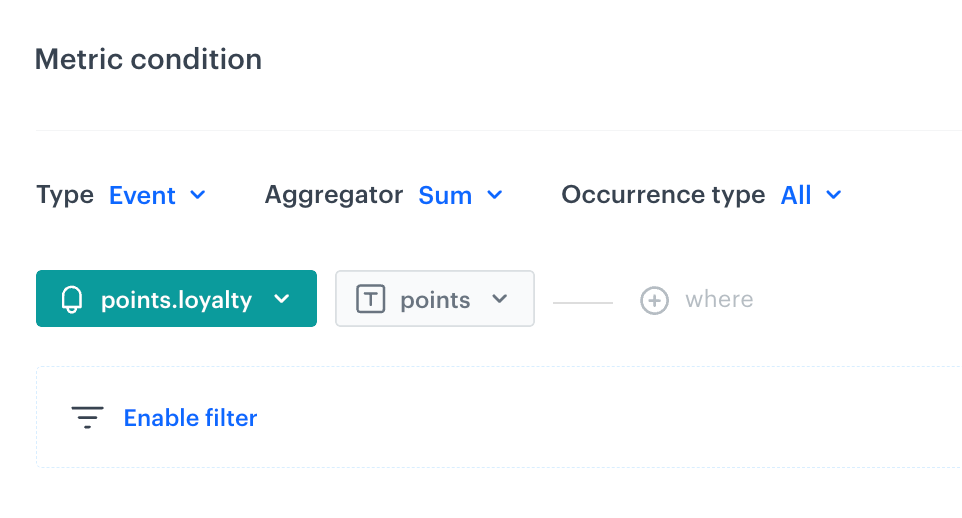
Metric conditions of a simple metric -
Report configuration refers to the dropdown list with metrics to be selected for a report:
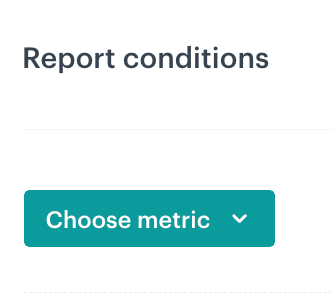
This option is available in the configuration of a report in Analytics > Report > New report -
Allowed dimensions refers to the option in the report configuration that opens a dropdown with event parameters (the Event tab) and profile attributes (the Profiles tab):
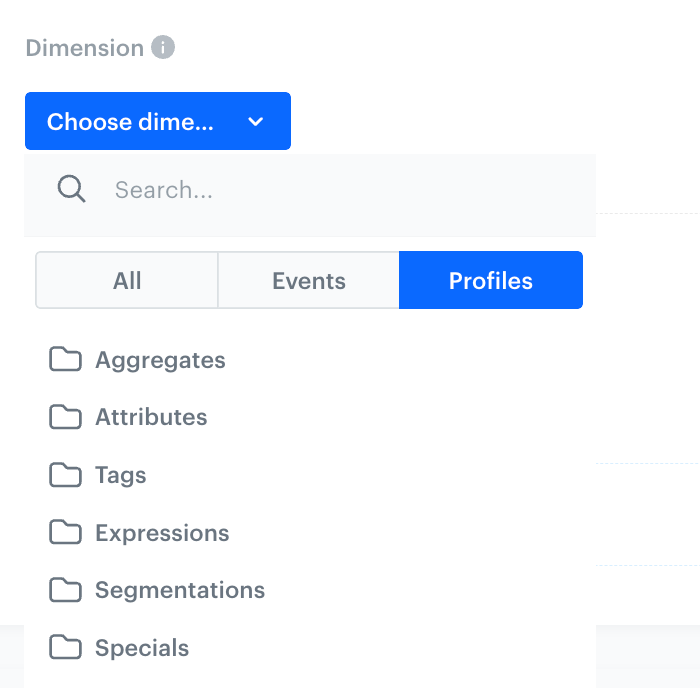
Report dimension dropdown options
Requirements
- You must have a user role with the following permissions:
- Create a metric
Refer to the table in the “Allowed metrics” section to become familiar with the limits and constraints.
Note:You can read more about metrics in:
Also, you can explore a collection of use cases demonstrating how reports and metrics are employed.
Creating a report
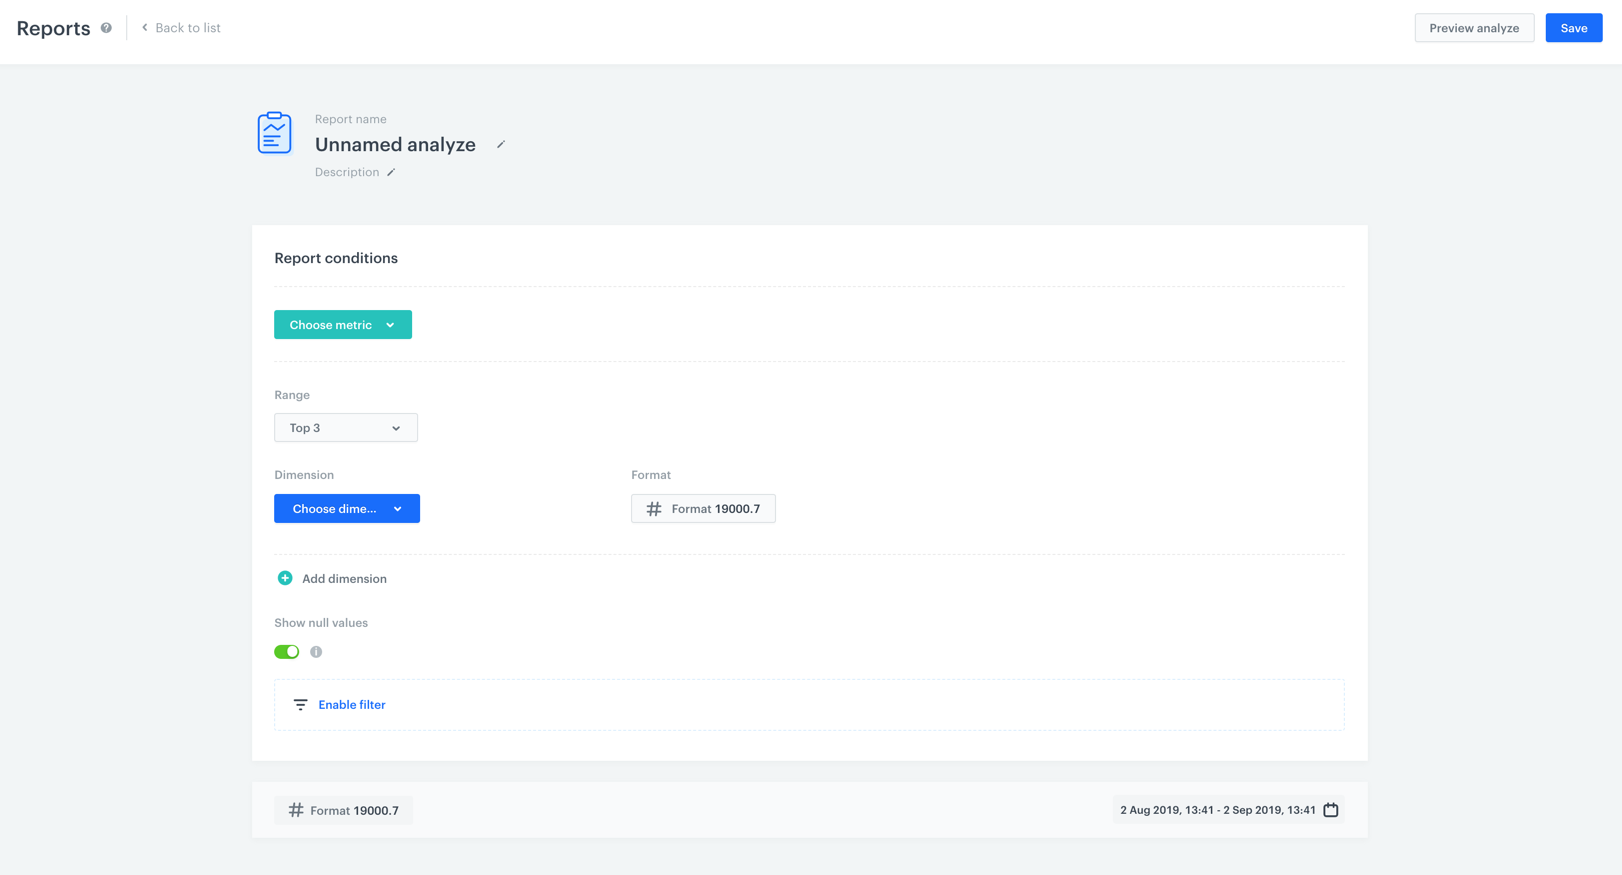
- Go to
 Decision Hub > Reports > New report.
 - Enter the name of the report.
- Optionally, to let other users know about the purpose of the analysis, write a short description.
- Select a metric on the basis of which the report is created. To do so, click the Choose metric and from the dropdown list, select a metric.
Refer to the table in the “Allowed metrics” section to become familiar with the limits and constraints. - To choose the type of results you want to generate in the report, click the button in the Range section. From a dropdown list select either top (receiving the highest results) or last results (last meaning recent).
- To choose the aspects of data from the metrics (dates, names, quantity, and more) you want to include in the report, click the Choose dimension button.
Refer to the table in the “Allowed metrics” section to become familiar with the allowed dimensions for the metric you selected in the step 4. - If you want to add a time context to display the dates when the event occurred, click Add dimension. Then go to Events > Expressions. From the list of expressions, select an event expression.
Tip: You can create an event expression which uses one of the following expression functions: Day of month, Day of week, Day of year - To turn off the null values (to increase the readability of the analysis), switch the Show null values option off.
- If you want to narrow down the scope of the metric data, click the Enable filter option. This filter works as an additional condition.
- To determine the time range from which the data will be analyzed, click the calendar and define the date filter.
Important: The date range in the report doesn’t have to overlap the date range in the metric.
- To complete the process, click the Save button.