Sankey Diagrams in Synerise allow users to reconstruct the flow of customer actions before or after an occurrence of a particular event. Using an event as a reference point, users create diagrams that present steps to get the answers to questions such as "how much?" and "how is it connected with each other?".
Benefits
- Personalize the user experience on the website.
- Minimize the number of steps to conversion.
- Verify the most popular conversion paths and their soft spots.
You can view the change history for this analysis from its configuration - see Audit Log.
Requirements
A tracking code implemented into the website.
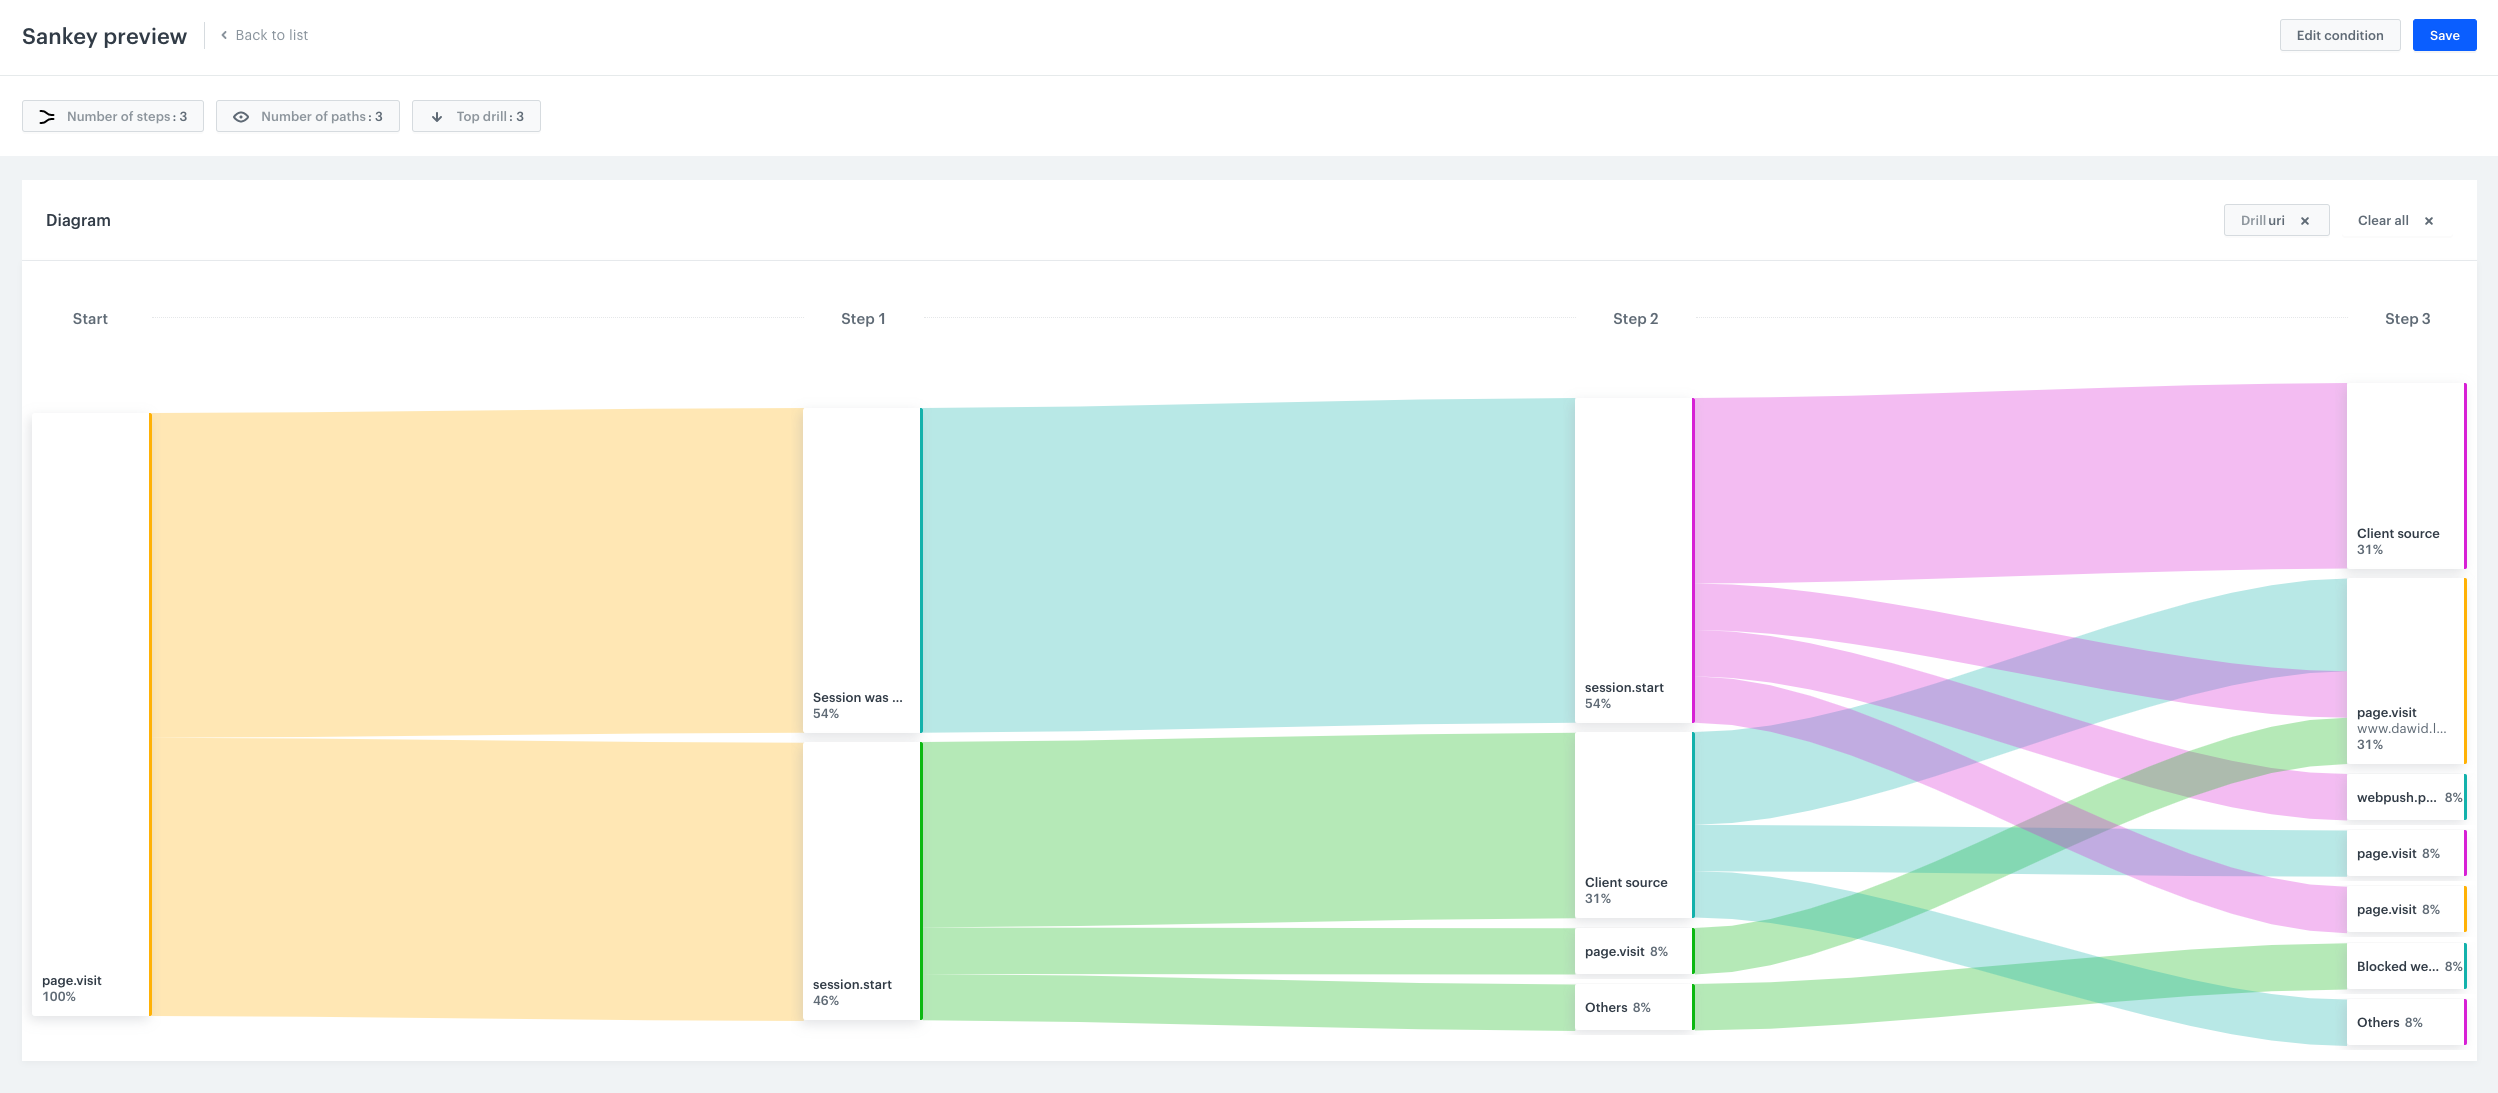
Sankey diagram example