When a dashboard is saved, it's private by default. You can make it accessible to all workspace users by changing its status, share it with specific workspace users with defined permissions, or generate a shareable link for non-workspace users.
Dashboard statuses
- Private - Only the author of the dashboard can preview and edit the dashboard.
- Public Readable - All users of a workspace where the dashboard was created can preview it, however, only the author can edit it.
- Public Editable - All users of a workspace where the dashboard was created can preview and edit it.
Sharing with all workspace users
- Go to
 Decision Hub > Dashboards.
 - Find a dashboard you want to share.
- On the right of the dashboard name, click the icon with the status.
Result: A dropdown list appears. - From the dropdown list, select a dashboard status.
- Public Readable - All users of a workspace where the dashboard was created can preview it, however, only the author can edit it.
- Public Editable - All users of a workspace where the dashboard was created can preview and edit it.
Sharing with specific workspace users
- Go to Decision Hub > Dashboards.
- Click the dashboard on the list.
- In the upper-right corner, click the Share button.
Result: A dropdown list appears. - From the dropdown list, select the With user option.
Result: The Share with user pop-up appears. - In the Email address field, enter the email address of a workspace user you want to grant access to.
- From the dropdown next to the email field, select the permission level:
- View - The user can only preview the dashboard.
- Edit - The user can preview and edit the dashboard. Users with this permission can also share the dashboard with other users.
- If you want to give access to more than one user, click Add email and repeat steps 5–6.
- Confirm by clicking Apply.
Result: The selected users are granted access to the dashboard. There is no email notification sent to them.
To revoke access, open the Share with user pop-up and remove the user's email address.
Sharing with non-workspace users
To share a dashboard with users who are not part of your workspace, generate a shareable link. The link points to a snapshot of the dashboard's results from the time it was shared.
The snapshot is available even after the dashboard is deleted.
- Go to Decision Hub > Dashboards.
- Click the dashboard on the list.
- Wait for all elements of the dashboard to calculate. If necessary, scroll down to confirm that all calculations are complete.
WARNING: If you click Share before all the calculations are finished, the shared dashboard will be incomplete.
- On the upper right side, click the Share button.
Result: A list appears. - From the dropdown list, select the By link option.
Result: A pop-up appears. - In the TTL (days) field, define how long the link remains active.
- Click Generate.
Result: The dashboard link is generated. The pop-up displays the Created, Last update, and Valid until timestamps. The Valid until date is calculated as the date and time of clicking Generate plus the number of days set in the TTL (days) field.
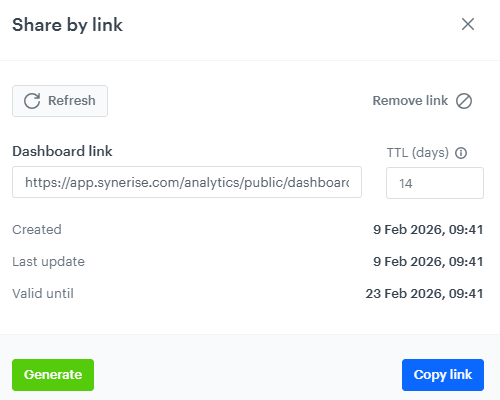
A generated link to the dashboard - Click Copy link.
WARNING: The dashboard under the link isn't updated in real time. It displays data from the date shown in the Last update. To update the dashboard data under the link, open the pop-up and click Refresh.
To revoke access to the shared link, open the pop-up and click Remove link.
Exporting a dashboard to XLSX
- Go to Decision Hub > Dashboards.
- Click the dashboard you want to export.
- In the upper-right corner, click the
 icon.
icon.
Result: A dropdown list appears. - From the dropdown list, select Export to XLSX.
Result: The file is generated and downloaded. The export always contains all widgets on the dashboard; you can't select which ones to include.
IMPORTANT: Exporting a dashboard requires only the read permission for dashboards — anyone who can preview a dashboard and see this menu can also export it. There's no separate permission for exporting.
After you click Export to XLSX, the system waits up to 15 seconds for all widgets to finish loading. If some widgets are still loading when this time is up, the export is generated anyway using the data that's already loaded, and you get a warning stating how many widgets weren't included in time.
File format
The export is a single XLSX file with one sheet. The data of all widgets is placed on that sheet one after another, separated by empty rows.
Each widget type (for example, a metric, a report, or a segmentation) has its own layout, since the data it produces is different - there's no single format shared across all widget types. To analyze or visualize the exported data in Excel or another tool, check the layout of each widget's data and apply your own formatting or rules.
The export contains only the values of the results. If a widget displays its results as a currency, the exported values don't include the currency code.
NOTE: A given widget's layout doesn't change between exports. For example, if a widget shows results for the last 7 days, the specific information placed in each cell stays the same every time you export it, no matter what the underlying data is - only the values change.
Dates in the exported file
For each widget, the exported file shows the same date information as displayed on the dashboard:
- If the widget's dates are set to Lifetime, the export shows the date range.
- If the widget's dates are set to specific dates, the export shows the from and to dates.
- If no dates are set on the widget, the export shows
null.
IMPORTANT: Segmentation widgets added directly to a dashboard always use the date range from the segmentation itself — the dashboard date range can't override them (see Date ranges in dashboards). Because of that, the export always shows null for the dates of a segmentation widget.
To understand how the dashboard date range, the widget date range, and the overwriting checkboxes on a widget affect the dates applied to an analysis, see Date ranges in dashboards.
Viewing the audit log of a dashboard
- Go to Decision Hub > Dashboards.
- Click the dashboard you want to check.
- In the upper-right corner, click the icon.
Result: A dropdown list appears. - From the dropdown list, select Show audit log.
Result: You can view the history of changes for that specific dashboard in the Audit Log.
Cloning a dashboard to another workspace
- Go to Decision Hub > Dashboards.
- Click the dashboard you want to clone.
- In the upper-right corner, click the icon.
Result: A dropdown list appears. - From the dropdown list, select Clone to workspace.
Result: The Choose destination pop-up appears.
For the rest of the procedure, see Cloning analyses to other workspaces.