To create a graphic representation of metrics, add a histogram.
Allowed metrics
The table below summarizes metric configurations and their compatibility with histograms.
| Metric conditions* | Allowed in histograms? |
|---|---|
| Contain any profile attributes | No |
| Contain an event | Yes, except for the metrics with the First and Last aggregators |
| Contain multiple events or one event with multiple parameters | Yes, except for the metrics with the First and Last aggregators |
| Contain multiple events with multiple parameters | No |
| No event or profile attribute in conditions (for example, a static value metric) | Yes |
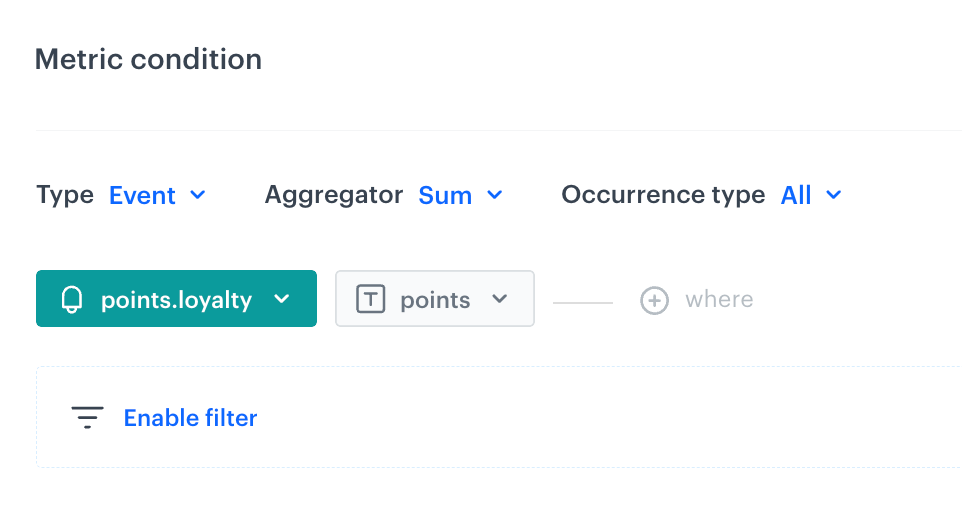
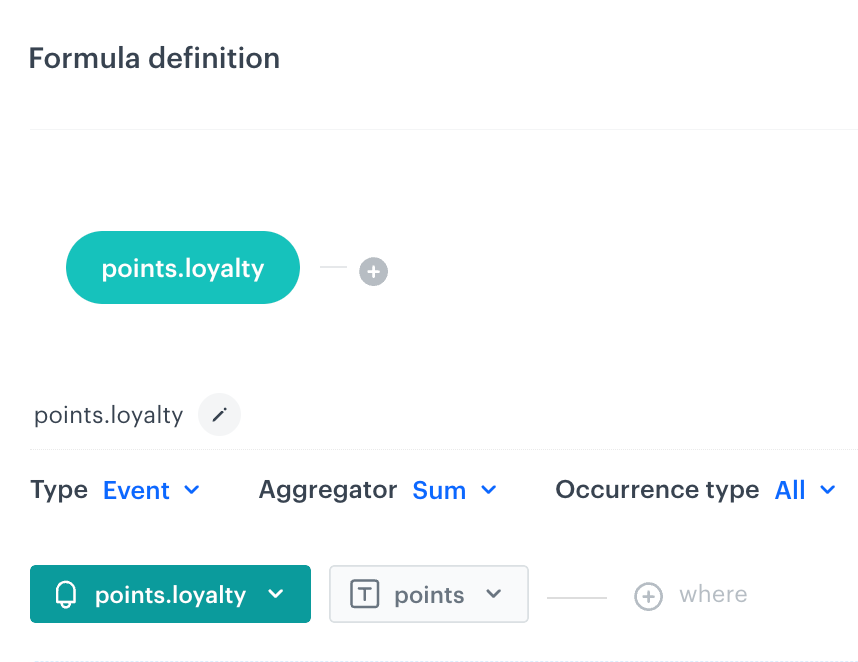
* Metric conditions refers to the configuration of a metric on the interface for the following metric types:
Requirements
You must have a user role with the following permissions:
- access the Decision Hub
- view analyses
- create analyses
- edit analyses
- preview results
Create a metric.
Refer to the table in the "Allowed metrics" section to become familiar with the limits and constraints.You can read more about metrics in:
Creating a histogram
- Go to
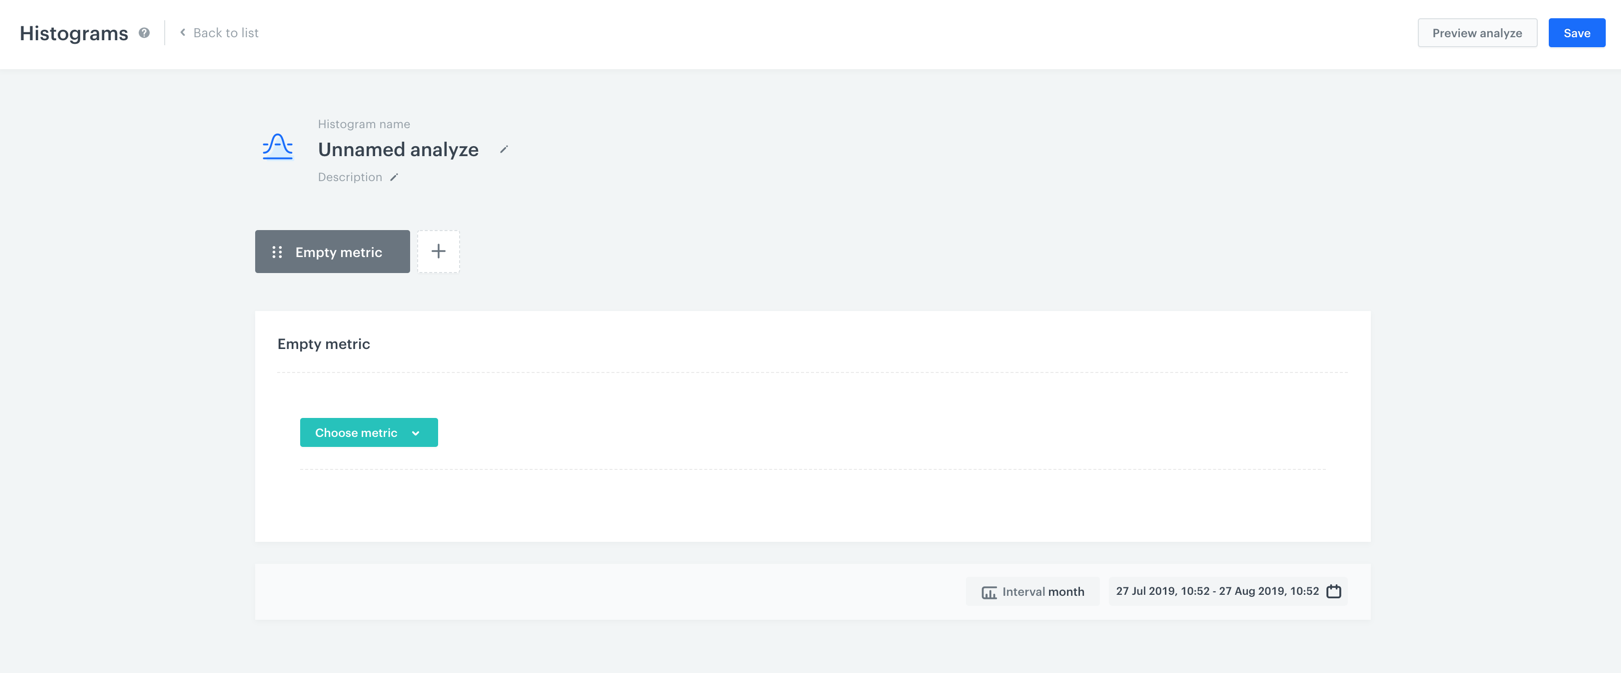
 Decision Hub > Histograms > New histogram.
 - Enter the name of the histogram.
- Optionally, to let other users know about the purpose of the histogram, write a short description.
- From the list of metrics, select a metric you want to include in the histogram.
Refer to the table in the "Allowed metrics" section to become familiar with the limits and constraints. - To choose the time units by which the metric data is aggregated in the histogram, click the Interval button.
When you select the monthly interval option, the display of the histogram presents the results of metrics from 30 days. That is the reason of a slight discrepancy may occur between the results of the histogram and the metric used in the histogram.
- To select the time range analyzed in the histogram, click the calendar icon. The chosen date range will apply to all metrics added to the histogram.
Pay attention to the time intervals set in metrics and in the histogram. If the histogram analyzes a period that is longer than the one set in the metric, you will not see the data for the periods that don't overlap the metric period.
- To add another metric to the histogram, click the plus button (you can add up to 7 metrics).
- To complete the process, click the Save button.
Result: You can find the histogram on the list of histograms.