Create a report on the basis of metrics to analyze the aspects of selected metrics.
Allowed metrics
The table below summarizes metric configurations and their compatibility with reports. It applies to reports with one and more metrics used in a report.
The metric type is only determined by whether event parameters or profile attributes are used in the metric conditions. Doing math operations (like adding or subtracting), adding numbers, or using functions in metrics does not change the metric type.
| Metric conditions* | Allowed to be selected in the report conditions? | Allowed dimensions for these metric conditions |
|---|---|---|
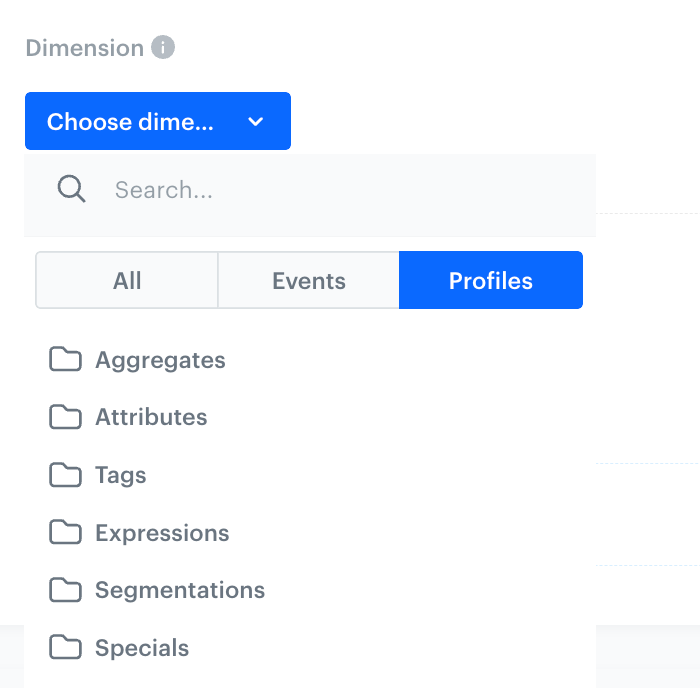
| Contain only profile attributes | Yes | All profile attributes (all options available in the Profiles tab) |
| Contain one event | Yes | - All profile attributes (all options available in the Profiles tab) - All types of event parameters (event parameters and specials, event expressions, event aggregates) |
| Contain multiple events or one event with multiple parameters | Yes | Only event parameters, specials, event aggregates that are shared between the events included in the metric |
| Contain a profile attribute and an event | No | n/a |
| No event or profile attribute in conditions (e.g., static value metric) | No | n/a |
How to read this table?
- Metric conditions refers to conditions defined in the metric settings:
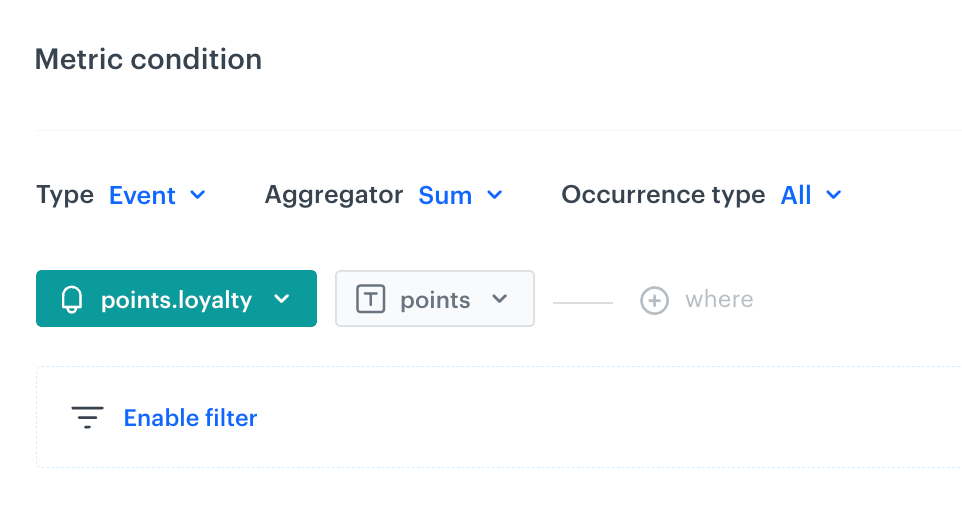
Metric conditions of a simple metric 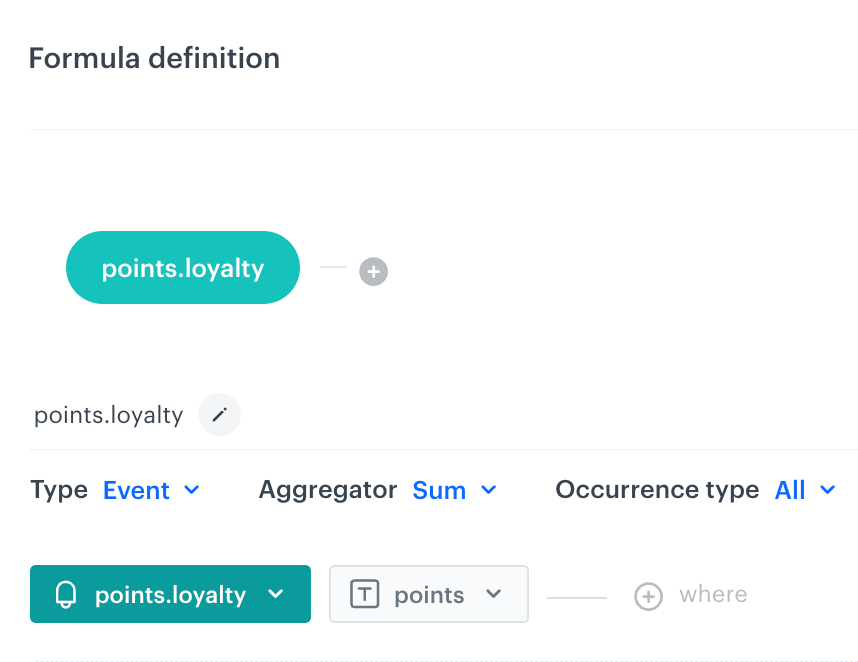
Metric conditions of a formula metric - Dimensions refers to the option in the report configuration that opens a dropdown with event parameters (the Event tab) and profile attributes (the Profiles tab). By default, only profile dimensions are available. To be able to select event dimensions, you need to add at least one event metric.
Requirements
You must have a user role with the following permissions:
- access the Decision Hub
- view analyses
- create analyses
- edit analyses
- preview results
Create at least one metric
Refer to the table in the "Allowed metrics" section to become familiar with the limits and constraints.
You can read more about metrics in:
Also, you can explore a collection of use cases demonstrating how reports and metrics are employed.
Creating a report
- Go to
 Decision Hub > Reports > New report.
 - Enter the name of the report.
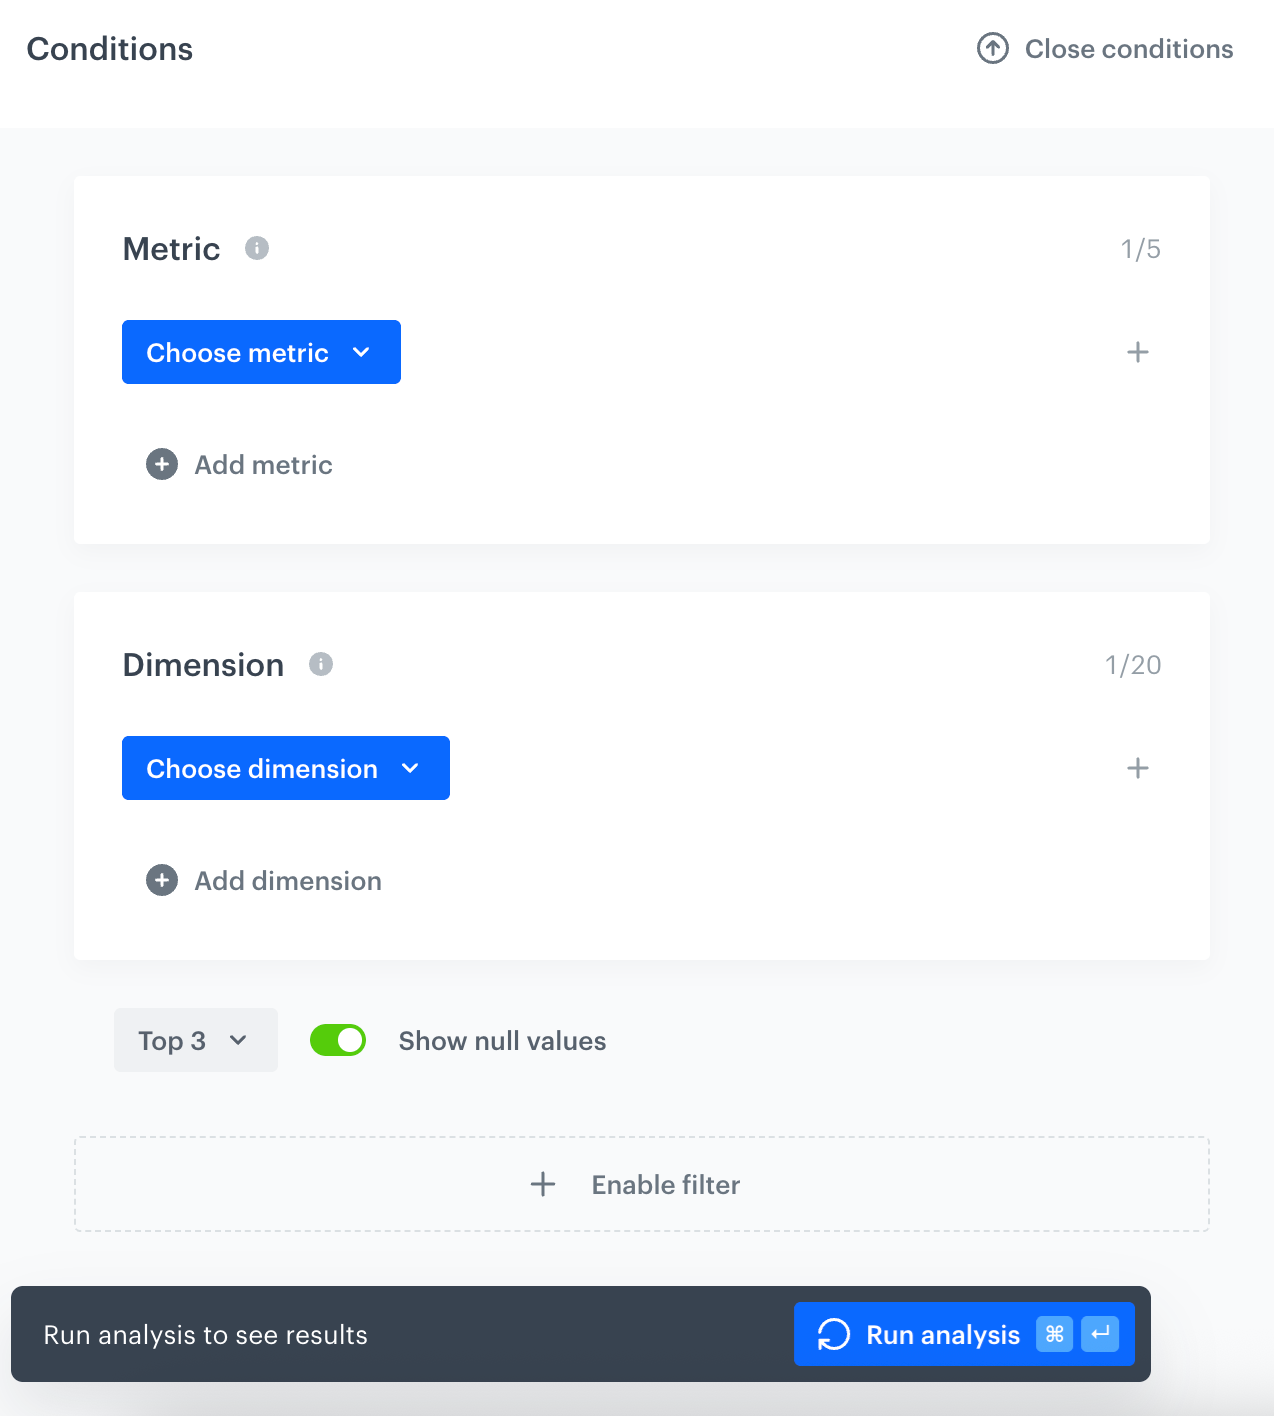
- Select a metric on the basis of which the report is created. To do so, click Choose metric and from the dropdown list, select a metric.
The table in the "Allowed metrics" section explains the limits and constraints. - Optionally, to include more than one metric in the report, click Add metric > Choose metric and select an additional metric from the dropdown. You can add up to 5 metrics in total. The same metric can be added multiple times.
When more than one metric is added, the maximum number of dimensions is reduced to 5, and the maximum Range value is 100.
- To choose the type of results you want to generate in the report, click the button in the Range section. From the dropdown list, select either top (receiving the highest results) or last results (last meaning recent). The maximum value is 100 when multiple metrics are used.
To choose the aspects of data from the metrics (dates, names, quantity, and more) you want to include in the report, click Choose dimension. You can add up to 20 dimensions for a single-metric report, or up to 5 dimensions when using multiple metrics.
Refer to the table in the "Allowed metrics" section to become familiar with the allowed dimensions for the metric you selected. When using multiple metrics, only dimensions that are valid for all selected metrics are available.
- If you want to add a time context to display the dates when the event occurred, click Add dimension. Then go to Events > Expressions. From the list of expressions, select an event expression.
You can create an event expression using functions such as Day of month, Day of week, or Day of year. When organizing results by time units, use the year/month/day/hour format inside the expression (for example, 2019/06/23), because report results are sorted by date interpreted as a string.
- To turn off the null values for a specific dimension (to increase the readability of the analysis), switch the Show null values option off for that dimension.
To configure per-metric settings such as the column name, time window, and value format, next to a metric to expand its details, click the + icon:
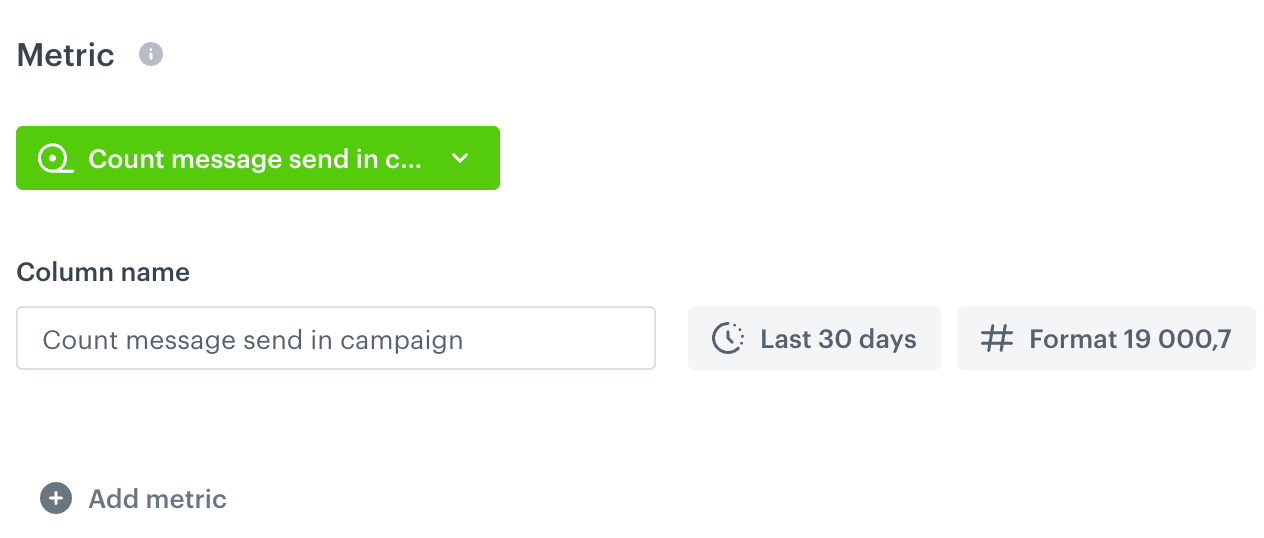
Settings of metric displayed in the report - Column name — The label displayed in chart legends and table column headers. The default value is the metric name.
- Time window — The date range applied to this specific metric (for example, Last 30 days).
- Value format — The number format used to display this metric's results.
You can reorder metrics and dimensions using the drag-and-drop handle or the arrow icons that appear next to each item. You can also duplicate or delete individual metrics and dimensions using the corresponding icons.
- If you want to narrow down the scope of the metric data, click the Enable filter option. This filter works as an additional condition applied globally to the report.
- To save the report, click the Save button.
- To generate report results, click Run analysis.
Viewing report results with multiple metrics
The report results are displayed as follows:
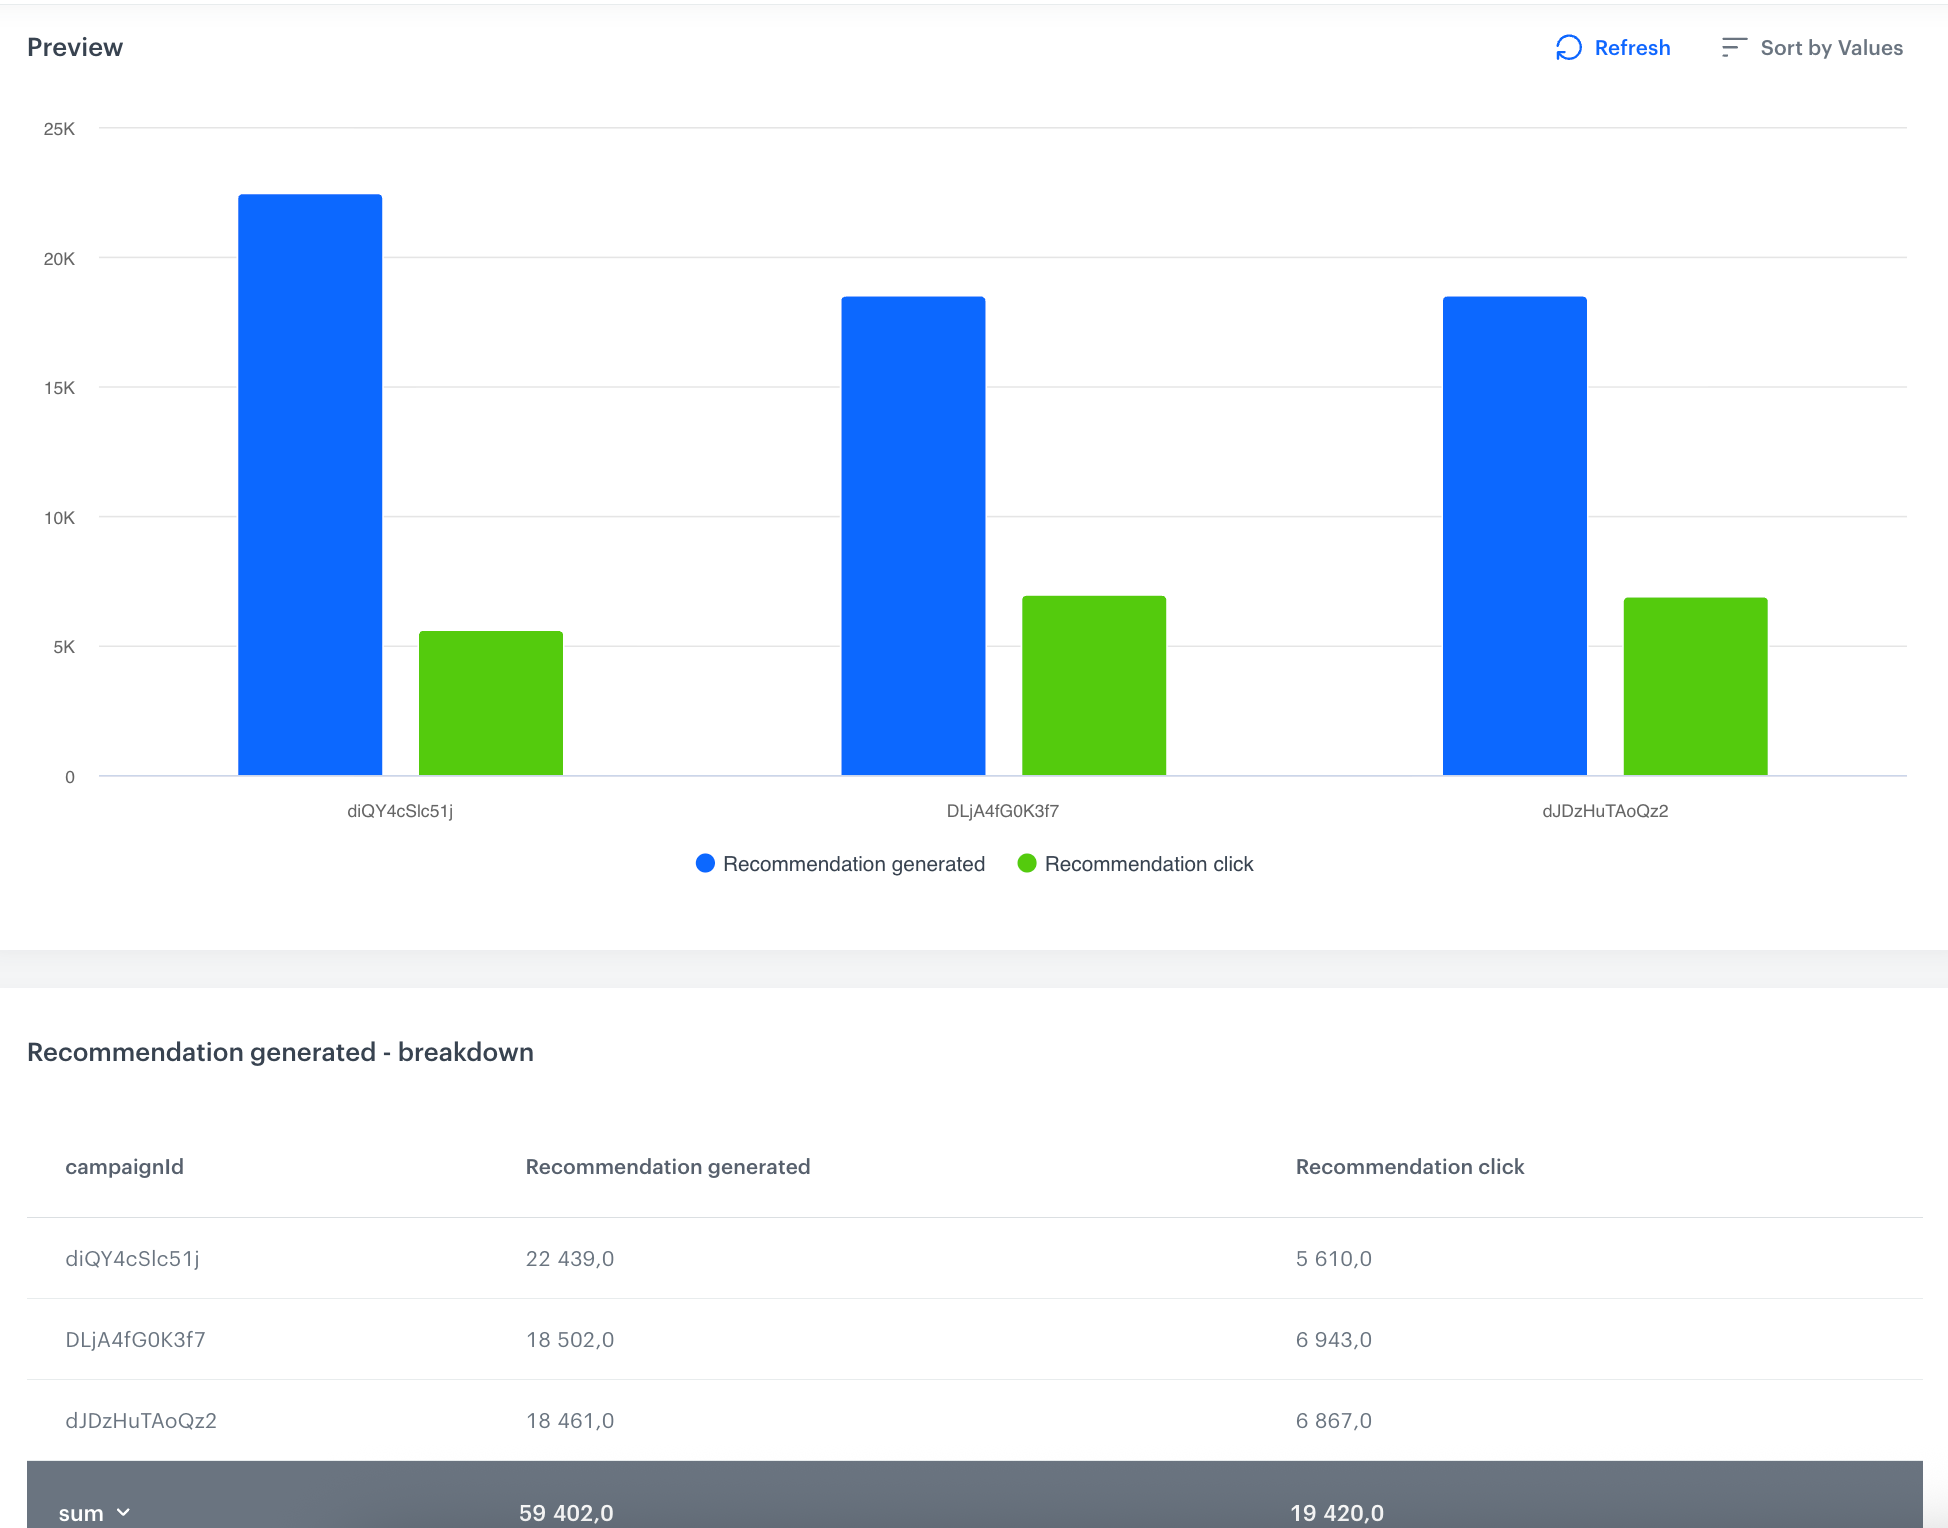
- Chart — For each dimension value, bars for all metrics are shown side by side, with the same color used for bars of the same metric.
- Tooltip — Hovering over a bar shows the dimension value name and the metric name and value.
- Legend — The legend displays each metric's color and name (as defined in the Column name field).
- Table — Each metric appears as a separate column, with the column header taken from the metric's Column name setting.
Reports with multiple metrics cannot use the comparison feature on the Dashboard. If you want to compare data, add additional metrics directly in the report options.