Creating trends
If you want to compare the occurrence of several events over time, you need to create a trend. The analysis of the selected events will be presented on the chart. Trends will be analyzed with regards to customers or events. In the preview of a trend, you can choose the analysis aspect on the chart.
Requirements
A tracking code implemented into website.
Creating a trend

-
Go to
 Decision Hub > Trends > New trend.
 -
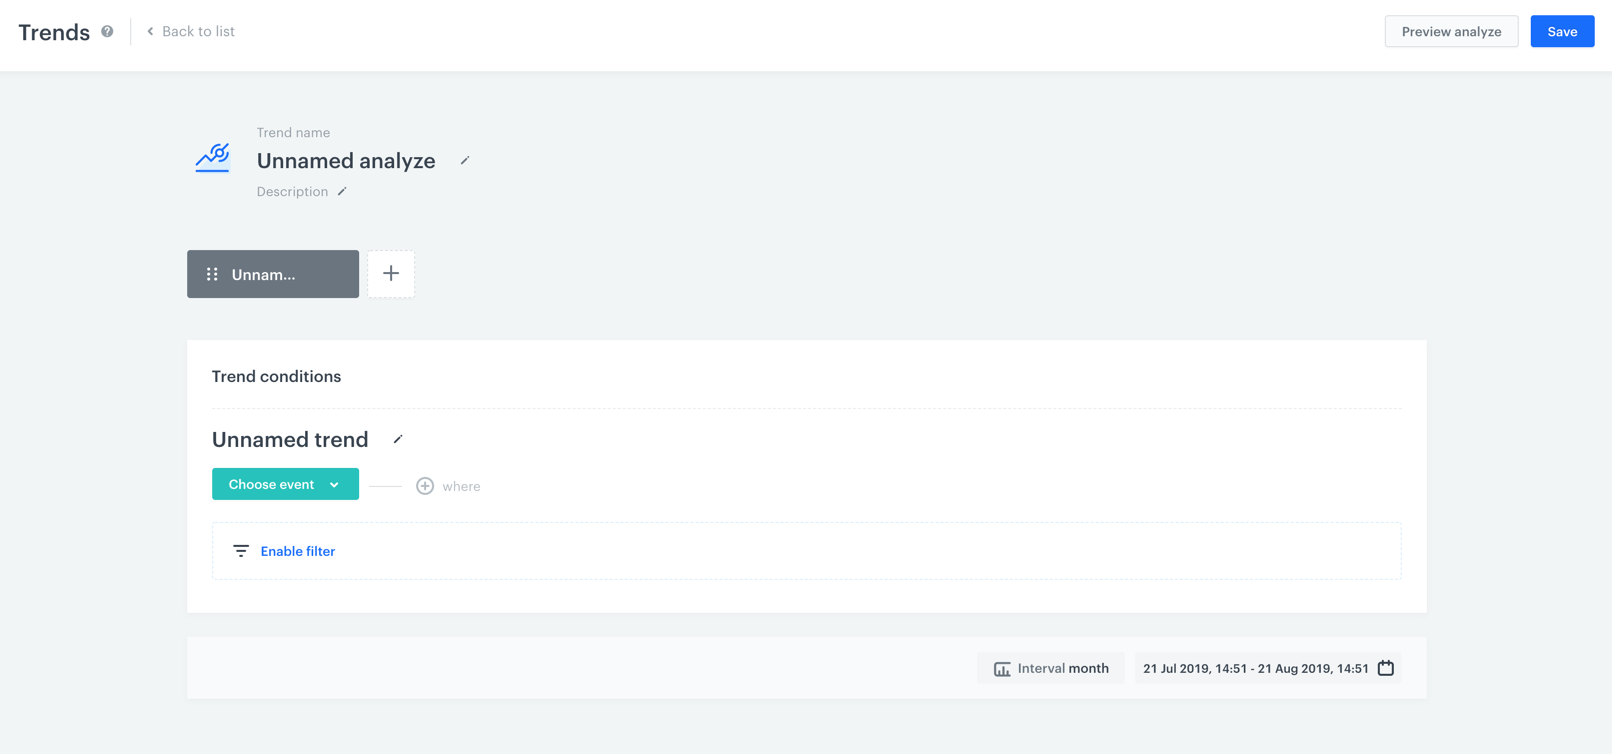
Enter the name of the trend.
-
Optionally, to let users of the workspace know about the purpose of the trend, you can write a short description. s3. Choose the event you want to analyze. A trend is an analysis of an event’s number of occurrences. You can filter the events to analyze by setting optional filters:
- If you want to narrow down the scope of customers, click the Enable filter option. This profile filter works as an additional condition a customer has to meet in order to be counted in the trend.
Important: The filter affects the whole trend. If you add another event to be analyzed, the filter will affect the newly added event as well.- If you want to be more specific and analyze a particular aspect of the event, click the Where button and select event parameters.
-
If you want to add another event to the analysis, click the plus button.
-
To define how you want the data to be presented on the chart, click the Interval button. From the dropdown list, select whether you want to the trend results to be presented for each day, week, month, and year in the selected time range.
-
To determine the time range from which the data is analyzed, click the calendar icon and set the time constraints. Confirm you choice with the Apply button.
-
To complete the process, click the Save button. When you save the trend, you can find your trend on the list of trends.