Comprehensive consumption reports
Consumption reports are XLSX spreadsheets with:
- Event consumption data made with both calculation methods.
- API call consumption details.
Creating the report
To download a report:
- Sign in to Synerise.
- Enter an organization.
If you can’t see any organizations next to the workspace list, it means you don’t have access to an organization. - Go to
 Statistics.
 - On the Events tab, select a data filter for the report:
- From the Workspaces dropdown list, select the workspaces to include. By default, all workspaces are selected.
- From the Event dropdown list, select the events to include. By default, all events are selected.
- On the API calls tab, from the Workspaces dropdown list, select the same workspaces as on the Events tab.
If the selection differs, the report can’t be generated. - Click Generate report.
Generating the report may take some time, depending on the size of the dataset.
Result: When the report is ready, your browser downloads it automatically or opens a dialog to confirm the download, depending on your settings.
Reading the report
To read the report, open it with spreadsheet software, such as Microsoft Excel.
You can filter and/or sort the data in the tables in the report. The available options depend on the software you’re using.
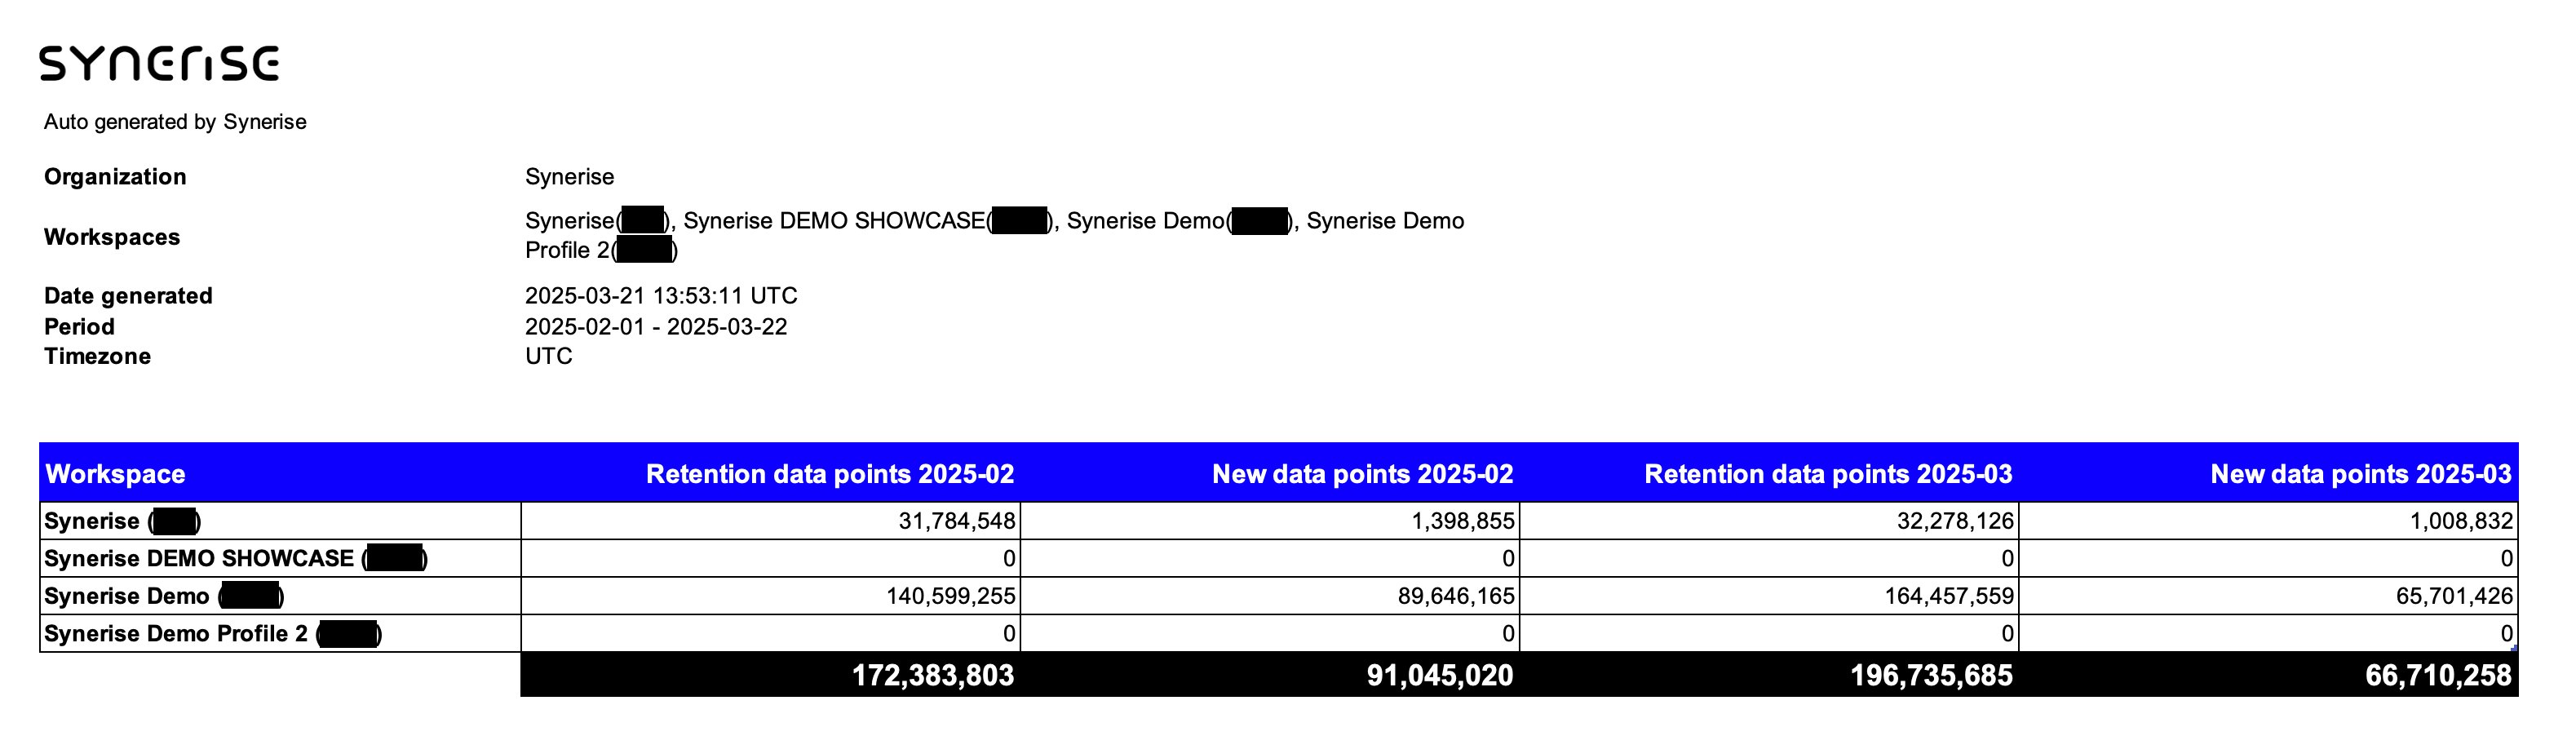
Summary sheet
Basic information about the report, such as the list of included workspaces and the generation date.
The table in this sheet shows the number of events and API calls in the entire organization for each month.
If your report includes only a part of a month (for example, Sep 1 - Sep 15), remember that:
- New data points and API calls are calculated only for the days of the month that are included in the report. If your report is for only a part of the month, the number is usually lower than for a full month.
- Retention events and their average number are calculated only for the days included in the report. If a report is only for a part of a month, the average daily value is usually similar to the daily average from a full month.
All_data_YYYY-MM sheets
These sheets are generated for each month included in the report.
The tables show the number of events (both calculation methods) and API calls on each day of the month. Only workspaces and events/endpoints with at least 1 occurrence/daily average are listed.
Monthly_summary_YYYY_MM sheets
These sheets are generated for each month included in the report.
The tables show the number of events and API calls summarized for the entire month. Only workspaces and events/endpoints with at least 1 occurrence/daily average are listed.
All_data_workspace_YYYY_MM sheets
These sheets are generated for each month included in the report.
The tables show the number of events and API calls counted in each workspace in a given month. Only workspaces and events/endpoints with at least 1 occurrence/daily average are listed.