You can view the statistics of your activated, paused, and finished workflows to evaluate their effectiveness, but statistics are also useful for troubleshooting.
You can view general workflow statistics on the list of workflows and the statistics of each node in a workflow. The basic information includes the number of profiles for which the action in the node has been executed/which met the node conditions. The full statistics reference is available in the "Statistics reference" section.
The completeness of the profile list depends on the retention for the following events: automation.clientStartPath, automation.clientPathStep and automation.clientEndPath events. If a profile generated the event further in the past than the retention period, the profile is not included in the list.
This is because the profile list is retrieved from the analytics engine each time. Numerical stats (such as how many profiles entered a node) are stored separately and not affected by retention.
Workflow statistics
- To access the statistics, go to
 Automation Hub > Workflows.
 - On the workflow list, find the workflow whose statistics you want to see.
In the row with the workflow, the columns show these statistics:- Started: The number of times a workflow was started (a trigger node was activated).
- In workflow: The number of workflows currently in progress.
- Finished: The number of times the final step (End node) of a workflow was reached. The number is not equal to the number of unique completions the workflow - a profile or a process can repeat within a workflow multiple times (if the node and workflow limits allow it).
Node statistics
- To access the statistics, go to Automation Hub > Workflows.
- On the workflow list, click the workflow you want to see the details of.
After entering the workflow details, each node displays a chart that shows passages/node executions in the last 7 days.
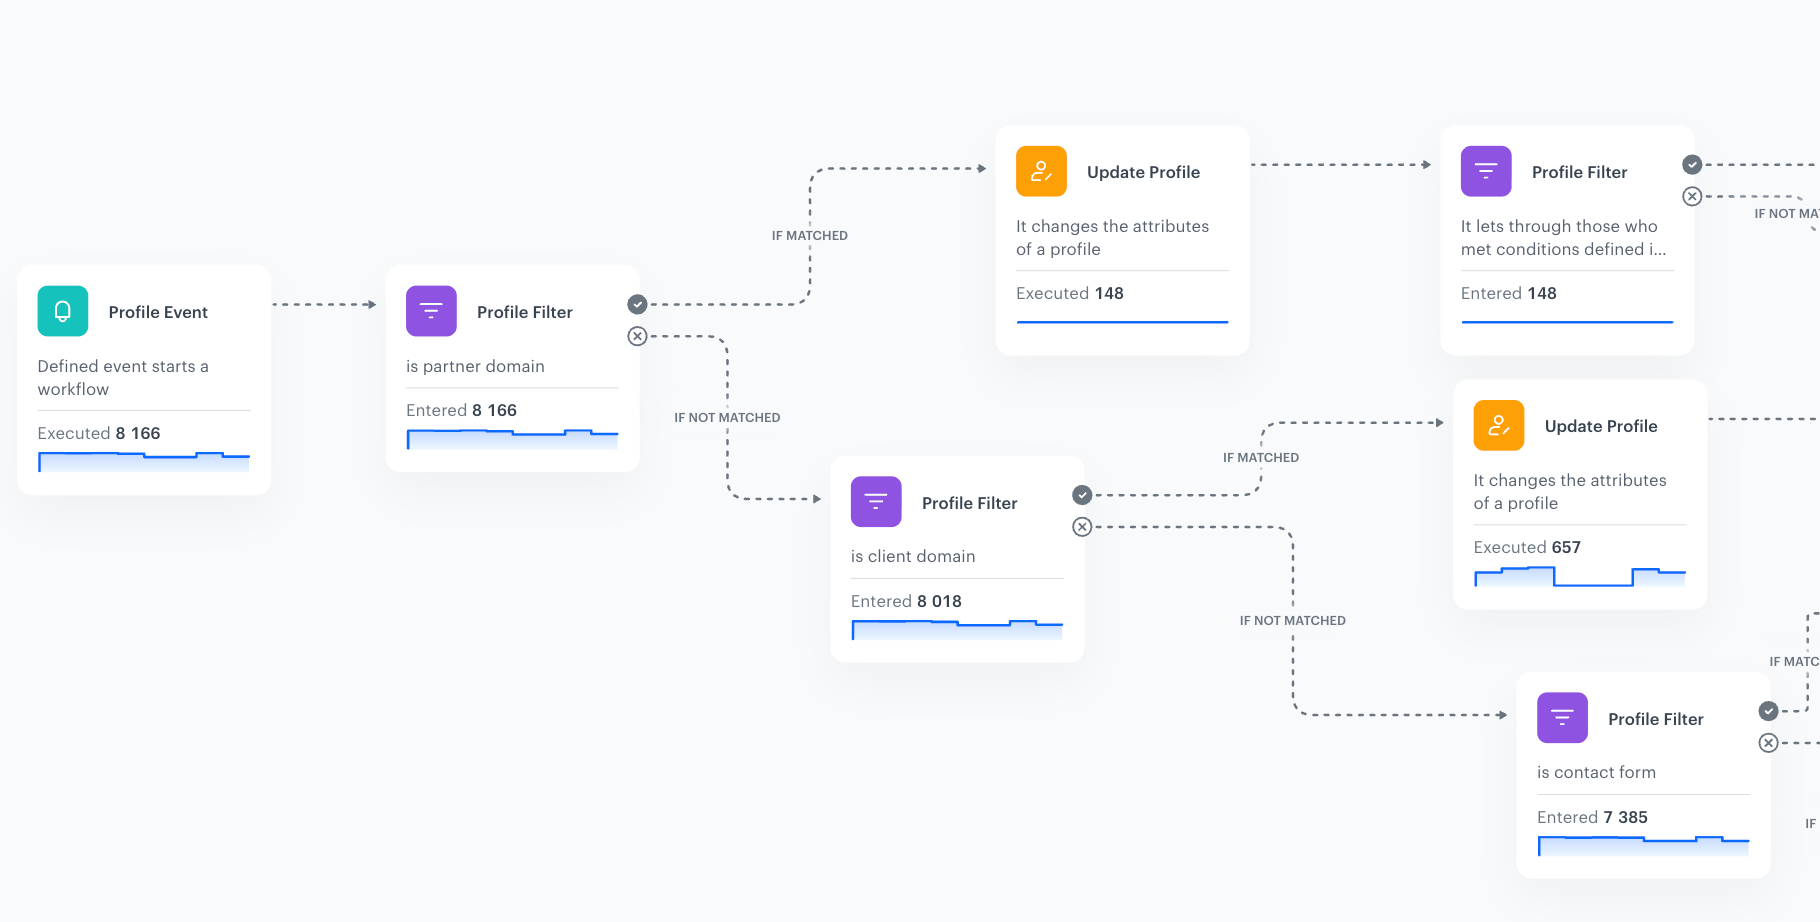
The node statistics preview - To preview the statistics of the node, click the node.
Result: The Statistics tab opens.
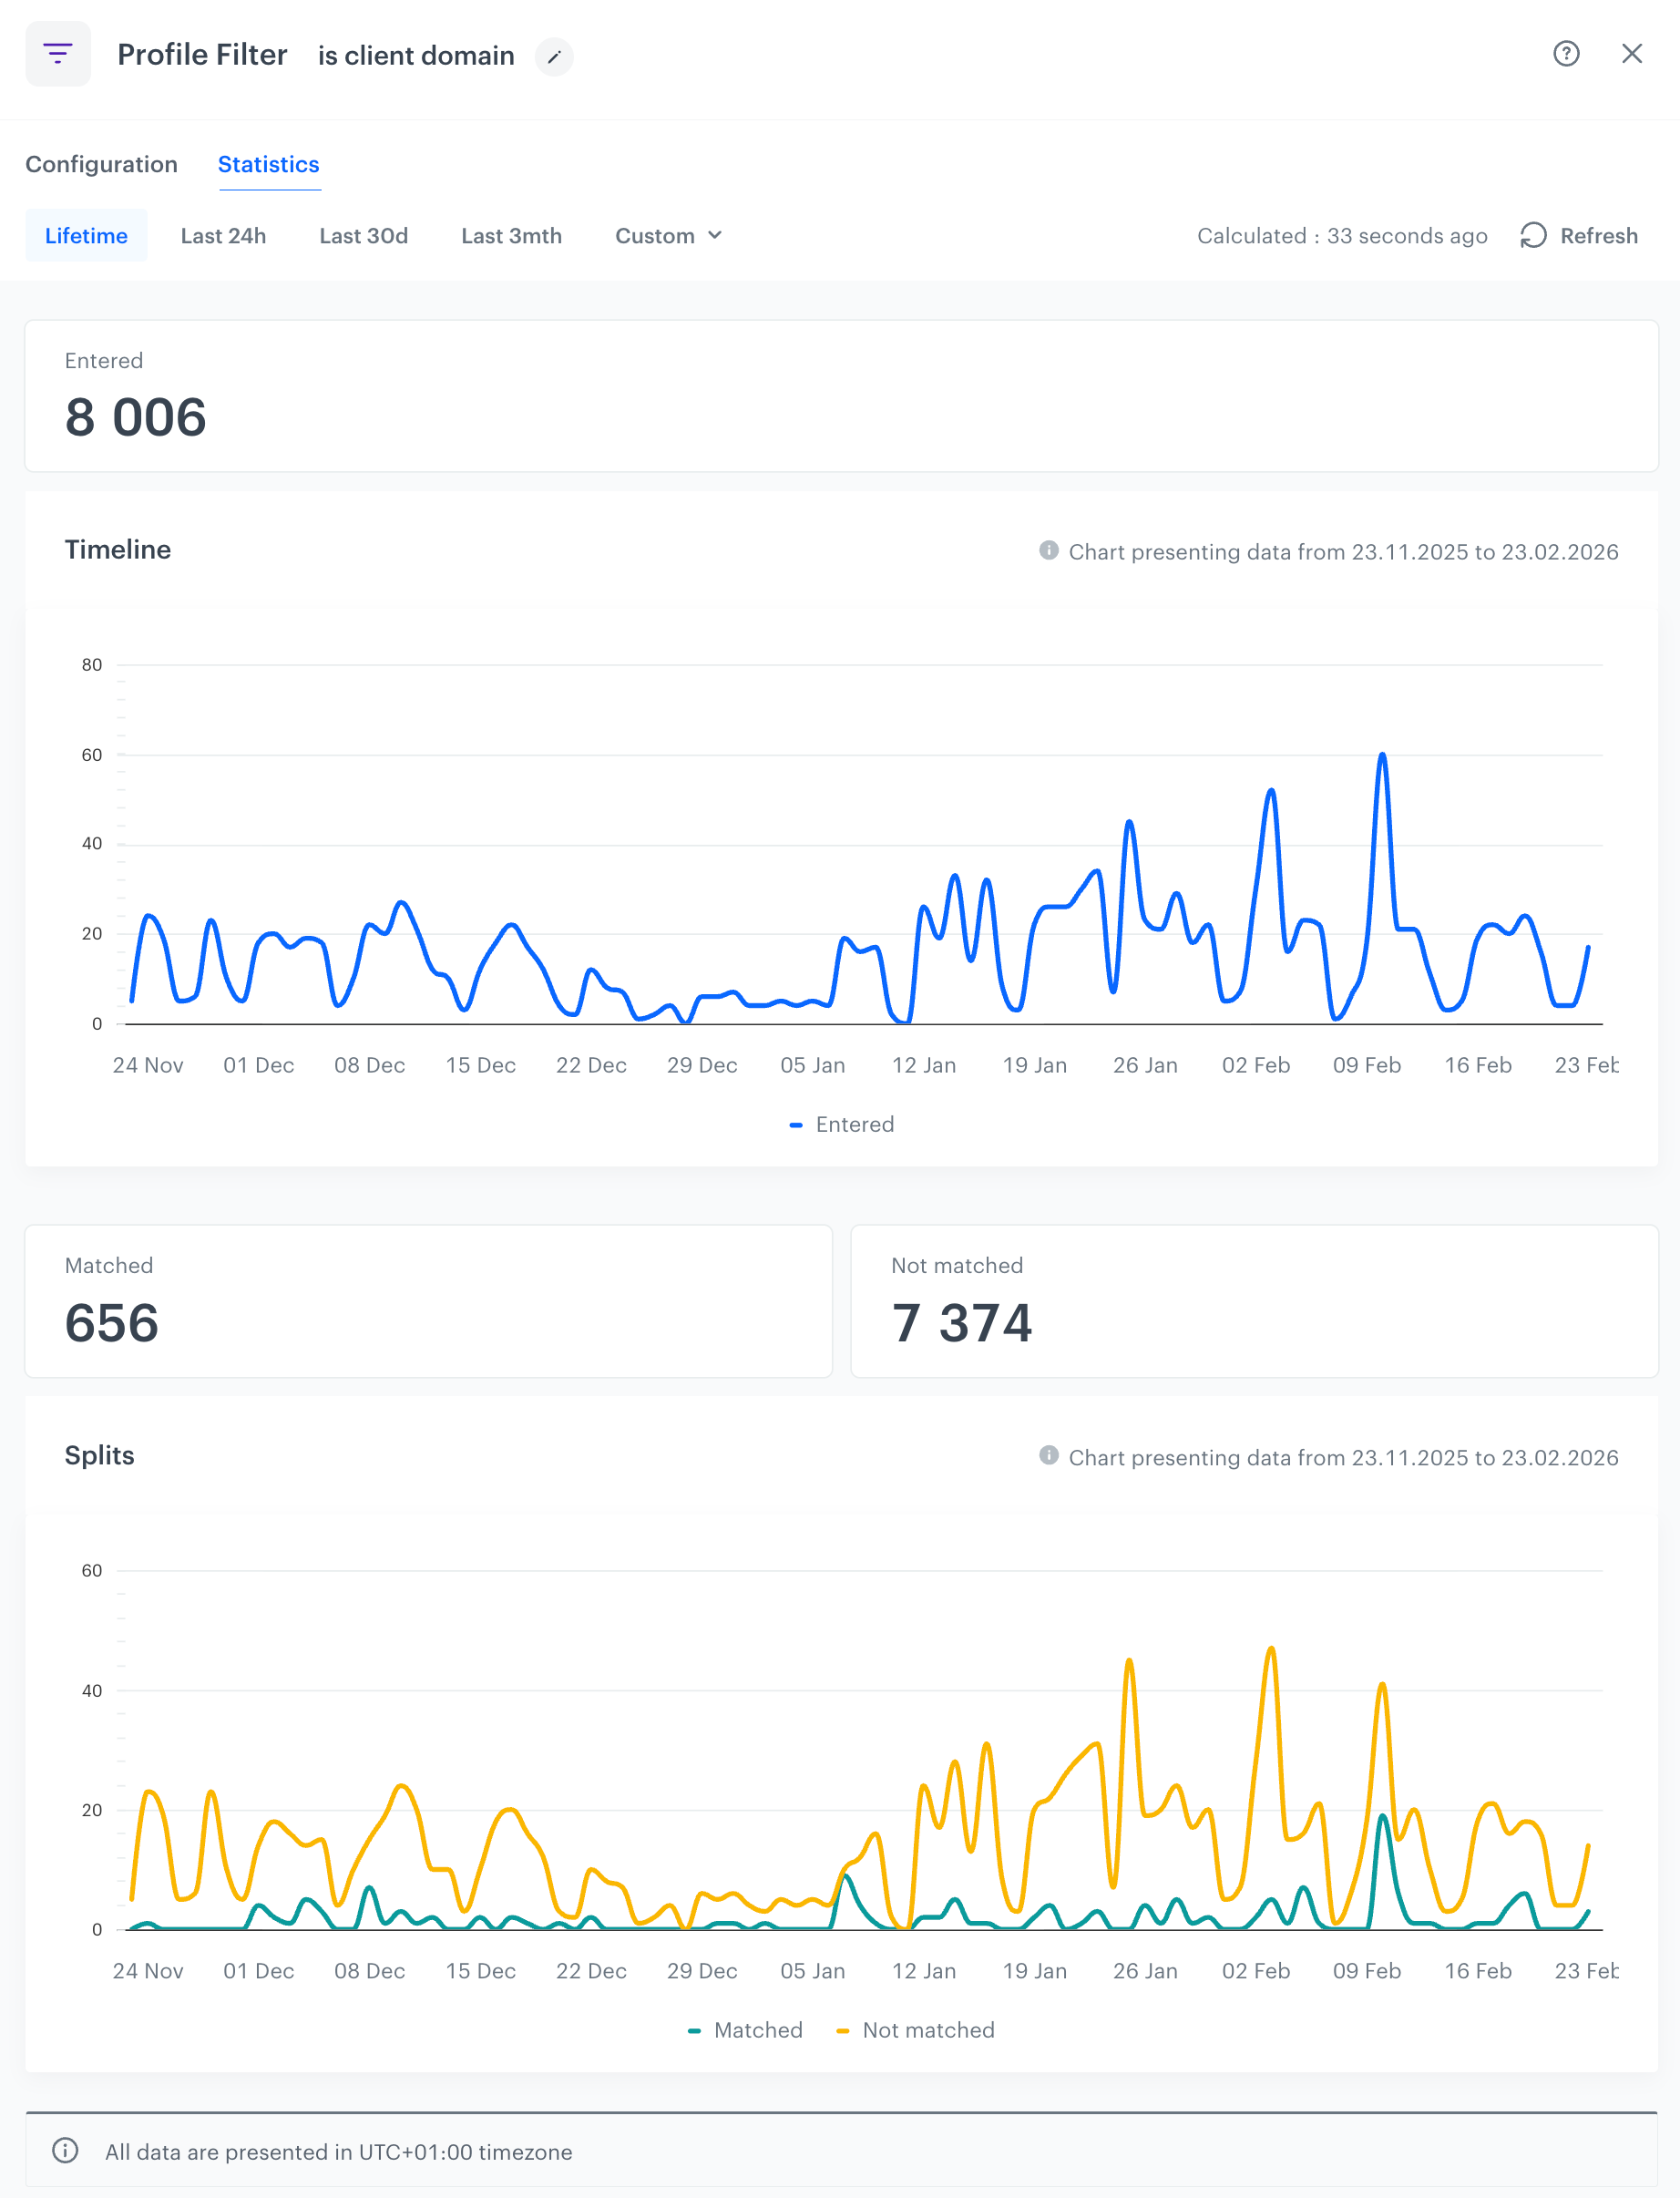
The node statistics preview
Charts
- Chart on the node
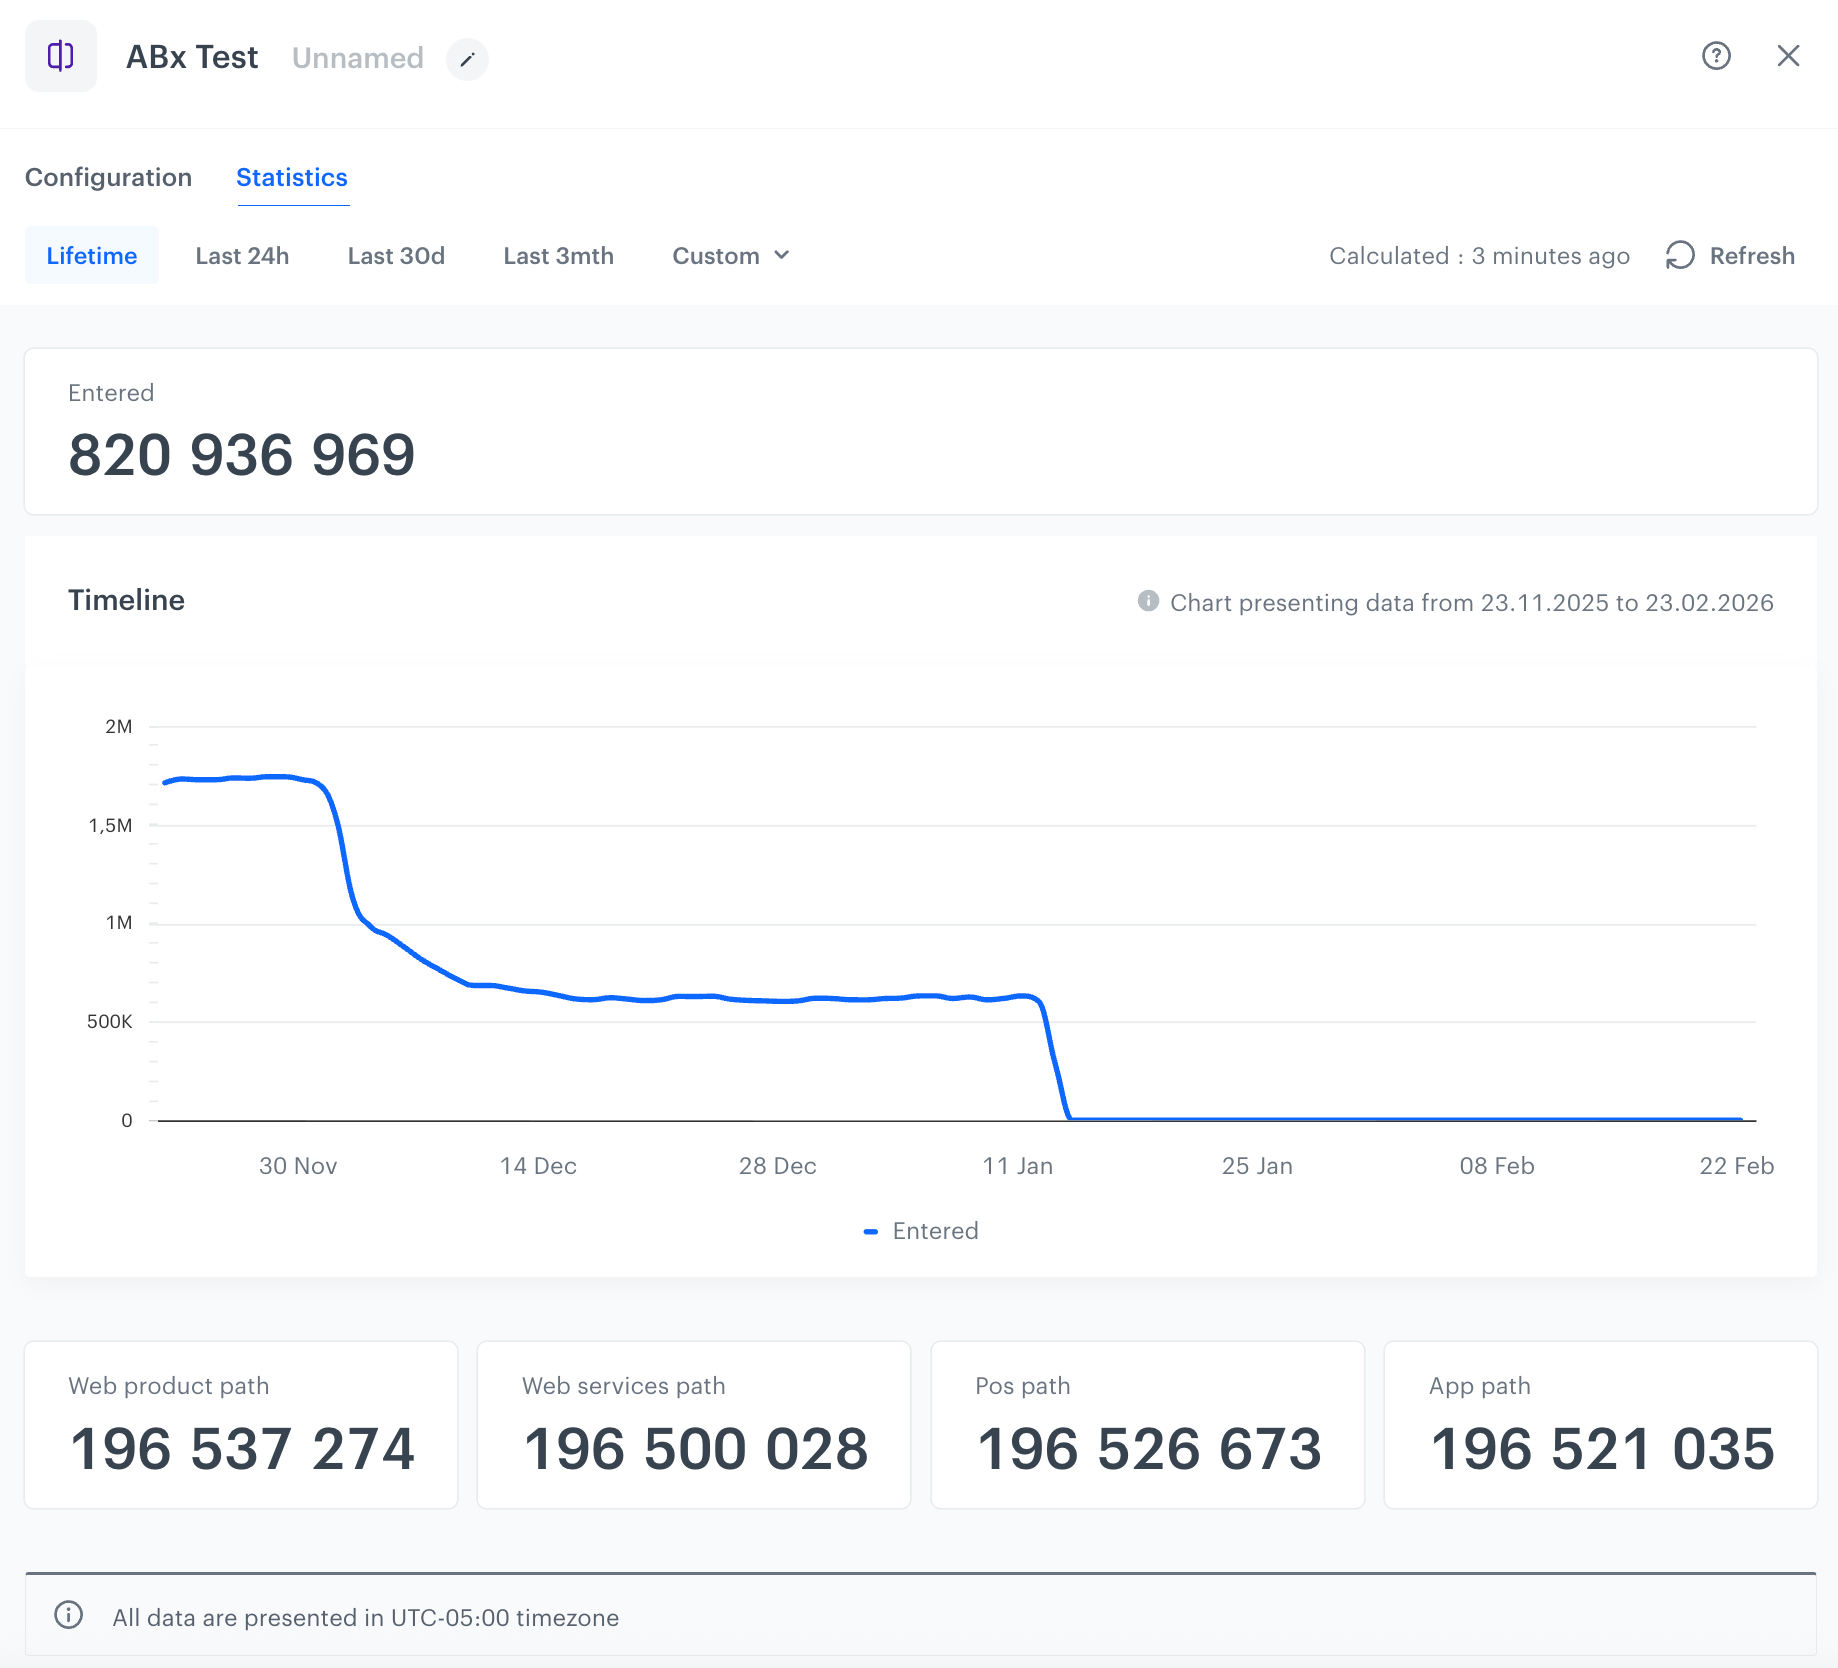
This is a simplified chart that displays the number of passages through the node over the last 7 days. The data is aggregated on a daily basis, and the chart uses a logarithmic scale. The chart purpose is to show change, not the exact amount of change. Note that 7 days is the maximum date range available for this particular chart.
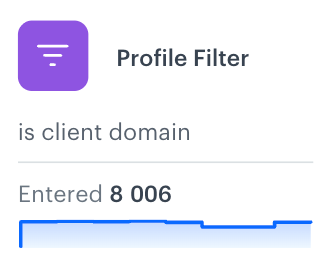
The chart on the node is available under the description of the node - Charts in the Statistics tab
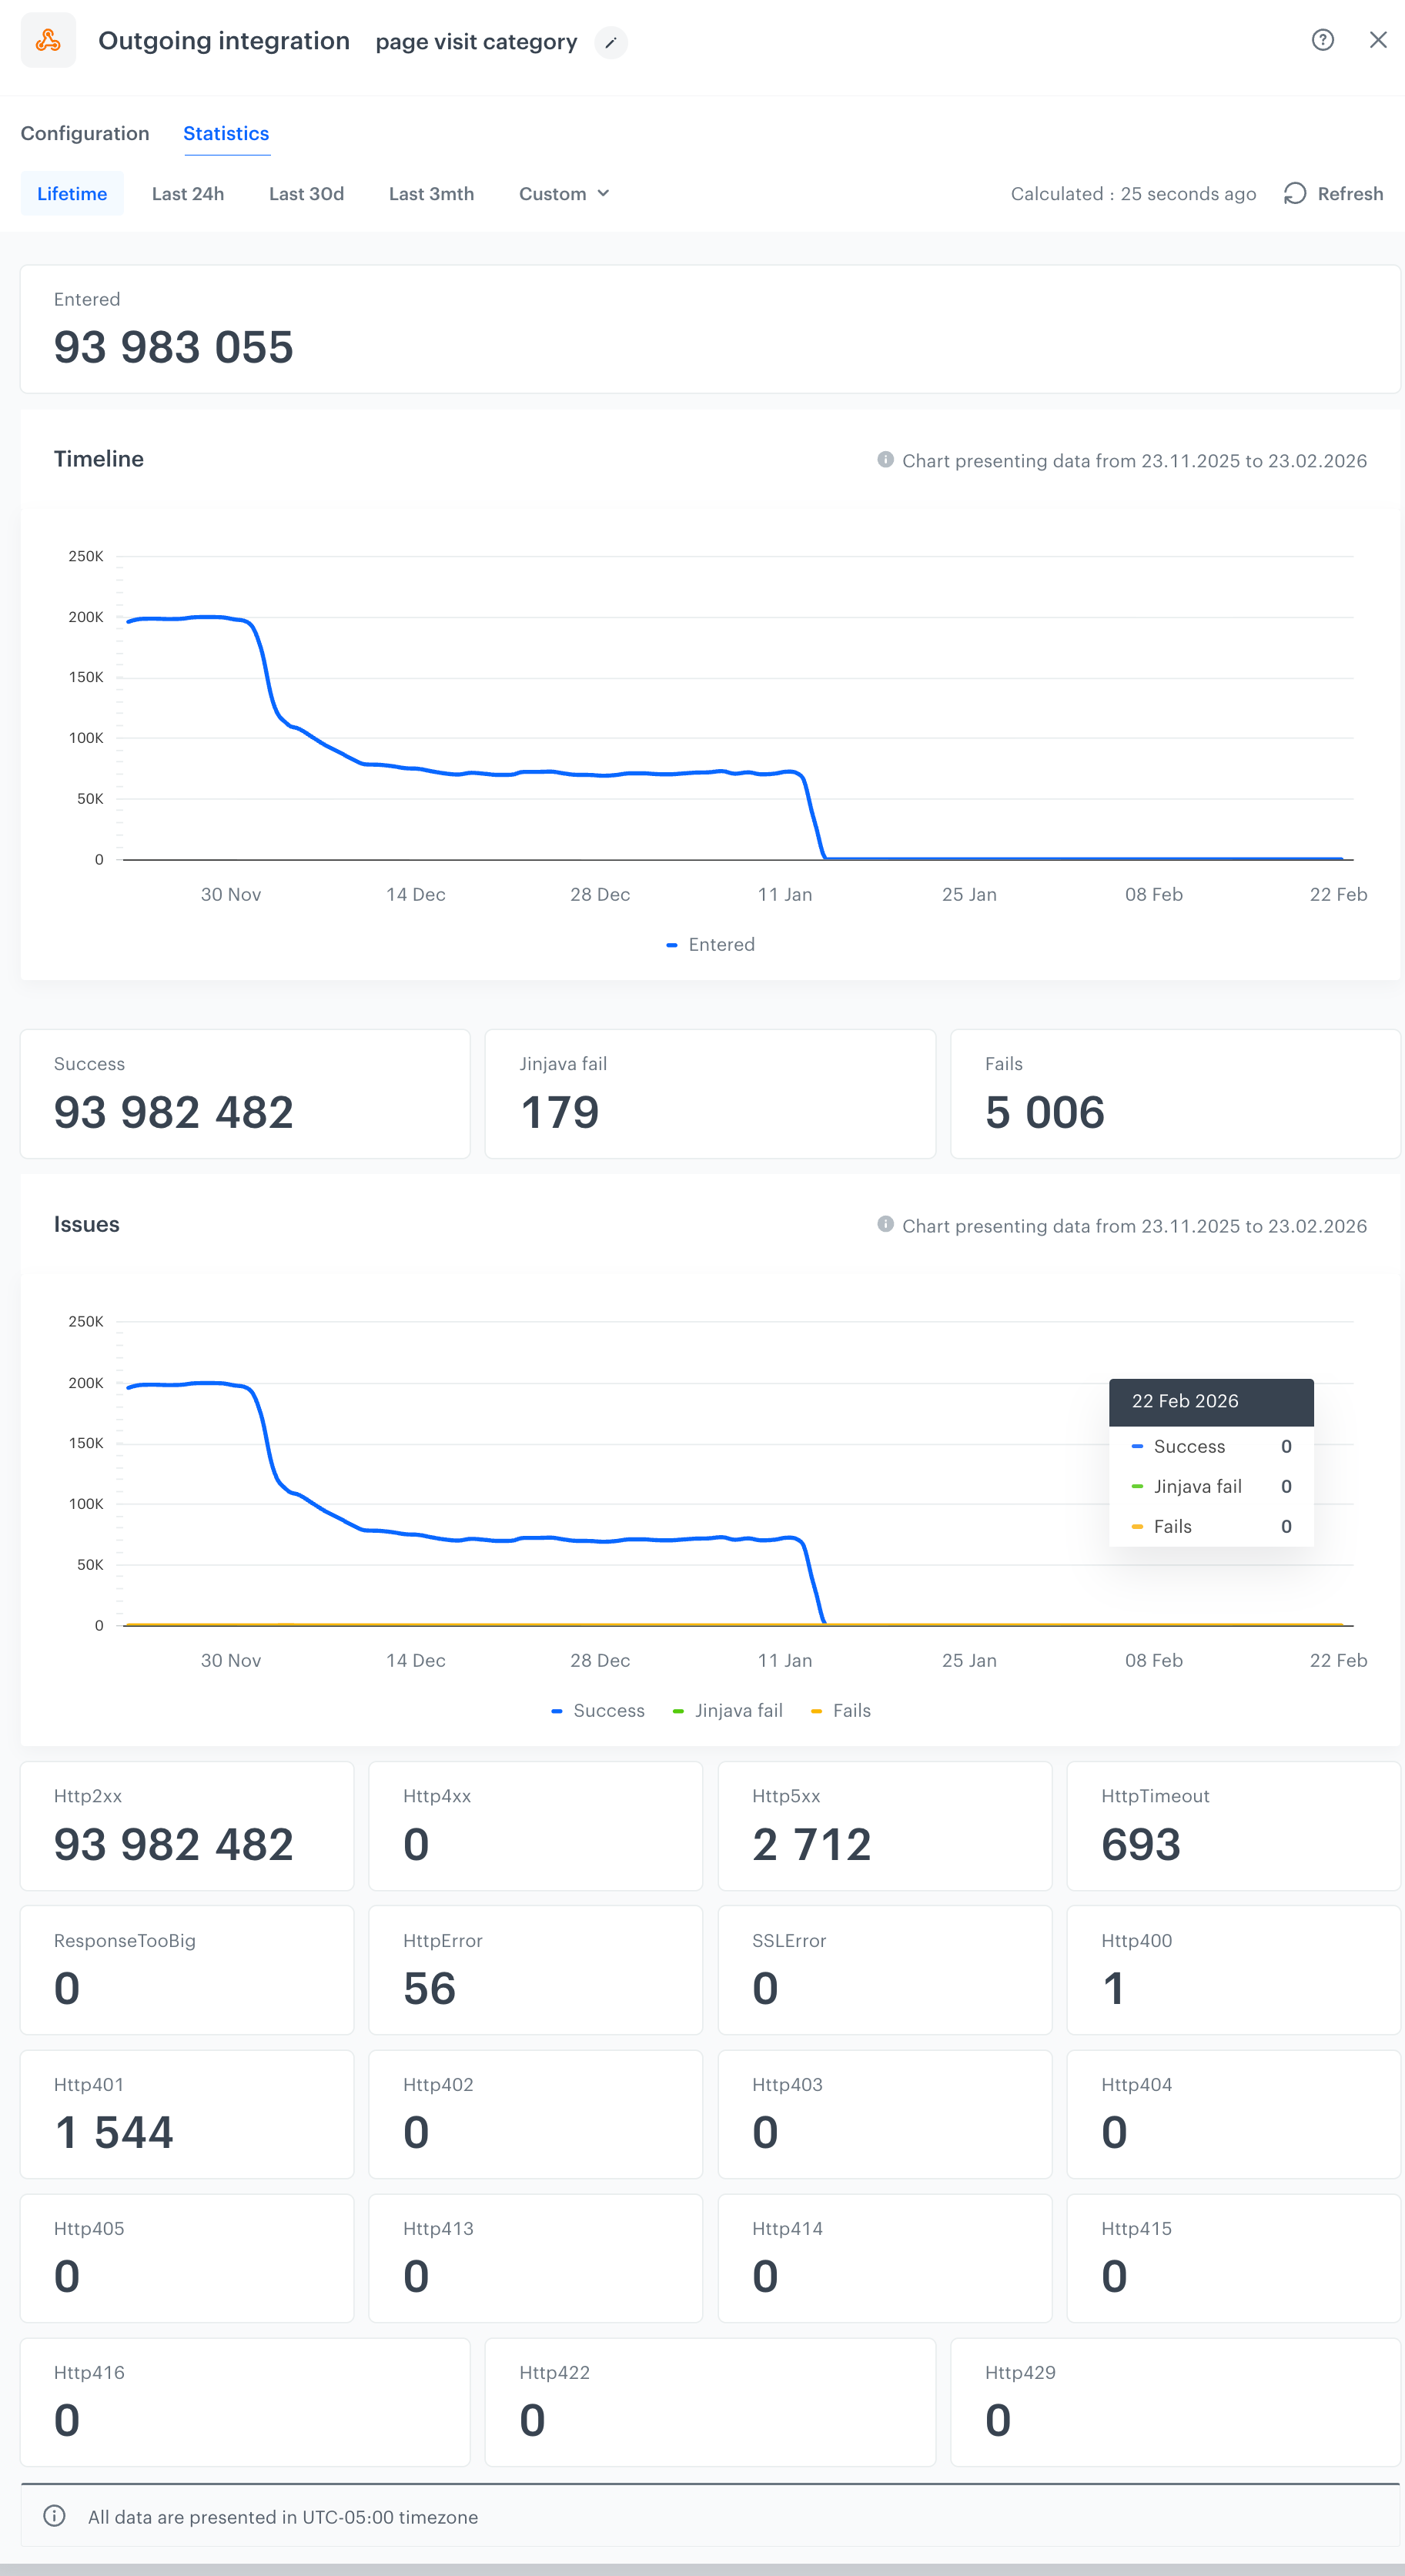
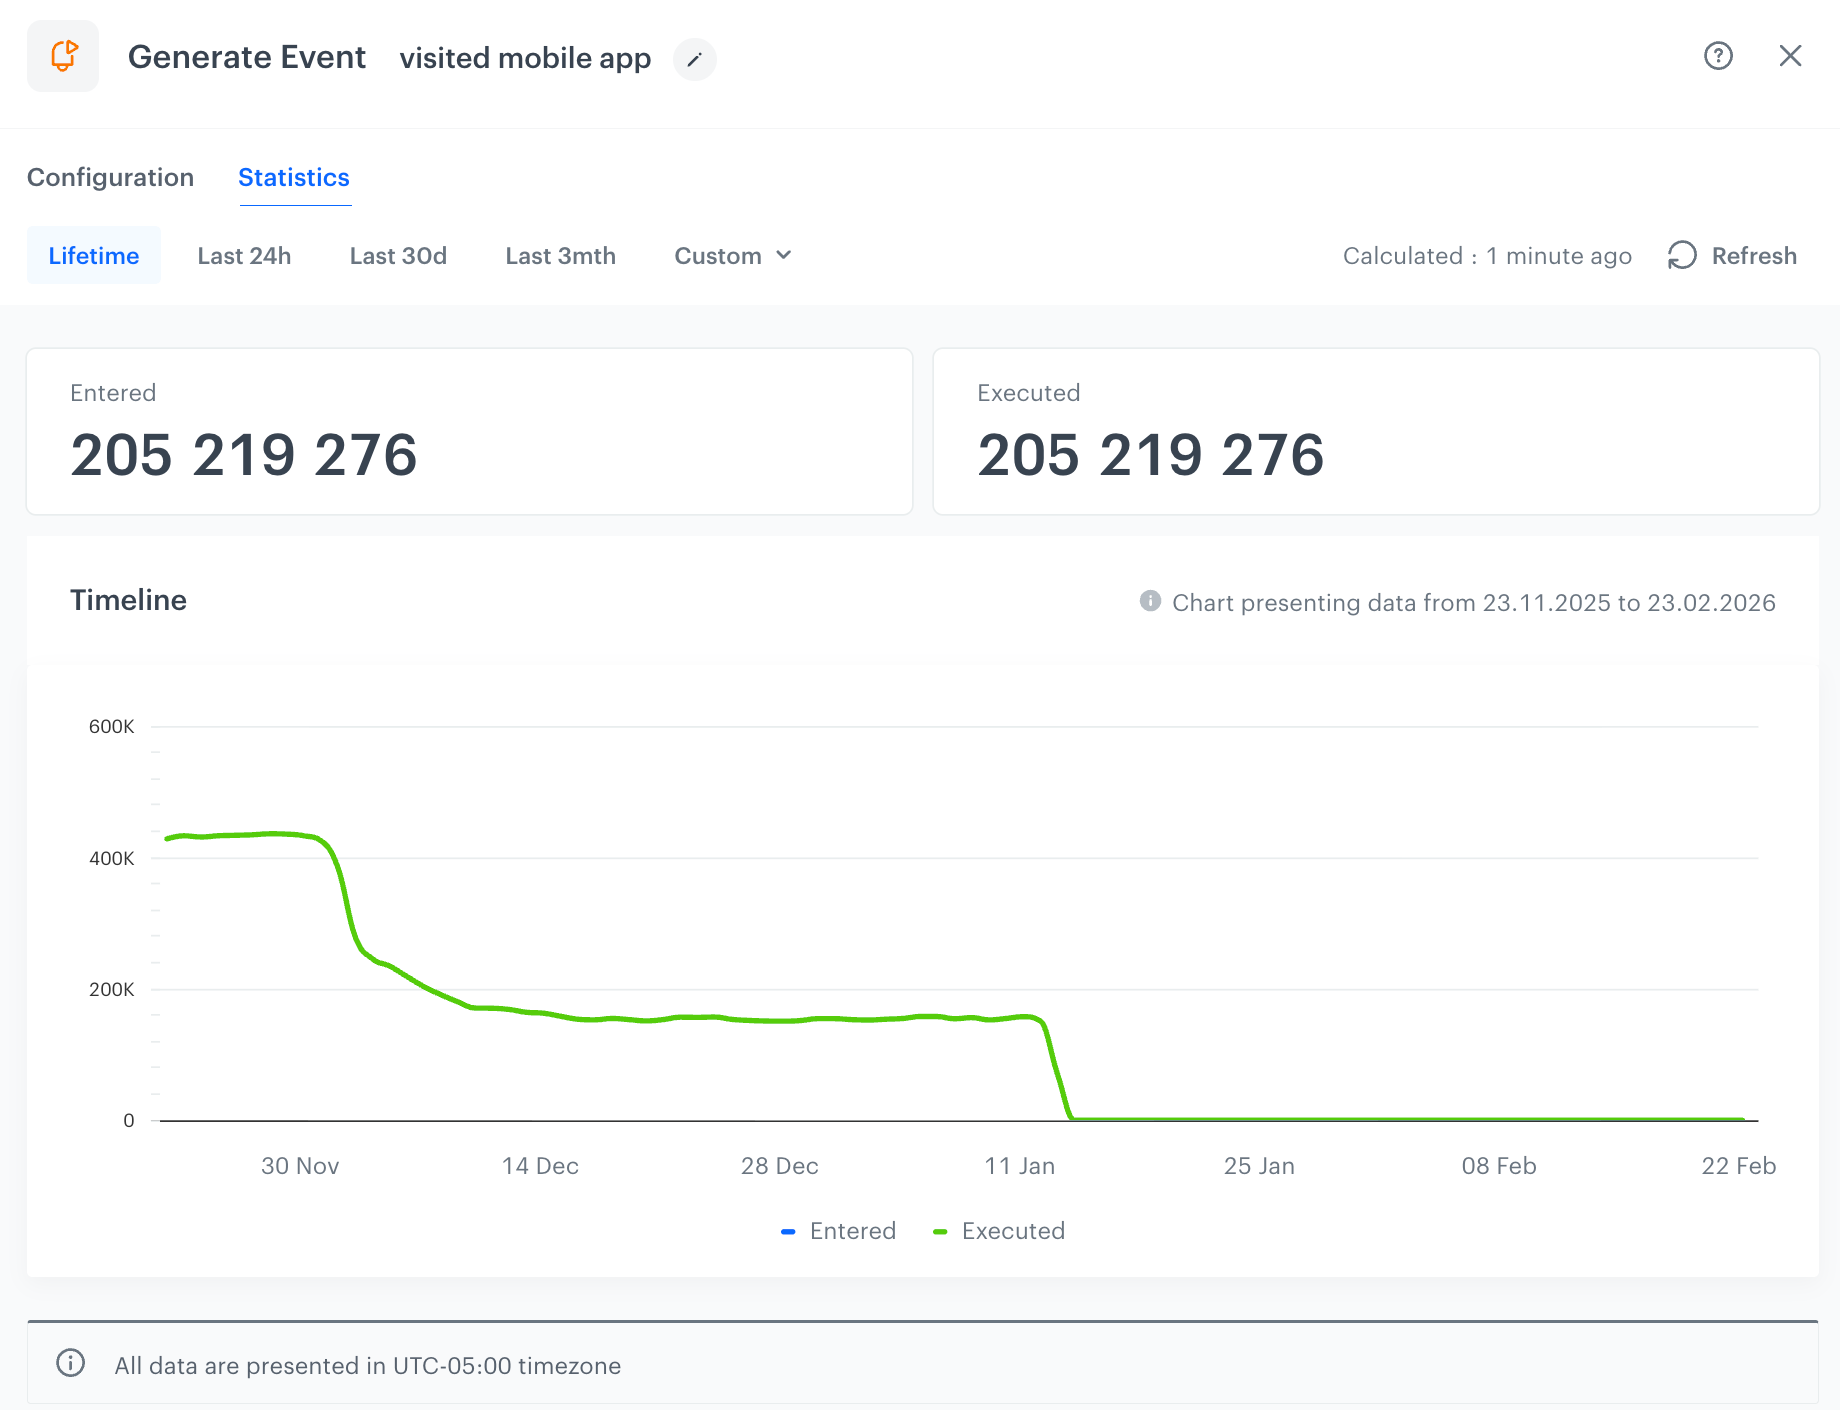
You can find them in entering the Statistics tab in the node’s details. Some nodes may contain more than one chart. By default, the charts present data covering up to last 30 days. You can customize the displayed date range by using the available tabs.
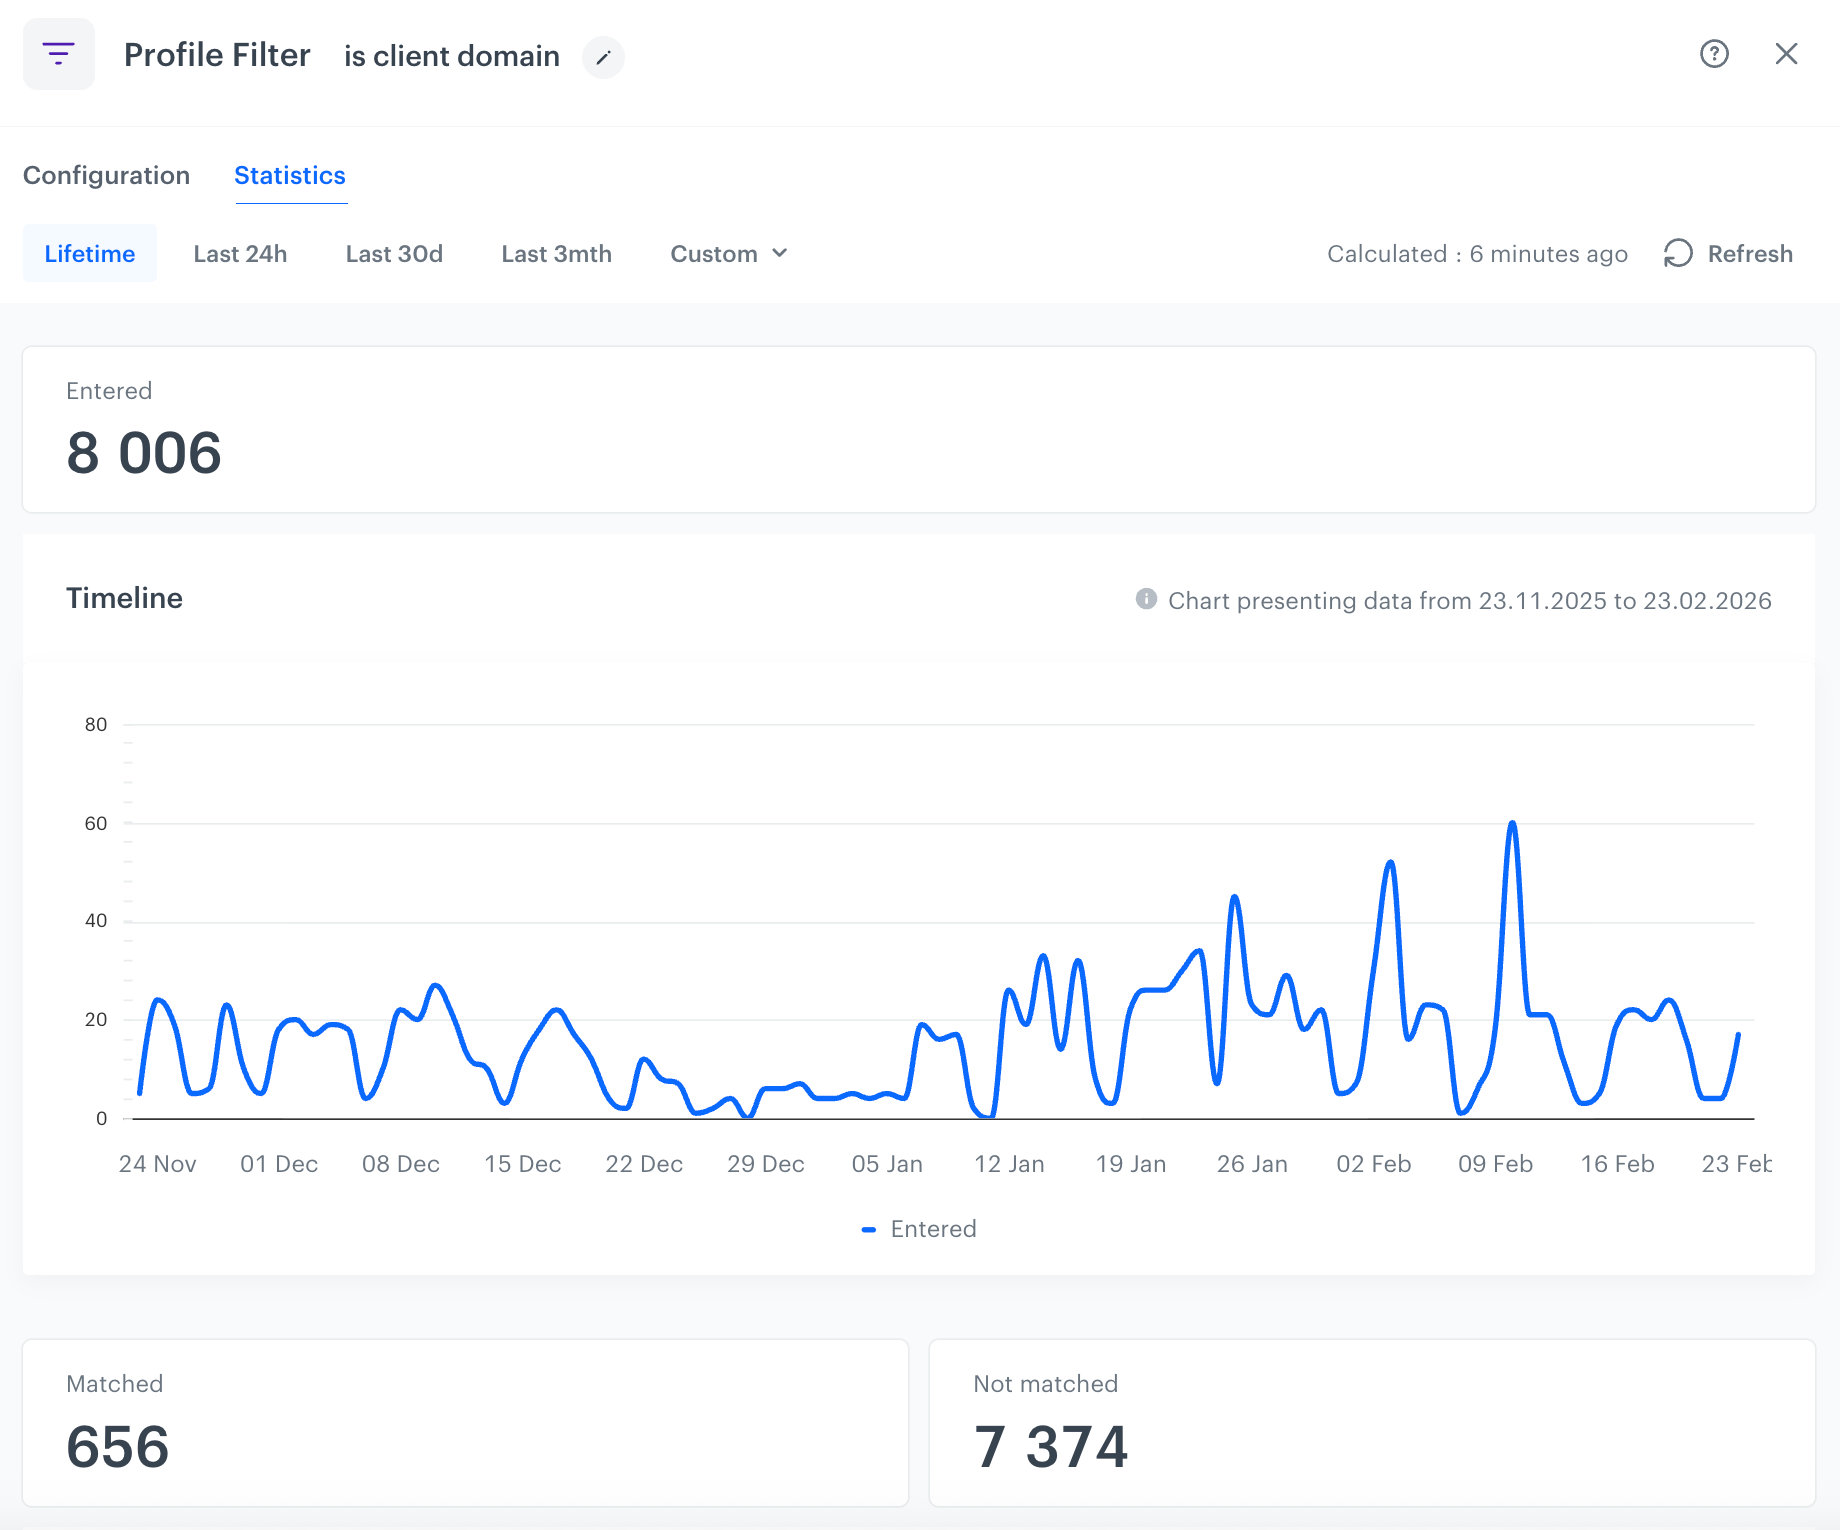
The Timeline chart is available after entering the details of the node in an active, paused or stopped workflow Statistics shown in the Timeline charts display data starting from the 20th of November 2025; earlier data is not included
Tabs
Statistics
The tabs allow you to select the date range for the statistics preview, affecting the chart and data displayed as follows:
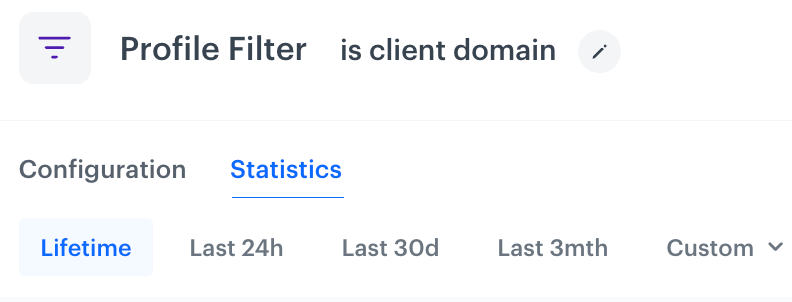
| Date range | Applies to summary numbers | Applies to chart | Description |
|---|---|---|---|
| Last 24h | Yes | Yes | Shows data from now to 24 hours backwards. |
| Last 30d | Yes | Yes | Shows data from the current day and previous 29 days. |
| Last 3mth | Yes | Yes | Shows data from the last 93 days. |
| Lifetime | Yes | No | Shows data since workspace creation; summary numbers only. |
| Custom | Yes | Yes (max 93 days) | Allows custom date range up to 93 days maximum. |
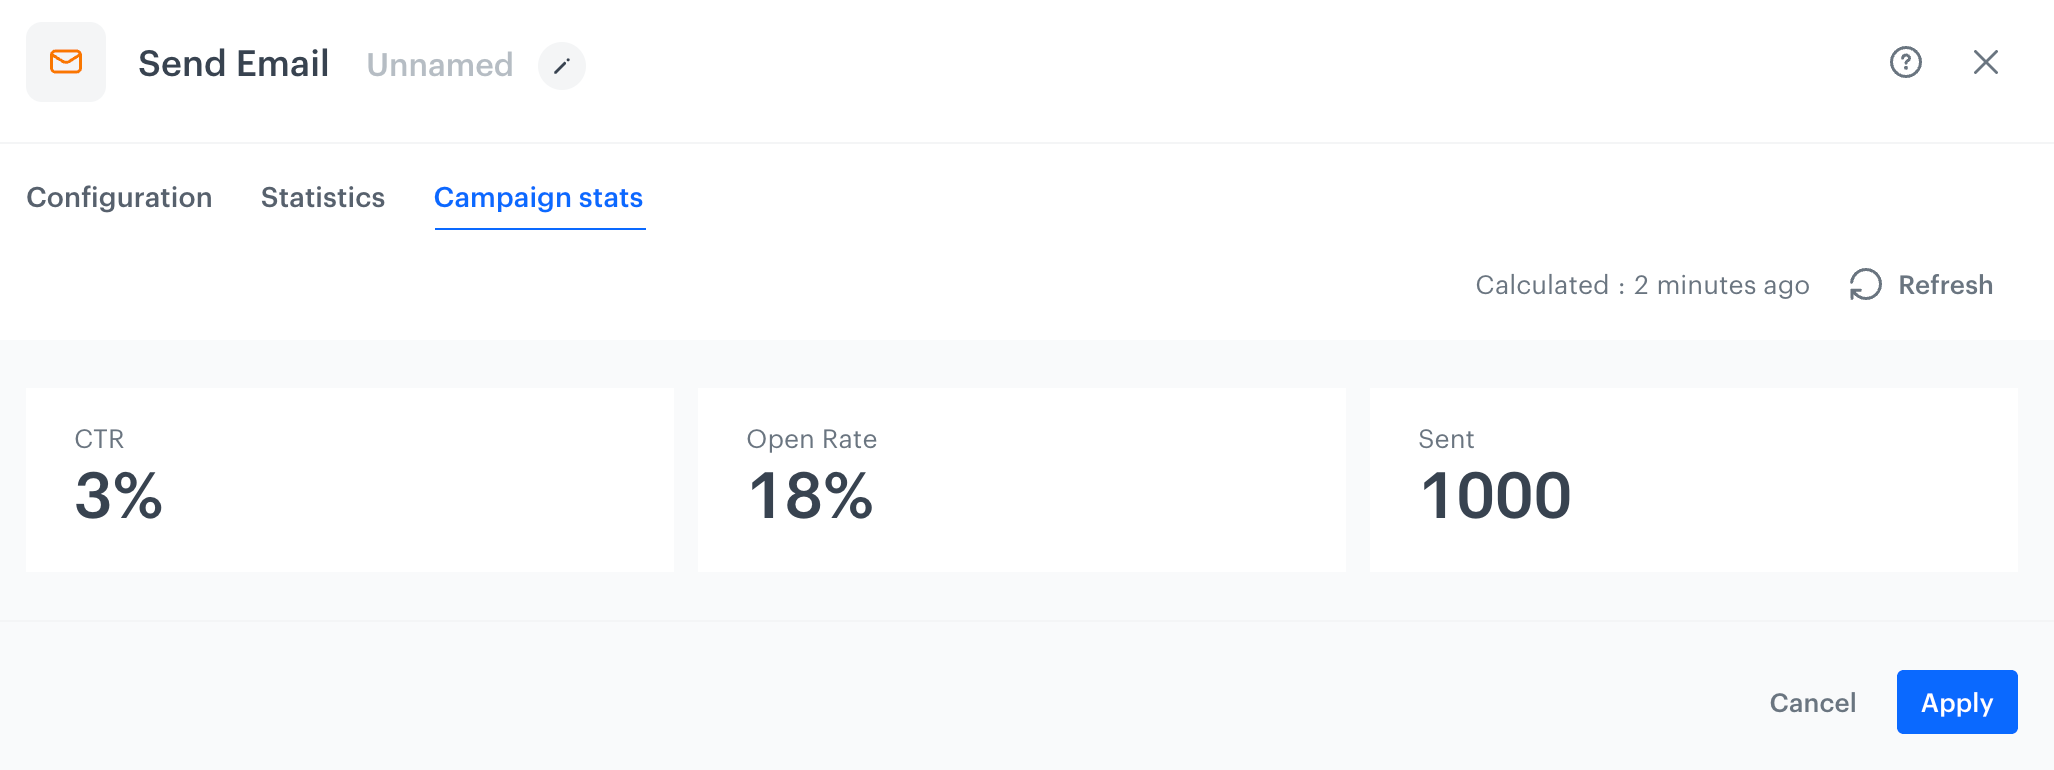
Campaign stats
The Campaign stats tab contains the statistics based on communication events (email events, mobile push events, SMS events, and web push events). Note that the statistics are limited to a specific period due to the retention policy.
The type of summary numbers may differ for each node. Full reference of statistics is available in the "Statistics reference" section in this article.
Statistics reference
The table below contains all statistics you can encounter in the nodes.
| Statistics | Description |
|---|---|
| Above limit | The number of passages that exceeded the "Flow Limiter" node limit. |
| Allocation in the "ABx Test" node | In the ABx Test node statistics, you can see the number of profiles allocated to the groups defined in the node. |
| Below limit | The number of passages that did not exceed the "Flow Limiter" node limit. |
| Connection errors | The number of unsuccessful executions due to connection errors during requests to the service targeted by this node. |
| CTR | The click-through rate (CTR) for the message (email, mobile push, and web push) sent through a workflow. Clicks from all profiles who passed through this node are included in the calculation. |
| Entered | The number of arrivals to the node. |
| Executed | The number of the node executions. |
| Fails | The number of unsuccessful passages through the node. |
| Http2xx | The number of node executions that resulted in 2xx responses to requests sent through the Outgoing Integration node or other integration nodes. |
| Http400 | The number of node executions that resulted in 400 responses (Bad Request) to requests sent through the Outgoing Integration node or other integration nodes. |
| Http401 | The number of node executions that resulted in 401 responses (Unauthorized) to requests sent through the Outgoing Integration node or other integration nodes. |
| Http402 | The number of node executions that resulted in 402 responses (Payment Required) to requests sent through the Outgoing Integration node or other integration nodes. |
| Http403 | The number of node executions that resulted in 403 responses (Forbidden) to requests sent through the Outgoing Integration node or other integration nodes. |
| Http404 | The number of node executions that resulted in 404 responses (Requested resource could not be found) to requests sent through the Outgoing Integration node or other integration nodes. |
| Http405 | The number of node executions that resulted in 405 responses (Method Not Allowed) to requests sent through the Outgoing Integration node or other integration nodes. |
| Http414 | The number of node executions that resulted in 414 responses (URI Too Long) to requests sent through the Outgoing Integration node or other integration nodes. |
| Http415 | The number of node executions that resulted in 415 responses (Unsupported Media Type) to requests sent through the Outgoing Integration node or other integration nodes. |
| Http416 | The number of node executions that resulted in 416 responses (Requested file portion (byte range) cannot be supplied) to requests sent through the Outgoing Integration node or other integration nodes. |
| Http422 | The number of node executions that resulted in 422 responses (Unprocessable Entity due to semantic errors) to requests sent through the Outgoing Integration node or other integration nodes. |
| Http429 | The number of node executions that resulted in 429 responses (Too Many Requests in a given time frame) to requests sent through the Outgoing Integration node or other integration nodes. |
| Http5xx | The number of node executions that resulted in 5xx responses to requests sent through the Outgoing Integration node or other integration nodes. |
| HttpError | The number of node executions that ended unsuccessfully due to errors in the request. |
| HttpTimeout | The number of times a request sent through the Outgoing Integration node or other integration node timed out. |
| Jinjava fail | The number of times a request sent through the Outgoing Integration node or other integration node failed due to a Jinjava render failure (occurs when using Jinjava to insert data not present in Synerise or when the syntax is wrong). |
| Matched | The number of passages through the matched path from the condition nodes. |
| Not found | The requested resource for the node could not be found. |
| Not matched | The number of passages through the unmatched path from the condition nodes. |
| Open Rate | The percentage of recipients who opened the email. Openings from all profiles passing through this node in the workflow are included in the calculation. |
| Response Too Big | The number of unsuccessful passages through the node due to exceeding the allowed data size in the response. |
| Sent | The number of messages sent (email, SMS, and web push). |
| Show | The number of times a web push notification was shown to a profile. |
| SSL Error | The number of unsuccessful passages due to errors related to establishing a secure connection between a client and a server using SSL/TLS protocols. |
| Success | The number of successful passages through the node. The service to which a request from this node was sent responded with a 200 status code. |
| Unique sent | The number of unique mobile push notifications sent. |
| Unauthorized | The number of unsuccessful passages through the node due to insufficient permissions. |
Examples
Event tracking
In Automation Hub, each activity (movement between steps in the workflow) of the profile is translated into events and available on the activity list.
All activities connected with Automation Hub are tracked by default. You don't have to enable tracking manually, the events related to moving between the nodes in the workflow will be available in Decision Hub and on the activity list on a profile's card (they are subject to retention).
- Events are kept in the database for a retention period that differs between workspaces. To check the retention of a particular event type, contact your system administrator.
- Events generated in relation to activities in workflows may appear with a slight delay due to overloads caused by increased traffic. This has no impact on workflow execution.